Loading [MathJax]/jax/output/PreviewHTML/jax.js
Skip to main page content
U.S. flag

An official website of the United States government

Access keys NCBI Homepage MyNCBI Homepage Main Content Main Navigation
. 2021 Mar:195:104367.
doi: 10.1016/j.jpubeco.2021.104367. Epub 2021 Jan 28.

Prosociality predicts health behaviors during the COVID-19 pandemic

Affiliations

Prosociality predicts health behaviors during the COVID-19 pandemic

Pol Campos-Mercade et al. J Public Econ. 2021 Mar.

Abstract

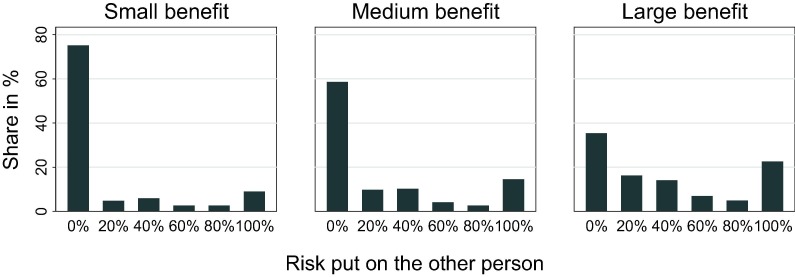
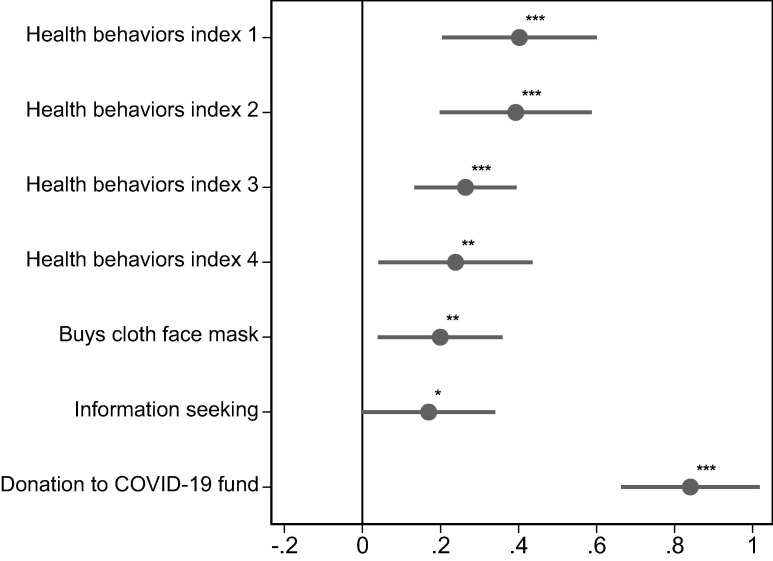
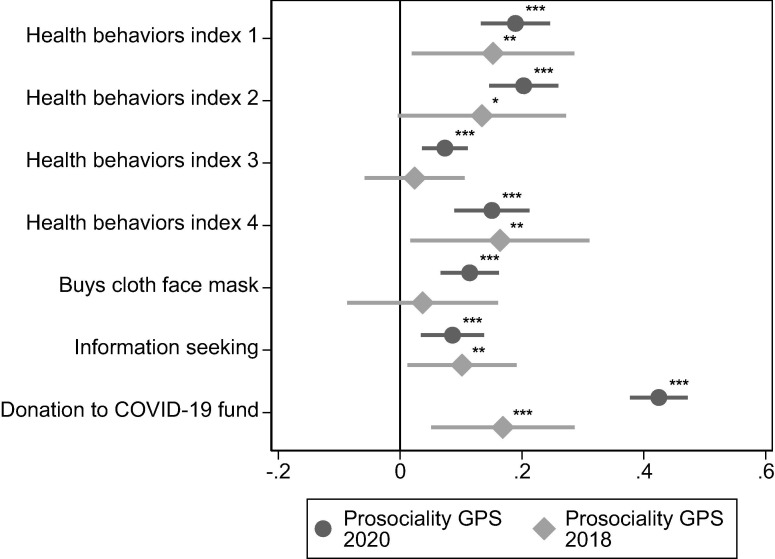
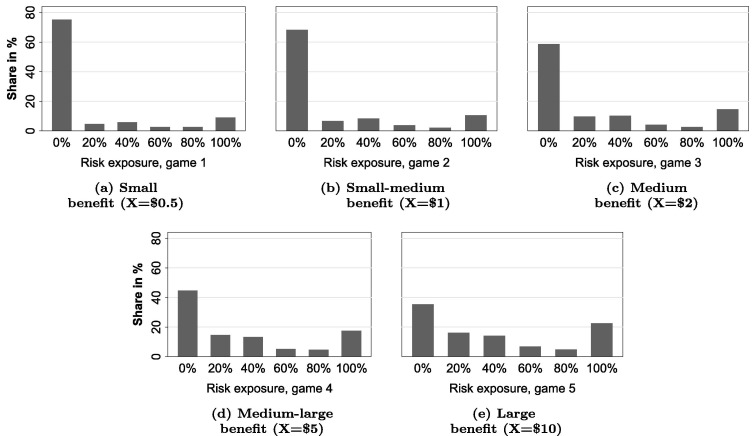
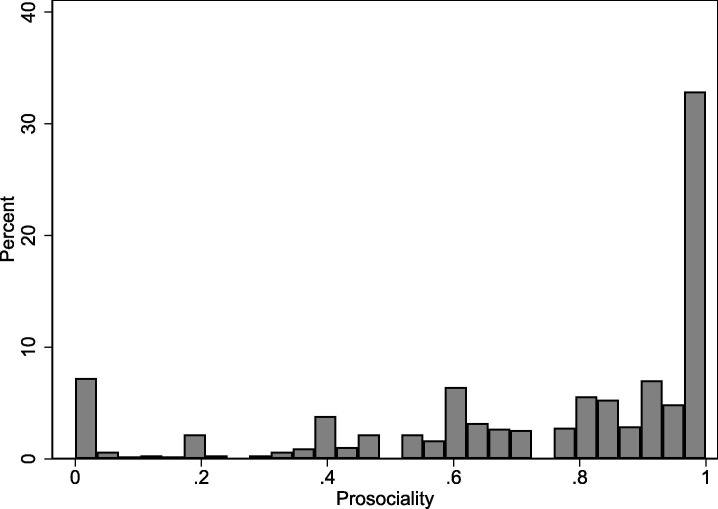
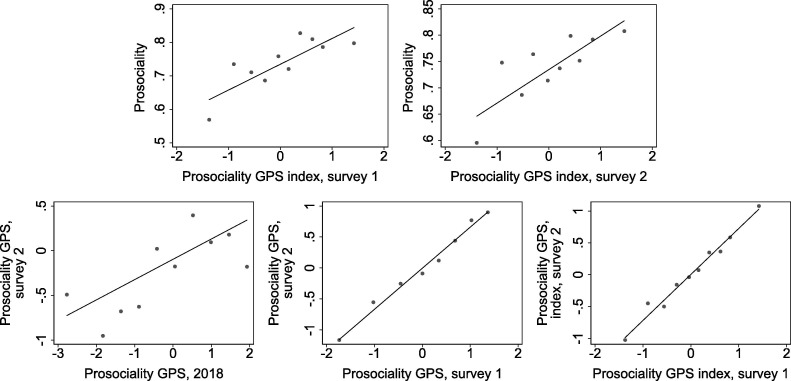
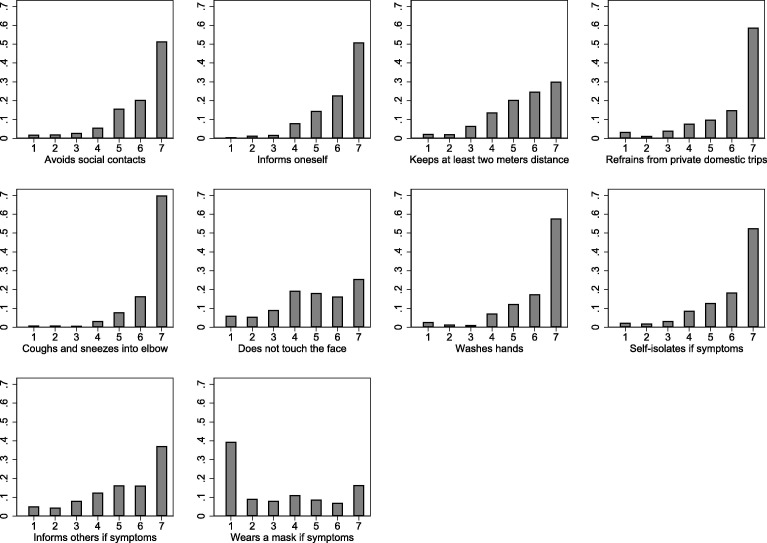
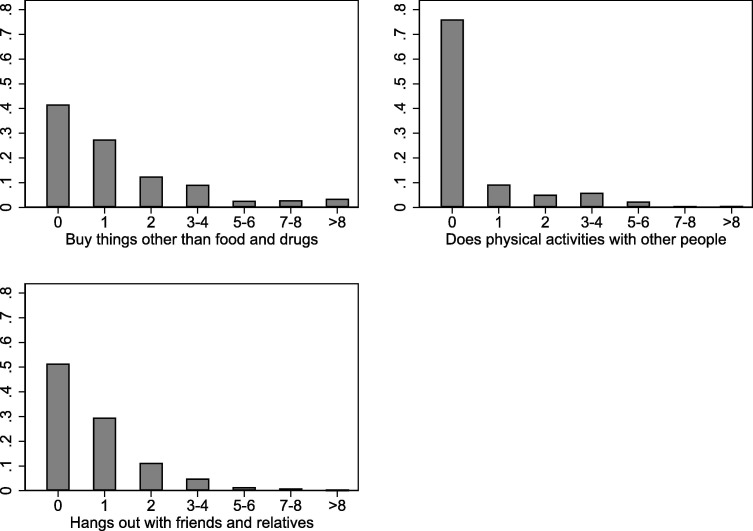
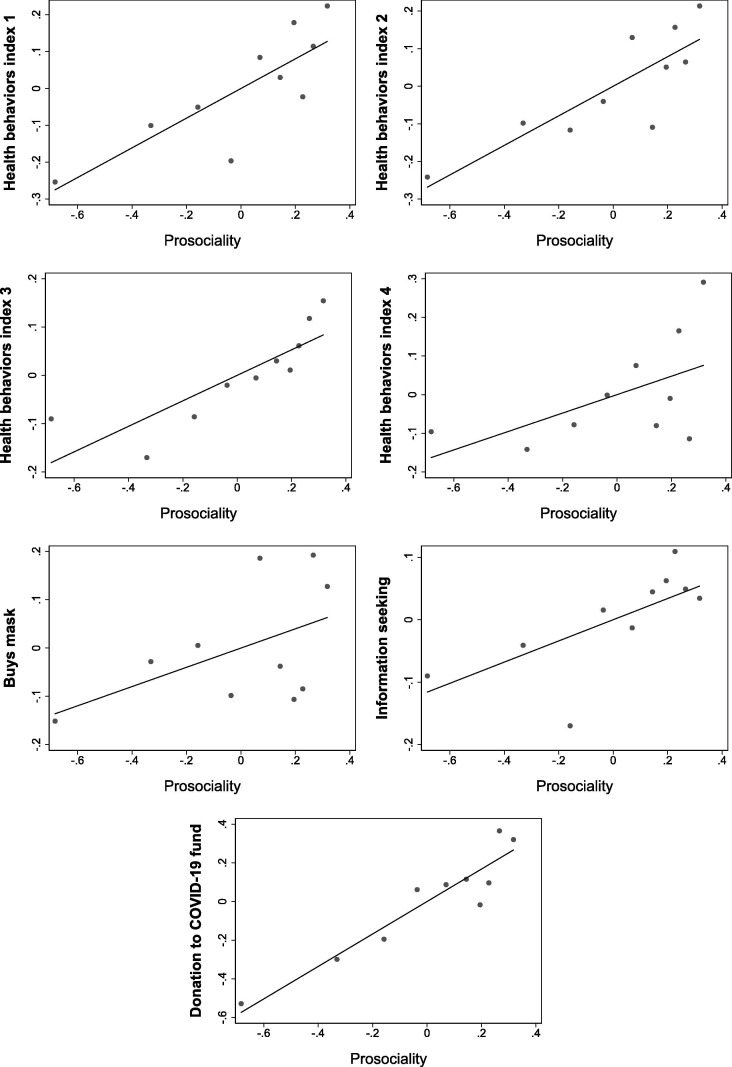
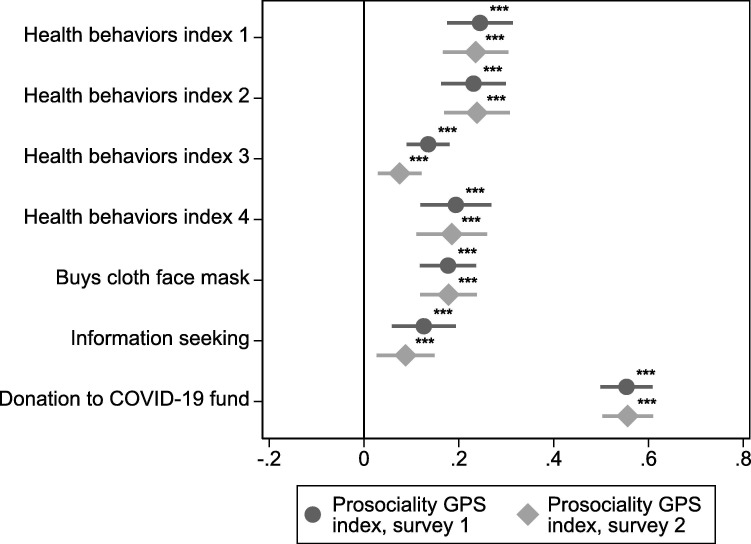
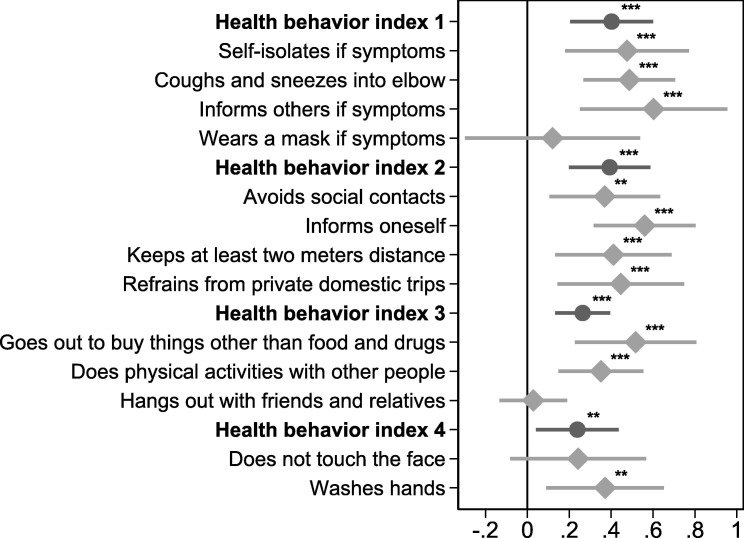
Socially responsible behavior is crucial for slowing the spread of infectious diseases. However, economic and epidemiological models of disease transmission abstract from prosocial motivations as a driver of behaviors that impact the health of others. In an incentivized study, we show that a large majority of people are very reluctant to put others at risk for their personal benefit. Moreover, this experimental measure of prosociality predicts health behaviors during the COVID-19 pandemic, measured in a separate and ostensibly unrelated study with the same people. Prosocial individuals are more likely to follow physical distancing guidelines, stay home when sick, and buy face masks. We also find that prosociality measured two years before the pandemic predicts health behaviors during the pandemic. Our findings indicate that prosociality is a stable, long-term predictor of policy-relevant behaviors, suggesting that the impact of policies on a population may depend on the degree of prosociality.

Keywords: COVID-19; Externalities; Health behavior; Prosociality; Social preferences.


Figures

Fig. 1
Fig. 1
Distribution of choices capturing prosociality. Note: This figure reports participants’ decisions in three of the five Risk Dictator Games that they played. In the Risk Dictator Game, a dictator chooses with what risk (0%, 20%, 40%, 60%, 80%, or 100%) a recipient loses his/her endowment of $10. Putting higher risk on the recipient increases the payoff of the dictator. In the small benefit game, dictators receive $0.5 for each additional 20% risk they put on the recipient. In the medium benefit game, they receive $2 for each additional 20% risk. In the large benefit game, they receive $10 for each additional 20% risk. Appendix Fig. A.1 shows the distribution for the two other games, in which the dictator increases his/her payoff by an additional $1 (small-medium benefit) and $5 (medium-large benefit) for each additional 20% risk.
Fig. 2
Fig. 2
Prosociality predicts health behaviors. Note: The figure shows coefficient estimates from a linear regression of the outcome variable (shown on the left) on prosociality, controlling for age and gender (preregistered specification). The coefficient estimates give the change in the outcome variables in standard deviations when moving from least prosocial (=0) to most prosocial (=1). Prosociality is measured by an incentivized experimental method where people can expose others to risks in return for a higher payment for themselves. The figure also shows standard errors bars corresponding to a two-sided significance test at the 10%-level. The comparison against 0 corresponds to a one-sided significance test at the 5%-level, as preregistered. We build the first four outcome variables based on thirteen self-reported health behaviors during the COVID-19 pandemic, exactly as preregistered and as described in Appendix Table A.1. To build the indices, we measured the perceptions of an independent sample of 100 Swedes on whether each health behavior protects others and oneself. We then grouped them in the following four categories: 1) Health behaviors index 1 (perceived to impact others strongly, and oneself moderately). Consists of: self-isolates if symptoms, coughs and sneezes into the elbow, informs others if symptoms, wears mask if symptoms. 2) Health behaviors index 2 (perceived to impact others strongly, and oneself strongly). Consists of: avoids social contacts, informs oneself, keeps at least two meters distance, refrains from private domestic trips. 3) Health behaviors index 3 (perceived to impact others strongly, and oneself strongly). Consists of: avoids leaving the house to buy things other than food and drugs, avoids doing physical activities with other people, avoids hanging out with friends and relatives. 4) Health behaviors index 4 (perceived to impact others moderately, and oneself strongly). Consists of: avoids touching the face, washes hands regularly. The remaining three outcome variables are: 5) Buys cloth face mask: whether the participant chooses a cloth face mask (that mostly protects others) over $20, 6) Information seeking: number of clicks to websites with information about how to help and protect others, and 7) Donation to COVID-19 fund: Donation amount to a COVID-19 solidarity fund by the WHO and UNICEF. * , ** p<0.05, *** p<0.01.
Fig. 3
Fig. 3
A second measure of prosociality collected in 2020 and in 2018 predicts health behaviors. Note: The figure shows coefficient estimates from a linear regression of the outcome variable (shown on the left) on prosociality, controlling for age and gender (preregistered specification). The figure replicates Fig. 2 using a second measure of prosociality. Prosociality is captured by an experimentally validated question on people’s willingness to give to a good cause without expecting anything in return used in the Global Preference Survey. We use this measure in the current social preferences survey (Prosociality GPS 2020) and for a subset of 197 participants in 2018 (Prosociality GPS 2018). * p<0.10, ** p<0.05, *** p<0.01.
Fig. A.1
Fig. A.1
Distribution of choices capturing prosociality. Note: The figure shows the distribution of choices in the five Risk Dictator Games. The title of the panels capture the extent to which it is beneficial for the dictator to expose the recipient to risk.
Fig. A.2
Fig. A.2
Distribution of prosociality: willingness to expose others to risk. Note: The figure shows the distribution of our measure of prosociality. We construct this measure based on the five choices in the Risk Dictator Game. Let r(ci,g){0,0.2,0.4,0.6,0.8,1} be the risk participant i puts on the other player in game g{1,,5}. We measure i’s prosociality as 1-1/5g=15r(ci,g), that is, one minus the average risk she puts on the other player. The measure has a value of 1 if the participant always choose the option that puts no risk on the other player, and 0 if the participant always choose the option that puts the maximal risk on the other player.
Fig. A.3
Fig. A.3
Correlation of prosociality measures. Note: The figures show the correlations between different measures of prosociality. “Prosociality” is our main measure. Moreover, we measure “Prosociality GPS” in both the health behavior survey (survey 1) and the social preferences survey (survey 2). We call these measures Prosociality GPS, survey 1 and Prosociality GPS, survey 2. We also have the same measure for 2018 study Prosociality GPS, 2018. Finally, “Prosociality GPS index” is an index based on Prosociality GPS and Prosociality GPS, item 2 which we collected in the health behavior survey and the social preferences survey.
Fig. A.4
Fig. A.4
Distribution of health behaviors that form the basis of the health behavior indices 1, 2, and 4. Note: For each item, we ask participants to what degree the described behavior applies to their own behavior on a 7-point scale from “does not apply at all” to “applies very much.”
Fig. A.5
Fig. A.5
Distribution of health behaviors that form the basis of the health behavior index 3. Note: We asked participants how often they left their home in the last 7 days for each of these three reasons. Possible answers were: Never, 1, 2, 3–4, 5–6, 7–8 or more than 8 times.
Fig. A.6
Fig. A.6
Distribution of clicks which form the basis for “information seeking”. Note: We measured whether participants clicked different links to information about how to fight the COVID-19 pandemic. On the webpage of the Swedish Red Cross, participants learn more about how to help the weakest and healthcare professionals. On the webpage of the Public Health Authority, participants learn about the latest updates on how to help and protect others. On the webpage on blood donations, participants learn how they can donate blood, as there is a lack of blood in Sweden related to COVID-19.
Fig. A.7
Fig. A.7
Distribution of donation amounts to the COVID-19 fund – “donation to COVID-19 fund”. Note: Distribution of participants’ donation (in between SEK 0 and SEK 100) to a solidarity response fund by the World Health Organization and UNICEF to fight the COVID-19 pandemic.
Fig. A.8
Fig. A.8
Distribution of choice between money and a cloth face mask – “buys a cloth face mask”. Note: We asked participants to chose between a cloth face mask and SEK 200. The figure shows the distribution of choices.
Fig. B.1
Fig. B.1
Relationships between behaviors and prosociality. Note: The figure shows the relationship between outcomes and prosociality conditional on age and gender across deciles of prosociality. It also controls for past behavior when looking at health behaviors index 3.
Fig. B.2
Fig. B.2
Prosociality GPS indices in the 2020 surveys predict health behaviors. Note: The figure shows coefficient estimates from a linear regression of the outcome variable (shown on the left) on two alternative measures of prosociality collected in 2020, controlling for age and gender (preregistered specification). The figure replicates Fig. 2 using indices of prosociality. Prosociality is captured by an index from two experimentally validated questions on people’s willingness to give to a good cause without expecting anything in return and giving to charity used in the Global Preference Survey. We collected this measure both in the health behavior survey (survey 1) and the social preferences survey (survey 2).
Fig. B.3
Fig. B.3
Results for all behaviors that we aggregate into indices separately. Note: The figure shows coefficient estimates from a linear regression of the outcome variable (shown on the left) on prosociality, controlling for age and gender (preregistered specification). The figure also shows standard errors bars corresponding to a two-sided significance test at the 10%-level. The comparison against 0 corresponds to a one-sided significance test at the 5%-level, as preregistered. * p<0.10, ** p<0.05, *** p<0.01.
None

Similar articles

Cited by

References

    1. Alfaro, Laura, Faia, Ester, Lamersdorf, Nora, Saidi, Farzad, 2020. Social interactions in pandemics: Fear, altruism, and reciprocity. NBER WP No. 27134.
    1. Almås Ingvild, Cappelen Alexander W., Tungodden Bertil. Cutthroat capitalism versus cuddly Socialism: Are Americans more meritocratic and efficiency-seeking than Scandinavians? J. Polit. Econ. 2020;128(5):1753–1788.
    1. Anderson Lisa R., Mellor Jennifer M. Predicting health behaviors with an experimental measure of risk preference. J. Health Econ. 2008;27(5):1260–1274. - PubMed
    1. Andersson Ola, Holm Håkan J., Tyran Jean-Robert, Wengström Erik. Risking other people’s money: Experimental evidence on the role of incentives and personality traits. Scandinavian J. Econ. 2020;122(2):648–674.
    1. Andreoni James, Miller John. Giving According to GARP: An Experimental Test of the Consistency of Preferences for Altruism. Econometrica. 2002;70(2):737–753.

LinkOut - more resources