Beyond the Warburg Effect: Oxidative and Glycolytic Phenotypes Coexist within the Metabolic Heterogeneity of Glioblastoma
- PMID: 33498369
- PMCID: PMC7922554
- DOI: 10.3390/cells10020202
Beyond the Warburg Effect: Oxidative and Glycolytic Phenotypes Coexist within the Metabolic Heterogeneity of Glioblastoma
Abstract
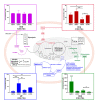
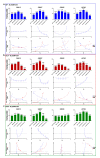
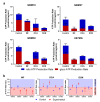
Glioblastoma (GBM) is the most aggressive primary brain tumor, with a median survival at diagnosis of 16-20 months. Metabolism represents a new attractive therapeutic target; however, due to high intratumoral heterogeneity, the application of metabolic drugs in GBM is challenging. We characterized the basal bioenergetic metabolism and antiproliferative potential of metformin (MF), dichloroacetate (DCA), sodium oxamate (SOD) and diazo-5-oxo-L-norleucine (DON) in three distinct glioma stem cells (GSCs) (GBM18, GBM27, GBM38), as well as U87MG. GBM27, a highly oxidative cell line, was the most resistant to all treatments, except DON. GBM18 and GBM38, Warburg-like GSCs, were sensitive to MF and DCA, respectively. Resistance to DON was not correlated with basal metabolic phenotypes. In combinatory experiments, radiomimetic bleomycin exhibited therapeutically relevant synergistic effects with MF, DCA and DON in GBM27 and DON in all other cell lines. MF and DCA shifted the metabolism of treated cells towards glycolysis or oxidation, respectively. DON consistently decreased total ATP production. Our study highlights the need for a better characterization of GBM from a metabolic perspective. Metabolic therapy should focus on both glycolytic and oxidative subpopulations of GSCs.
Keywords: energy metabolism; gene expression profiling; glioblastoma; glycolysis; oxidative phosphorylation; therapeutics.
Conflict of interest statement
The authors declare no conflict of interest.
Figures


Similar articles
-
Downregulated CLIP3 induces radioresistance by enhancing stemness and glycolytic flux in glioblastoma.J Exp Clin Cancer Res. 2021 Sep 6;40(1):282. doi: 10.1186/s13046-021-02077-4. J Exp Clin Cancer Res. 2021. PMID: 34488821 Free PMC article.
-
High expression of RFX4 is associated with tumor progression and poor prognosis in patients with glioblastoma.Int J Neurosci. 2021 Jan;131(1):7-14. doi: 10.1080/00207454.2020.1732969. Epub 2020 Mar 2. Int J Neurosci. 2021. PMID: 32075484
-
Metabolic heterogeneity and plasticity of glioma stem cells in a mouse glioblastoma model.Neuro Oncol. 2018 Feb 19;20(3):343-354. doi: 10.1093/neuonc/nox170. Neuro Oncol. 2018. PMID: 29016888 Free PMC article.
-
The Glioblastoma Microenvironment: Morphology, Metabolism, and Molecular Signature of Glial Dynamics to Discover Metabolic Rewiring Sequence.Int J Mol Sci. 2021 Mar 24;22(7):3301. doi: 10.3390/ijms22073301. Int J Mol Sci. 2021. PMID: 33804873 Free PMC article. Review.
-
Energy Metabolism in IDH1 Wild-Type and IDH1-Mutated Glioblastoma Stem Cells: A Novel Target for Therapy?Cells. 2021 Mar 22;10(3):705. doi: 10.3390/cells10030705. Cells. 2021. PMID: 33810170 Free PMC article. Review.
Cited by
-
The Hallmarks of Glioblastoma: Heterogeneity, Intercellular Crosstalk and Molecular Signature of Invasiveness and Progression.Biomedicines. 2022 Mar 30;10(4):806. doi: 10.3390/biomedicines10040806. Biomedicines. 2022. PMID: 35453557 Free PMC article. Review.
-
Flavin fluorescence lifetime and autofluorescence optical redox ratio for improved visualization and classification of brain tumors.Front Oncol. 2023 Feb 20;13:1105648. doi: 10.3389/fonc.2023.1105648. eCollection 2023. Front Oncol. 2023. PMID: 36890834 Free PMC article.
-
Review of Current Human Genome-Scale Metabolic Models for Brain Cancer and Neurodegenerative Diseases.Cells. 2022 Aug 10;11(16):2486. doi: 10.3390/cells11162486. Cells. 2022. PMID: 36010563 Free PMC article. Review.
-
Biosensor-Enhanced Organ-on-a-Chip Models for Investigating Glioblastoma Tumor Microenvironment Dynamics.Sensors (Basel). 2024 Apr 30;24(9):2865. doi: 10.3390/s24092865. Sensors (Basel). 2024. PMID: 38732975 Free PMC article. Review.
-
Therapeutic Drug-Induced Metabolic Reprogramming in Glioblastoma.Cells. 2022 Sep 22;11(19):2956. doi: 10.3390/cells11192956. Cells. 2022. PMID: 36230918 Free PMC article. Review.
References
-
- Ostrom Q.T., Gittleman H., Farah P., Ondracek A., Chen Y., Wolinsky Y., Stroup N.E., Kruchko C., Barnholtz-Sloan J.S. CBTRUS Statistical Report: Primary Brain and Central Nervous System Tumors Diagnosed in the United States in 2006–2010. Neuro-Oncology. 2013;15:ii1–ii56. doi: 10.1093/neuonc/not151. - DOI - PMC - PubMed
-
- Tamimi A.F., Juweid M. Glioblastoma [Internet] Codon Publications; Singapore: 2017. Epidemiology and Outcome of Glioblastoma. 201921345W. - PubMed
-
- Louis D.N., Perry A., Reifenberger G., Von Deimling A., Figarella-Branger D., Cavenee W.K., Ohgaki H., Wiestler O.D., Kleihues P., Ellison D.W. The 2016 World Health Organization Classification of Tumors of the Central Nervous System: A summary. Acta Neuropathol. 2016;131:803–820. doi: 10.1007/s00401-016-1545-1. - DOI - PubMed
-
- Verhaak R.G., Hoadley K.A., Purdom E., Wang V., Qi Y., Wilkerson M.D., Miller C.R., Ding L., Golub T., Mesirov J.P., et al. Integrated Genomic Analysis Identifies Clinically Relevant Subtypes of Glioblastoma Characterized by Abnormalities in PDGFRA, IDH1, EGFR, and NF1. Cancer Cell. 2010;17:98–110. doi: 10.1016/j.ccr.2009.12.020. - DOI - PMC - PubMed
Publication types
MeSH terms
Substances
Grants and funding
LinkOut - more resources
Full Text Sources
Other Literature Sources
Medical

