. 2022 Jan;71(1):119-128.
doi: 10.1136/gutjnl-2020-323553. Epub 2021 Jan 12.

PI3K-driven HER2 expression is a potential therapeutic target in colorectal cancer stem cells

Affiliations

PI3K-driven HER2 expression is a potential therapeutic target in colorectal cancer stem cells

Laura Rosa Mangiapane et al. Gut. 2022 Jan.

Abstract

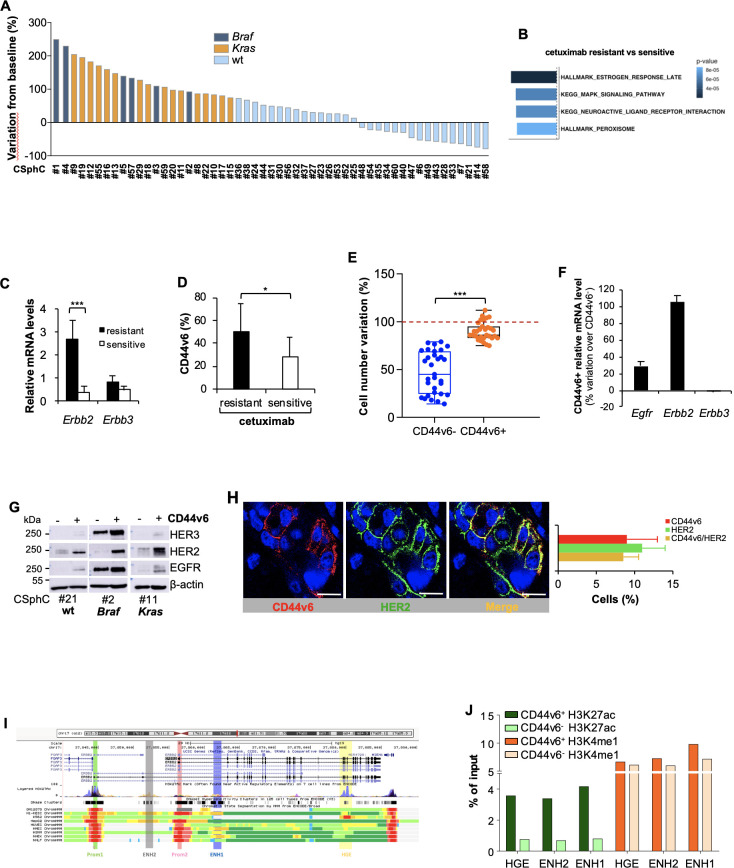
Objective: Cancer stem cells are responsible for tumour spreading and relapse. Human epidermal growth factor receptor 2 (HER2) expression is a negative prognostic factor in colorectal cancer (CRC) and a potential target in tumours carrying the gene amplification. Our aim was to define the expression of HER2 in colorectal cancer stem cells (CR-CSCs) and its possible role as therapeutic target in CRC resistant to anti- epidermal growth factor receptor (EGFR) therapy.

Design: A collection of primary sphere cell cultures obtained from 60 CRC specimens was used to generate CR-CSC mouse avatars to preclinically validate therapeutic options. We also made use of the ChIP-seq analysis for transcriptional evaluation of HER2 activation and global RNA-seq to identify the mechanisms underlying therapy resistance.

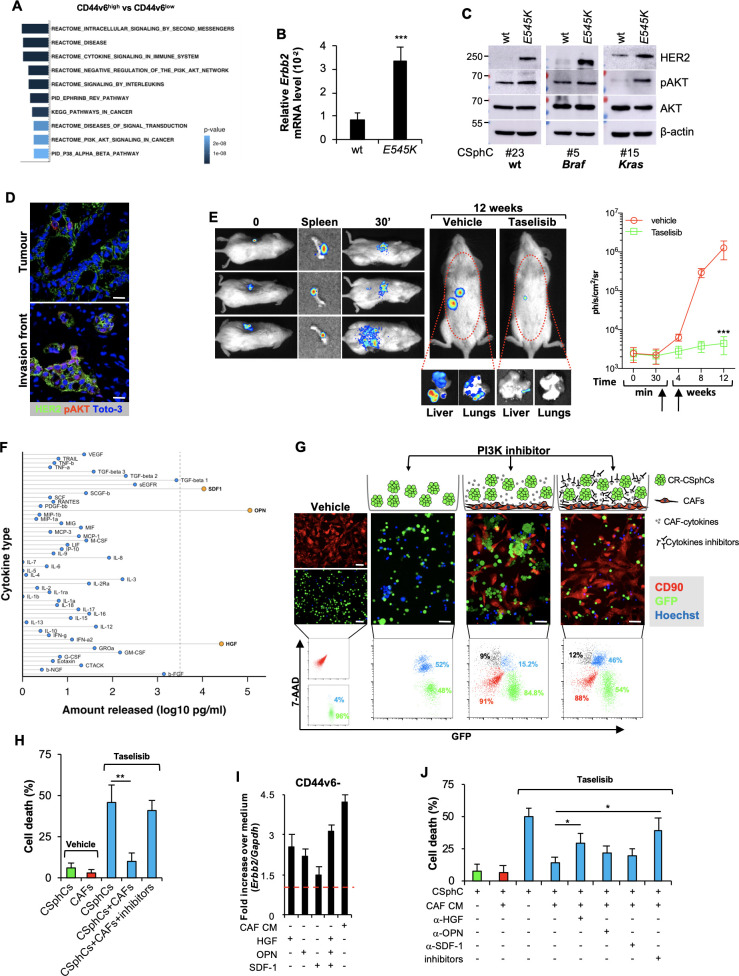
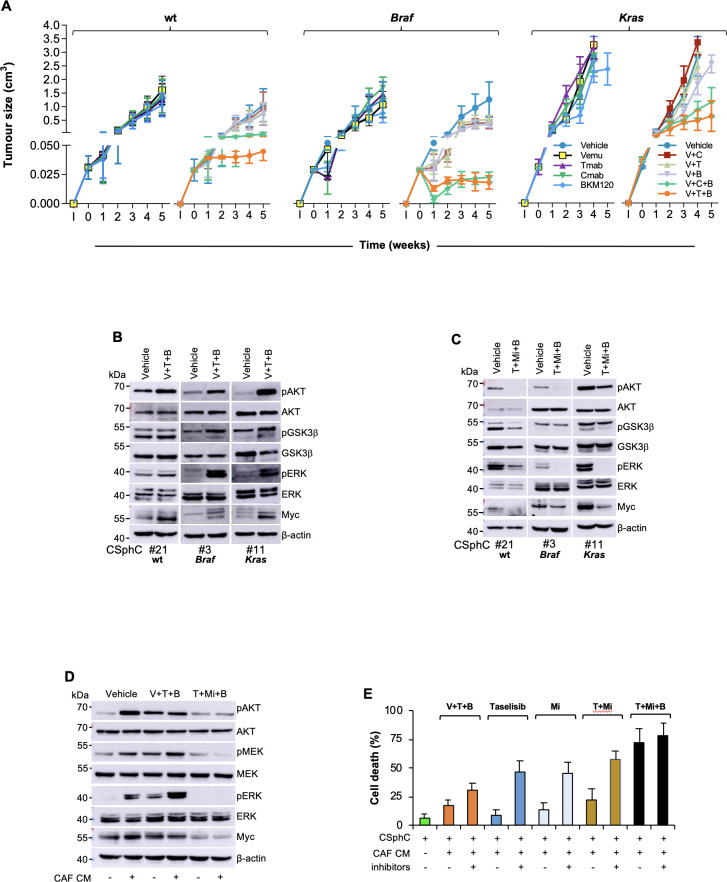
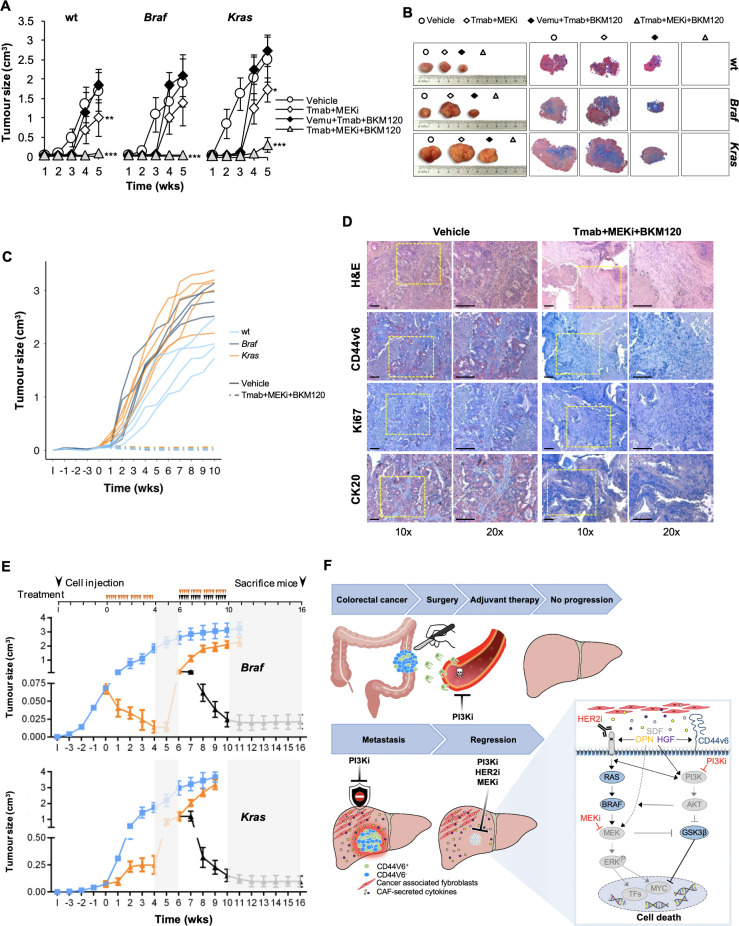
Results: Here we show that in CD44v6-positive CR-CSCs, high HER2 expression levels are associated with an activation of the phosphatidylinositol 3-kinase (PI3K)/AKT pathway, which promotes the acetylation at the regulatory elements of the Erbb2 gene. HER2 targeting in combination with phosphatidylinositol 3-kinase (PI3K) and mitogen-activated protein kinase kinase (MEK) inhibitors induces CR-CSC death and regression of tumour xenografts, including those carrying Kras and Pik3ca mutation. Requirement for the triple targeting is due to the presence of cancer-associated fibroblasts, which release cytokines able to confer CR-CSC resistance to PI3K/AKT inhibitors. In contrast, targeting of PI3K/AKT as monotherapy is sufficient to kill liver-disseminating CR-CSCs in a model of adjuvant therapy.

Conclusions: While PI3K targeting kills liver-colonising CR-CSCs, the concomitant inhibition of PI3K, HER2 and MEK is required to induce regression of tumours resistant to anti-EGFR therapies. These data may provide a rationale for designing clinical trials in the adjuvant and metastatic setting.

Keywords: antibody targeted therapy; colorectal cancer; drug resistance; stem cells.


Conflict of interest statement

Competing interests: None declared.

Figures

Figure 1
Figure 1
High expression of HER2 confers resistance to anti-epidermal growth factor receptor (EGFR) treatment in CD44v6-positive CR-CSCs.(A) Waterfall plot of cetuximab response in Ras/Braf-wt, Braf-mutant and Kras-mutant CSphC lines following 72 hours of treatment. (B) Top four significantly enriched gene sets in hallmark, canonical pathways MSigDB collections (false discovery rate (FDR) Q-value≤0.05) identified through the analysis of differentially expressed genes between cetuximab resistant versus sensitive Ras/Braf-wt sphere cells. P values related to each enriched gene set are indicated. (C) Erbb2 and Erbb3 mRNA expression levels in Ras/Braf-wt sphere cells resistant and sensitive to cetuximab. Gapdh amplification was used as endogenous control. Data are represented as ±SD of three experiments performed with 31 Ras/Braf-wt. (D) CD44v6 expression performed in cells as in (C). (E) Viable cell number variation in enriched CD44v6 and CD44v6-positive Ras/Braf-wt treated with cetuximab for 72 hours and normalised with the values of cells treated with vehicle (indicated as 100%, red dotted line). Boxes and whiskers represent mean±SD of six experiments performed with 15 resistant and 16 sensitive Ras/Braf-wt sphere cells. (F) Variation of Egfr, Erbb2 and Erbb3 mRNA expression levels in CD44v6-positive versus CD44v6 cells. Gapdh amplification was used as endogenous control. Data are represented as mean±SD of nine experiments performed with three Ras/Braf-wt (CSphC#14, 21 and 33), three Braf-mutants (CSphC#1, 2 and 5) and three Kras-mutants (CSphC#10, 11 and 16). (G) Immunoblot analysis of HER3, HER2 and EGFR on purified CD44v6 and CD44v6-positive Ras/Braf-wt (CSphC#21), Braf-mutant (CSphC#2) and Kras-mutant (CSphC#11) CR-CSphC populations. β-Actin was used as loading control. (H, left panel) Representative immunofluorescence analysis of CD44v6 and HER2 on paraffin embedded sections from human CRC tissue specimen. Nuclei were counterstained with TOTO-3. Scale bars, 20 µm. Percentages of CD44v6, HER2 and CD44v6/HER2 positivity in eight human CRC tissues are shown on the right panel. Data are mean±SD of eight different samples. (I) Browser view of the Erbb2 locus, showing different isoforms of Erbb2 and chromatin states (ChromHMM tracks). Two promoters and three potential enhancers are highlighted (Prom1, Prom2, ENH1, ENH2 and HGE). (J) ChIP-qPCR for the histone marks H3K27ac and H3K4me1 at the indicated enhancer regions (ENH1, ENH2 and HGE) in Braf-mutant cells positive or negative for CD44v6. Enrichment is indicated as % relative to the input. CR-CSC, colorectal cancer stem cell; CSphC, colorectal cancer sphere cell; ENH1, intron 1 enhancer; ENH2, intron 2 enhancer; HER2, human epidermal growth factor receptor 2; HGE, HER2 gene body enhancer; MSigDB, Molecular Signatures Database; wt, wild type. *indicates P<0.05 and ***indicates P<0.001.
Figure 2
Figure 2
Activation of PI3K/AKT pathway is accompanied by elevated Erbb2 expression levels in CD44v6-positive CRC cells. (A) Top 10 significantly enriched gene sets in hallmark, canonical pathways MSigDB collections (FDR Q-value≤0.05) computed by the analysis of differentially expressed genes between CD44v6high and CD44v6low cells. (B) mRNA relative levels of Erbb2 in CSphCs and their corresponding CRISPR/Cas9-Pik3ca E545K cells. Data are represented as mean±SD of six independent experiments performed with Ras/Braf-wt (CSphC#23), Braf-mutant (CSphC#5) and Kras-mutant (CSphC#15) cells and their corresponding CRISPR/Cas9-Pik3ca E545K cells. (C) Immunoblot analysis of HER2, pAKT and AKT on Ras/Braf-wt (CSphC#23), Braf-mutant (CSphC#5) Kras-mutant (CSphC#15) cells. β-Actin was used as loading control. (D) Representative immunofluorescence analysis of HER2 and pAKT on paraffin-embedded sections from six human CRC tissue specimens. Nuclei were counterstained with TOTO-3. Scale bars, 20 µm. (E, left panels) In vivo whole-body imaging analysis of mice at 0 and 30 min and 12 weeks injected with sphere cells into the spleen. Five days after cell injection, mice were treated daily with taselisib for 3 weeks. Signal within the red dotted area represents the bioluminescence quantification. Kinetics of metastasis formation at the indicated time points (right panels). Black arrows indicate the start and end of treatment (from day 6 to week 4). Data are mean±SD of four independent experiments of six mice per group using Kras-mutant (CSphC#8 and 11) sphere cell lines. (F) Lollipop plot representing the amount of cytokines released by immortalised CAFs. Data are mean of six independent experiments using cells purified from six different patients. (G) Cell death (blue colour) evaluated by immunofluorescence (upper panels) and flow cytometry (lower panels) in sphere cells (CSphC#8) transduced with GFP (green colour) cocultured with CAFs CD90 positive (red colour) and treated with a PI3K inhibitor (taselisib) for 72 hours in the presence or absence of hepatocyte growth factor (HGF), stromal cell-derived factor-1 (SDF-1) and osteopontin (OPN) blocking antibodies (inhibitors). Scale bars, 40 µm. (H) Percentage of cell death in cells as in (G). Data are mean±SD of three independent experiments using Ras/Braf-wt (CSphC#14, 21 and 33), Braf-mutant (CSphC#1, 2 and 5) and Kras-mutant (CSphC#8, 10 and 11) sphere cell lines. (I) Erbb2 mRNA expression levels in CD44v6 enriched cells treated with CAF CM and the indicated cytokines. Data are mean±SD of three independent experiments performed with cells derived from Ras/Braf-wt (CSphC#14 and 33), Braf-mutant (CSphC#1 and 5) and Kras-mutant (CSphC#10 and 11) sphere cell lines. (J) Cell death in sphere cells exposed to CAF CM and treated with taselisib for 72 hours in the presence of cytokine neutralising antibodies as indicated. Data are mean±SD of three independent experiments performed with Ras/Braf-wt (CSphC#6, 14, 21 and 33), Braf-mutant (CSphC#1, 2, 4 and 5) and Kras-mutant (CSphC#8, 10, 11 and 17) sphere cell lines. CAF, cancer-associated fibroblast; CM, conditioned medium; CRC, colorectal cancer; CSphC, colorectal cancer sphere cell; HER2, human epidermal growth factor receptor 2; MSigDB, Molecular Signatures Database; wt, wild type. *indicates P<0.05, ** indicates P<0.01 and ***indicates P<0.001.
Figure 3
Figure 3
HER2/MEK/PI3K combinatorial targeting counteracts the protective effect of cytokines produced by CAF. (A) Size of xenograft tumours generated by subcutaneous injection of Ras/Braf-wt (CSphC#14, 21 and 33), Braf-mutant (CSphC#1, 2, 3 and 5) or Kras-mutant (CSphC#8, 11 and 16) sphere cells. Mice were treated for the first 4 weeks with vehicle (vehicle) or Vemu (or V), cetuximab (Cmab or C), Tmab (or T) and a PI3K inhibitor (B) alone or in combination as indicated. ‘I’ indicates the time of cell injection. Treatment was started at time 0. Data are mean values of six independent experiments (n=6 mice per group). (B) Immunoblot analysis of pAKT, AKT, pGSK3β, GSK3β, pERK, ERK and Myc on tumour xenograft-derived cells of mice injected with RasBraf/Braf-wt (CSphC#21), Braf-mutant (CSphC#3), Kras-mutant (CSphC#11) sphere cells. Mice were treated with vehicle or V in combination with T and B, and sacrificed 1 week after the treatment suspension (5 weeks). β-Actin was used as loading control. (C) Representative Western blot analysis of pAKT, AKT, pGSK3β, GSK3β, pERK, ERK and Myc in Ras/Braf-wt (CSphC#21), Braf-mutant (CSphC#3), Kras-mutant (CSphC#11) sphere cells treated for 24 hours with vehicle or T+Mi+B. β-Actin was used as loading control. (D) Immunoblot analysis of the indicated proteins in Kras-mutant (CSphC#9) sphere cells treated with vehicle or V in combination with T and B or T+Mi+B cultured in fetal bovine serum (FBS)-free Dulbecco’s modified eagle medium (DMEM) or CAF CM for 24 hours. (E) Cell death percentage in CSphCs exposed to hepatocyte growth factor (HGF), stromal cell-derived factor-1 (SDF-1) and osteopontin (OPN) blocking antibodies (inhibitors) and treated as indicated for 72 hours. Data are mean±SD of three independent experiments performed with Ras/Braf-wt (CSphC#14, 21 and 33), Braf-mutant (CSphC#1, 2 and 5) and Kras-mutant (CSphC#8, 10 and 11) sphere cell lines. B, BKM120; CAF, cancer-associated fibroblast; CSphC, colorectal cancer sphere cell; T, trastuzumab; T+Mi+B, trastuzumab in combination with MEKi and BKM120; V, vemurafenib; V+T+B, vemurafenib in combination with trastuzumab and BKM120; wt, wild type; CM, conditioned medium.
Figure 4
Figure 4
Therapeutic potential of HER2, PI3K and MEK targeting in CRC. (A) Size of tumours generated by subcutaneous injection of surviving Ras/Braf-wt (CSphC#14, 21 and 33), Braf-mutant (CSphC#1, 2 and 5) and Kras-mutant (CSphC#8, 11 and 16) sphere cells after 5 days of in vitro combination treatment as indicated. Data reported are mean±SD of tumour size for each cell lines (n=6 mice per group). (B) Representative macroscopic and Azan-Mallory analysis on tumour xenografts at 5 weeks treated as in (A). (C) Individual subcutaneous tumour volume plots of mice generated by the injection of four CSphC lines bearing the indicated different mutational background and treated for 4 weeks (0–4 weeks) with vehicle (vehicle) or Tmab plus MEKi plus BKM120. ‘I’ indicates the time of cell injection. Treatment was started at time 0. Data show kinetic growth of xenograft tumours generated by the injection of Ras/Braf-wt (CSphC#14, 21, 33 and 56), Braf-mutant (CSphC#1, 2, 3 and 5) and Kras-mutant (CSphC#8, 9, 11 and 16) CSphCs. (D) Representative H&E and immunohistochemical analysis of CD44v6, Ki67 and CK20 on tumour xenografts generated by the injection of Kras-mutant (CSphC#11) sphere cells treated as in (C) at the time of sacrifice (10 weeks). Scale bars, 200 µm. (E) Tumour size of mice xenografted with Braf-mutant (CSphC#1–5) and Kras-mutant (CSphC#8, 9, 11, 13 and 16) mutant sphere cells. Mice were treated with vehicle (vehicle, blue lines) or sequential treatments. A combination of Vemu, Tmab, BKM120 (Vemu+Tmab+BKM120, orange line) was used as first line (0–4 weeks, orange arrowheads) and after 2 weeks off-treatments, Tmab in combination with MEKi and BKM120 (Tmab+MEKi+BKM120, black lines and arrowheads) or the same Vemu combination used in the first 4 weeks (orange arrowheads) was administered from weeks 6 to 10. Off-treatments are highlighted with grey regions. ‘I’ indicates the time of cell injection. Data are expressed as mean±SD of subcutaneously implanted CSphC lines for each mutational status (n=6 mice per group). (F) Scheme of the signalling axis illustrating the site of action of the triple combination therapy. Surgery is the main treatment for primary CRC followed by adjuvant therapy. PI3Ki has shown efficacy in targeting disseminating CRC cells, impeding tumour progression (upper panel). However, PI3Ki as single agents are unable to counteract the TME protective influence in metastatic lesions. Triple combination treatment (PI3Ki, HER2i and MEKi) induces tumour regression by overcoming CAF-secreted cytokine effect (lower left panel). In CD44v6-positive CR-CSCs characterised by high PI3K pathway activity, TME-derived cytokines upregulate HER2 and CD44v6 expression levels, activate mitogen-activated protein kinase (MAPK) pathway and increase Myc protein levels, jeopardising the potential therapeutic efficacy of PI3Ki. The additional targeting of HER2 and the Myc upstream kinase MEK achieves a synthetic lethal effect in CR-CSCs (lower right panel). HER2, BRAF, PI3K and MEK inhibitors are indicated as I. CAF, cancer-associated fibroblast; CRC, colorectal cancer; CR-CSC, colorectal cancer cancer stem cell; CSphC, colorectal cancer sphere cell; HER2, human epidermal growth factor receptor 2; MEKi, trametinib; PI3Ki, PI3K inhibitors; TF, transcriptional factor; Tmab, trastuzumab; TME, tumour microenvironment; Vemu, vemurafenib; wt, wild type. *indicates P<0.05, ** indicates P<0.01 and ***indicates P<0.001.

Comment in

Similar articles

Cited by

References

    1. Siegel RL, Miller KD, Jemal A. Cancer statistics, 2019. CA: A Cancer Journal for Clinicians 2019;69:7–34. 10.3322/caac.21551 - DOI - PubMed
    1. Dagogo-Jack I, Shaw AT. Tumour heterogeneity and resistance to cancer therapies. Nat Rev Clin Oncol 2018;15:81–94. 10.1038/nrclinonc.2017.166 - DOI - PubMed
    1. Russo M, Siravegna G, Blaszkowsky LS, et al. . Tumor heterogeneity and lesion-specific response to targeted therapy in colorectal cancer. Cancer Discov 2016;6:147–53. 10.1158/2159-8290.CD-15-1283 - DOI - PMC - PubMed
    1. Dienstmann R, Mason MJ, Sinicrope FA, et al. . Prediction of overall survival in stage II and III colon cancer beyond TNM system: a retrospective, pooled biomarker study. Ann Oncol 2017;28:1023–31. 10.1093/annonc/mdx052 - DOI - PMC - PubMed
    1. Van Cutsem E, Cervantes A, Adam R, et al. . ESMO consensus guidelines for the management of patients with metastatic colorectal cancer. Annals of Oncology 2016;27:1386–422. 10.1093/annonc/mdw235 - DOI - PubMed

Publication types

MeSH terms