Drug perturbation gene set enrichment analysis (dpGSEA): a new transcriptomic drug screening approach
- PMID: 33435872
- PMCID: PMC7805197
- DOI: 10.1186/s12859-020-03929-0
Drug perturbation gene set enrichment analysis (dpGSEA): a new transcriptomic drug screening approach
Abstract
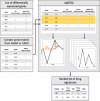
Background: In this study, we demonstrate that our modified Gene Set Enrichment Analysis (GSEA) method, drug perturbation GSEA (dpGSEA), can detect phenotypically relevant drug targets through a unique transcriptomic enrichment that emphasizes biological directionality of drug-derived gene sets.
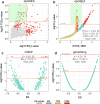
Results: We detail our dpGSEA method and show its effectiveness in detecting specific perturbation of drugs in independent public datasets by confirming fluvastatin, paclitaxel, and rosiglitazone perturbation in gastroenteropancreatic neuroendocrine tumor cells. In drug discovery experiments, we found that dpGSEA was able to detect phenotypically relevant drug targets in previously published differentially expressed genes of CD4+T regulatory cells from immune responders and non-responders to antiviral therapy in HIV-infected individuals, such as those involved with virion replication, cell cycle dysfunction, and mitochondrial dysfunction. dpGSEA is publicly available at https://github.com/sxf296/drug_targeting .
Conclusions: dpGSEA is an approach that uniquely enriches on drug-defined gene sets while considering directionality of gene modulation. We recommend dpGSEA as an exploratory tool to screen for possible drug targeting molecules.
Keywords: Drug discovery; Gene set enrichment analysis; Transcriptomics.
Conflict of interest statement
The authors declare that they have no competing interests.
Figures


Similar articles
-
BubbleGUM: automatic extraction of phenotype molecular signatures and comprehensive visualization of multiple Gene Set Enrichment Analyses.BMC Genomics. 2015 Oct 19;16:814. doi: 10.1186/s12864-015-2012-4. BMC Genomics. 2015. PMID: 26481321 Free PMC article.
-
Differential Gene Set Enrichment Analysis: a statistical approach to quantify the relative enrichment of two gene sets.Bioinformatics. 2021 Jan 29;36(21):5247-5254. doi: 10.1093/bioinformatics/btaa658. Bioinformatics. 2021. PMID: 32692836 Free PMC article.
-
GSEA-InContext: identifying novel and common patterns in expression experiments.Bioinformatics. 2018 Jul 1;34(13):i555-i564. doi: 10.1093/bioinformatics/bty271. Bioinformatics. 2018. PMID: 29950010 Free PMC article.
-
XGSEA: CROSS-species gene set enrichment analysis via domain adaptation.Brief Bioinform. 2021 Sep 2;22(5):bbaa406. doi: 10.1093/bib/bbaa406. Brief Bioinform. 2021. PMID: 33515011
-
Translational Metabolomics of Head Injury: Exploring Dysfunctional Cerebral Metabolism with Ex Vivo NMR Spectroscopy-Based Metabolite Quantification.In: Kobeissy FH, editor. Brain Neurotrauma: Molecular, Neuropsychological, and Rehabilitation Aspects. Boca Raton (FL): CRC Press/Taylor & Francis; 2015. Chapter 25. In: Kobeissy FH, editor. Brain Neurotrauma: Molecular, Neuropsychological, and Rehabilitation Aspects. Boca Raton (FL): CRC Press/Taylor & Francis; 2015. Chapter 25. PMID: 26269925 Free Books & Documents. Review.
Cited by
-
Drug mechanism enrichment analysis improves prioritization of therapeutics for repurposing.BMC Bioinformatics. 2023 May 24;24(1):215. doi: 10.1186/s12859-023-05343-8. BMC Bioinformatics. 2023. PMID: 37226094 Free PMC article.
-
Navigating the Gene Co-Expression Network and Drug Repurposing Opportunities for Brain Disorders Associated with Neurocognitive Impairment.Brain Sci. 2023 Nov 7;13(11):1564. doi: 10.3390/brainsci13111564. Brain Sci. 2023. PMID: 38002524 Free PMC article.
-
Screening Potential Drugs for the Development of NAFLD Based on Drug Perturbation Gene Set.Comput Math Methods Med. 2022 Apr 16;2022:7606716. doi: 10.1155/2022/7606716. eCollection 2022. Comput Math Methods Med. 2022. PMID: 35469222 Free PMC article.
-
An Innovative Drug Repurposing Approach to Restrain Endometrial Cancer Metastatization.Cells. 2023 Mar 3;12(5):794. doi: 10.3390/cells12050794. Cells. 2023. PMID: 36899930 Free PMC article.
References
MeSH terms
Grants and funding
LinkOut - more resources
Full Text Sources
Other Literature Sources
Research Materials

