. 2021 Jan 11;11(1):347.
doi: 10.1038/s41598-020-77911-4.

Cancer associated talin point mutations disorganise cell adhesion and migration

Affiliations

Cancer associated talin point mutations disorganise cell adhesion and migration

Latifeh Azizi et al. Sci Rep. .

Abstract

Talin-1 is a key component of the multiprotein adhesion complexes which mediate cell migration, adhesion and integrin signalling and has been linked to cancer in several studies. We analysed talin-1 mutations reported in the Catalogue of Somatic Mutations in Cancer database and developed a bioinformatics pipeline to predict the severity of each mutation. These predictions were then assessed using biochemistry and cell biology experiments. With this approach we were able to identify several talin-1 mutations affecting integrin activity, actin recruitment and Deleted in Liver Cancer 1 localization. We explored potential changes in talin-1 signalling responses by assessing impact on migration, invasion and proliferation. Altogether, this study describes a pipeline approach of experiments for crude characterization of talin-1 mutants in order to evaluate their functional effects and potential pathogenicity. Our findings suggest that cancer related point mutations in talin-1 can affect cell behaviour and so may contribute to cancer progression.


Conflict of interest statement

The authors declare no competing interests.

Figures

Figure 1
Figure 1
Analysis of talin-1 mutations found in the COSMIC database. (a) Schematic representation of focal adhesion role on cell function. (b) Schematic representation of talin-1 and the positions of the selected missense mutations. Bottom: cartoon of the talin head complexes that form with integrin, FAK, paxillin and RIAM (left), talin R7–R8 complexes with KANK, DLC-1, RIAM and paxillin (middle) and the R13–DD actin cytoskeletal linkage (right). (c) Flowchart showing the study pipeline to investigate TLN–1 mutations from COSMIC database.
Figure 2
Figure 2
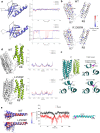
MD simulation analysis of the effects of cancer–associated mutations on talin domains. (a) Structure snapshots of the F3 subdomain for WT and I392N mutant. Residue 392 and a water molecule inside the F3 domain in the I392N mutant simulation are shown. The plots show the distance between the residue 392 side chain and the closest water molecule as function of the MD simulation time in WT (top) and I392N mutant (bottom). Three 100 ns replicas are shown. The distance of ~ 0.6 nm in the WT indicates that the closest water molecule is located at the F3 surface, while in the I392N mutant the distance ~ 0.2 nm indicates that the nearest water molecule has penetrated the F3 fold. (b) R7–R8 inter-domain binding energy distribution for WT and R1368W predicted using MM-PBSA. Residue R1368W and others that have contribution to the inter–domain binding energy lower than –50 kJ/mol and higher than 50 kJ/mol are shown as sticks. (c) Visualisation of Y1389C mutation in R7–R8 structure. (d) R7–R8 structure snapshots captured at 100 ns of MD for WT and L1539P (in R8); the R7–R8 was used in the simulations, but the Root Mean Square Fluctuation (RMSF) analysis was performed for R8 only. Proline breaks the secondary structure and increases the flexibility of the domain, reflected in the RMSF. R7 is shown in grey and R8 in green. (e) MD simulations for DD helix showing increased flexibility of the helix caused by L2509P compared to the WT. Superposition was performed using C-alpha atoms of residues 2510 to 2529. The angle (γ) in L2509P mutant and WT in a single helix measured as a function of time.
Figure 3
Figure 3
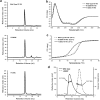
Influence of point mutations on biophysical properties of talin. (a) Full SEC profile of R7–R8 WT, R7–R8 R1368W and R7–R8 Y1389C showing the monomeric state. (b,c) CD analysis of R7–R8 WT, R7–R8 R1368W and R7–R8 Y1389C. (b) CD spectra of each mutant. (c) Melting temperature curves; the melting temperature of each protein is shown. (d) SEC–MALS analysis of R13–DD WT and R13–DD L2509P showing that the R13–DD L2509P is monomeric. The molecular weight obtained from MALS is shown for each peak.
Figure 4
Figure 4
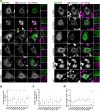
Talin mutations influence the colocalization with vinculin, paxillin and pFAK. (a) SUM projections of z–stacks of TLN1–/–TLN2–/– mouse kidney fibroblast cells expressing GFP–tagged talin-1 forms and immunolabeled for vinculin. Scale bars are 25 µm, zoom–in square size is 12.5 µm × 12.5 µm. (b,c) Analysis of vinculin (b) and paxillin (d) colocalisation with talin in adhesions; n ~ 20 cells per mutation from two separate experiments. (d) FAKpTyr397 expression levels quantified from four western blots. The statistical significance in (b,c) was analysed by one-way ANOVA and Bonferroni test: *P < 0.05, **P < 0.01, ***P < 0.001. The statistical analysis in (d) was calculated by unpaired t–test.
Figure 5
Figure 5
The point mutation L2509P has the same effect on cell morphology as the deletion of the whole dimerisation domain. (a) Cartoon of the R13–DD bound to actin (top) and schematic representations of the point mutation L2509P in full-length talin and the truncations; ΔDD and ΔR13-DD. (b) SUM projections of z–stacks of TLN1–/–TLN2–/– mouse kidney fibroblast cells expressing WT, L2509P, ∆DD, ∆R13–DD talin and immunolabeled against vinculin. No clear localisation of vinculin was evident with any of the mutants. Scale bars are 25 µm.
Figure 6
Figure 6
Mutations alter the interaction and colocalisation of talin with vinculin, DLC-1 and activated β1–integrin. (ac) Vinculin Vd1 binding analysed by size exclusion chromatography for R7–R8 WT (a), R7–R8 R1368W (b) and R7–R8 Y1389C (c) purified as recombinant proteins in E. coli. The SDS-PAGE gel of the elution fractions is shown. (d) Fluorescence Polarisation (FP) assay for purified R7–R8 WT/mutant binding to KANK (top) and RIAM (bottom) peptides. R7–R8 R1368W and R7–R8 Y1389C showed no significant changes in the interaction with KANK and RIAM compared with R7–R8 WT. Fluorescence polarisation assays were performed using protein serially diluted from a starting concentration of 60 µM with target KANK1 (30–68) peptide at 1 µM and 75 µM with target RIAM (4–30) peptide concentration at 1 µM. Measurements were taken using a CLARIOstar plate reader (BMGLabTech) at 20 °C. GraphPad Prism 7 software was used for data analysis with one-site total binding equation used to generate a Kd. (e) Representative confocal immunofluorescence images of the co-localisation of DLC-1 in the TLN1–/–TLN2–/– mouse kidney fibroblast cells transfected with full length talin WT and L1539P. (f) Data obtained from the colocalisation of tubulin in adhesion sites. (g) Representative confocal immunofluorescence images of the co-localisation of activated integrin CD29 organisation in the cells transfected with full length talin WT and I392N. SUM projections of z-stacks of cells expressing GFP-tagged talin-1 (WT and/or point mutated) and immunolabeled against integrin CD29 or DLC-1, and ~ 30 cells per label have been analysed. The statistical significance of all results was analysed by one-way ANOVA and Bonferroni test: *P < 0.05, **P < 0.01, ***P < 0.001. Scale bars are 25 µm, zoom-in square size is 12.5 µm × 12.5 µm.
Figure 7
Figure 7
Talin mutations affect cell migration and proliferation. (a) Random migration speed (µm/min) determined from time-lapse images of talin expressing cells. (b) Migration speed on 2D surface showing reduced migration speed in all mutated/truncated constructs in comparison to WT. (c) Migration assay on 2D surface showing reduced migration speed in cells co-transfected with talin-1 L2509P and full-length WT talin-2. The statistical significance of all results analysed in comparison to talin-1 WT + talin-2 WT by one-way ANOVA and Bonferroni test: *P < 0.05, **P < 0.01, ***P < 0.001. The results are normalised with talin-1 WT. (d) Invasion assay through Matrigel matrix towards 10% FBS containing medium. Control cells were mock-transfected with GFP-expressing plasmid. The values are normalised to WT and statistical significance measured in comparison to WT. Data are mean + /–SEM. The statistical significance was analysed by one-way ANOVA and Bonferroni test: *P < 0.05, **P < 0.01, ***P < 0.001. (e) Cell invasion through Matrigel in 3D environment showing the invasiveness potential of the L2509P and truncated talin constructs. Invasion assay was repeated at least three times in triplicate chamber for each construct on separate days. (f) Cell proliferation analysis in the presence of 10% FBS and 0.2% FBS, showing the number of times the cells divide in 12 h; n ~ 80 cells per mutation from four separate experiments. The statistical analysis was calculated by t-test, non-parametric test of Mann–Whitney: *P < 0.05, **P < 0.01, ***P < 0.001 compared to WT for each condition.

Similar articles

Cited by

References

    1. Lu P, Weaver VM, Werb Z. The extracellular matrix: A dynamic niche in cancer progression. J. Cell. Biol. 2012;196:395–406. doi: 10.1083/jcb.201102147. - DOI - PMC - PubMed
    1. Goult BT, et al. Structural studies on full-length talin1 reveal a compact auto-inhibited dimer: Implications for talin activation. J. Struct. Biol. 2013;184:21–32. doi: 10.1016/j.jsb.2013.05.014. - DOI - PMC - PubMed
    1. Anthis NJ, et al. The structure of an integrin/talin complex reveals the basis of inside-out signal transduction. EMBO J. 2009;28:3623–3632. doi: 10.1038/emboj.2009.287. - DOI - PMC - PubMed
    1. Tanentzapf G, Brown NH. An interaction between integrin and the talin FERM domain mediates integrin activation but not linkage to the cytoskeleton. Nat. Cell Biol. 2006;8:601–606. doi: 10.1038/ncb1411. - DOI - PubMed
    1. Hemmings L, et al. Talin contains three actin-binding sites each of which is adjacent to a vinculin-binding site. J. Cell. Sci. 1996;109(Pt 11):2715–2726. - PubMed

Publication types