. 2021 Jan 7;14(1):9.
doi: 10.1186/s13045-020-01028-4.

Hepatic NOD2 promotes hepatocarcinogenesis via a RIP2-mediated proinflammatory response and a novel nuclear autophagy-mediated DNA damage mechanism

Affiliations

Hepatic NOD2 promotes hepatocarcinogenesis via a RIP2-mediated proinflammatory response and a novel nuclear autophagy-mediated DNA damage mechanism

Yi Zhou et al. J Hematol Oncol. .

Abstract

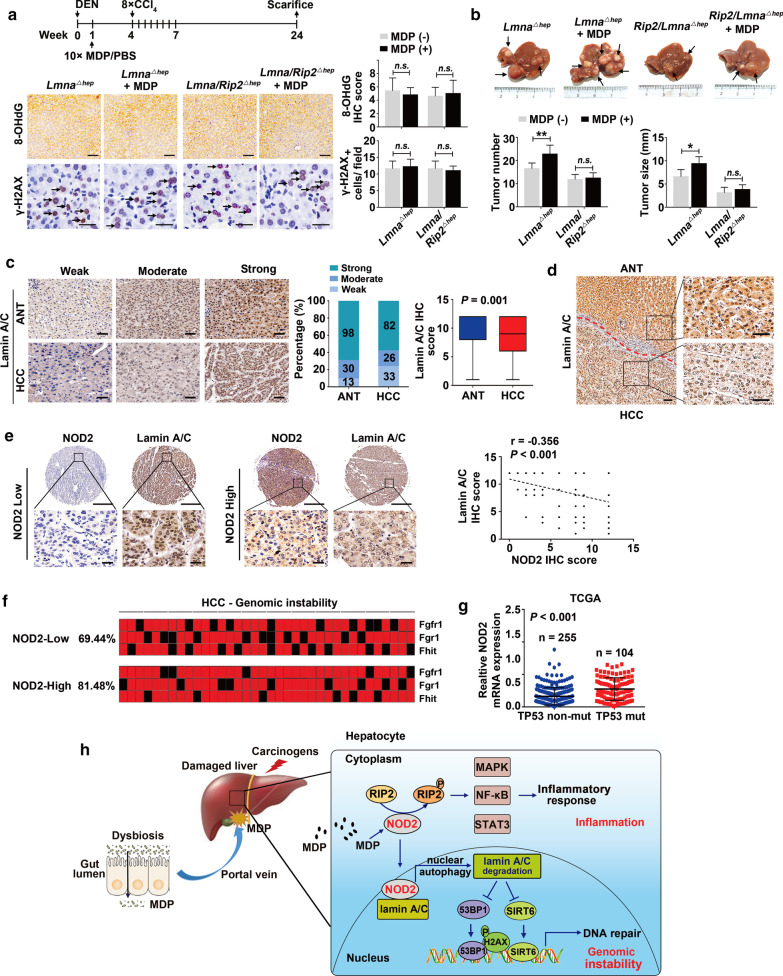
Background: Key hepatic molecules linking gut dysbiosis and hepatocarcinogenesis remain largely unknown. Gut-derived gut microbiota contains pathogen-associated molecular patterns (PAMPs) that may circulate into the liver and, consequently, be recognized by hepatic pattern recognition receptors (PRRs). NOD2, a general intracellular PRR, recognizes muramyl dipeptide (MDP), present in both gram (+) and gram (-) bacteria. Here, we investigated the role of NOD2 as a molecular sensor translating gut dysbiosis signaling into hepatocarcinogenesis.

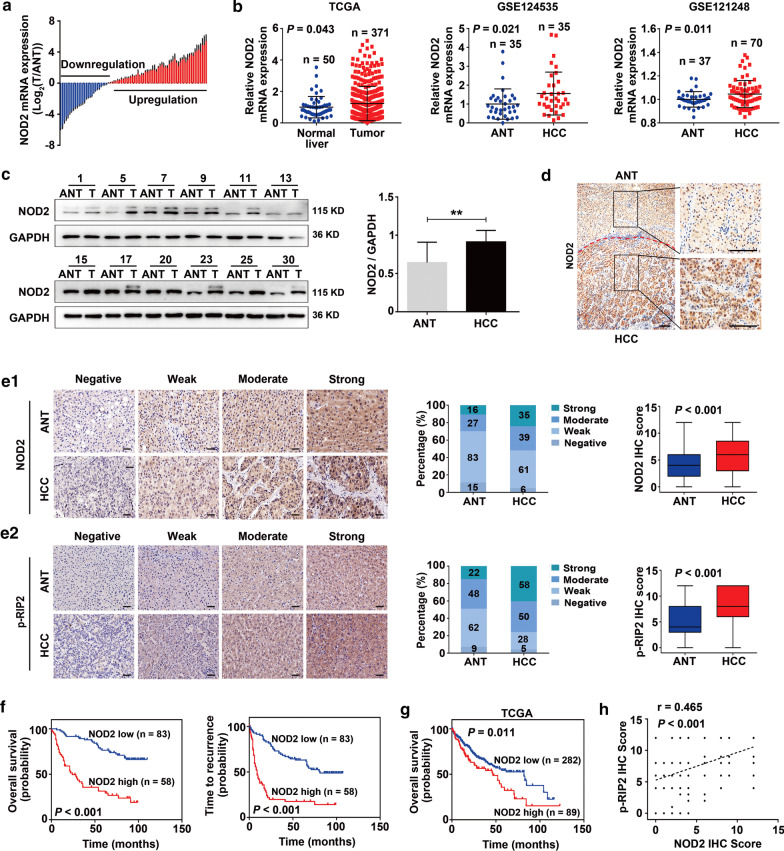
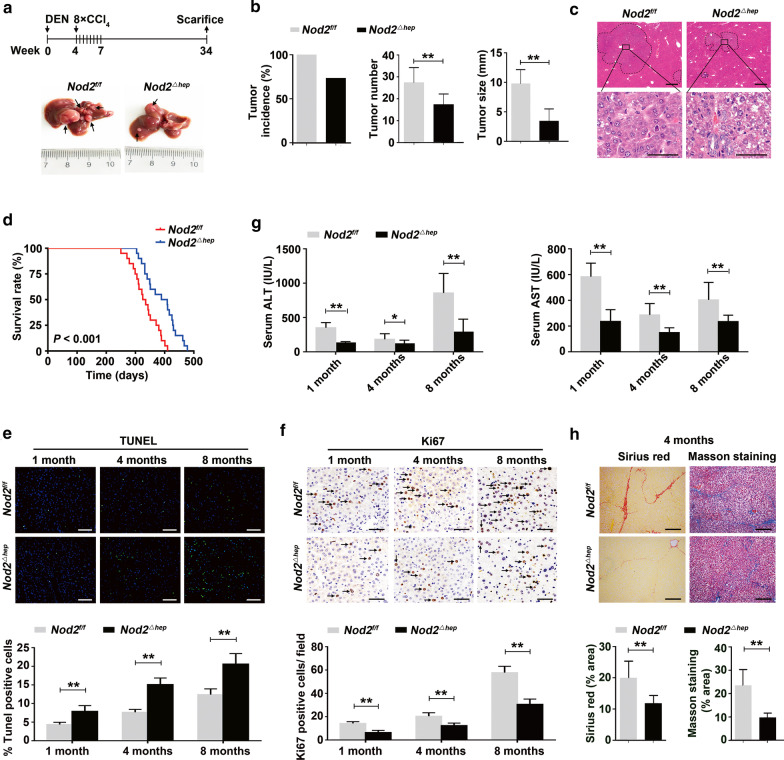
Methods: NOD2 expression was measured in clinical hepatocellular carcinoma (HCC) samples using qPCR (80 pairs), western blotting (30 pairs) and immunostaining (141 pairs). The role of NOD2 in hepatocarcinogenesis was examined in the hepatocyte-specific Nod2-knockout (Nod2△hep), Rip2-knockout (Rip2△hep), Lamin A/C-knockout (Lamn△hep) and Rip2/Lamin A/C double-knockout (Rip2/Lamn△hep) mice models of diethylnitrosamine (DEN)/CCl4-induced HCC.

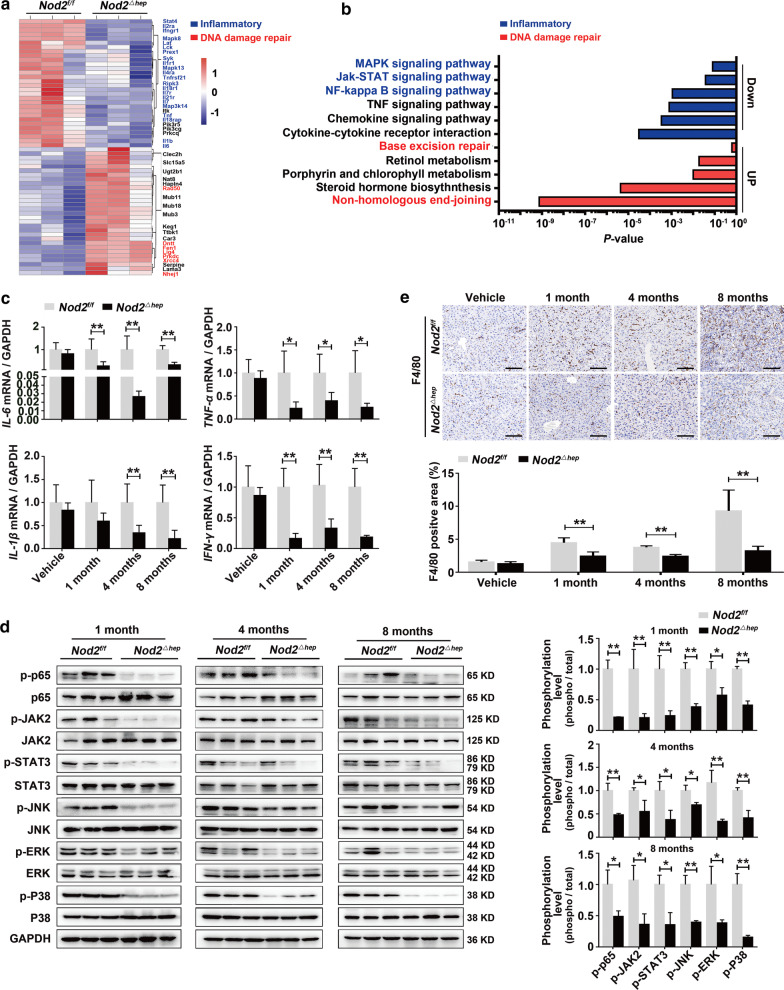
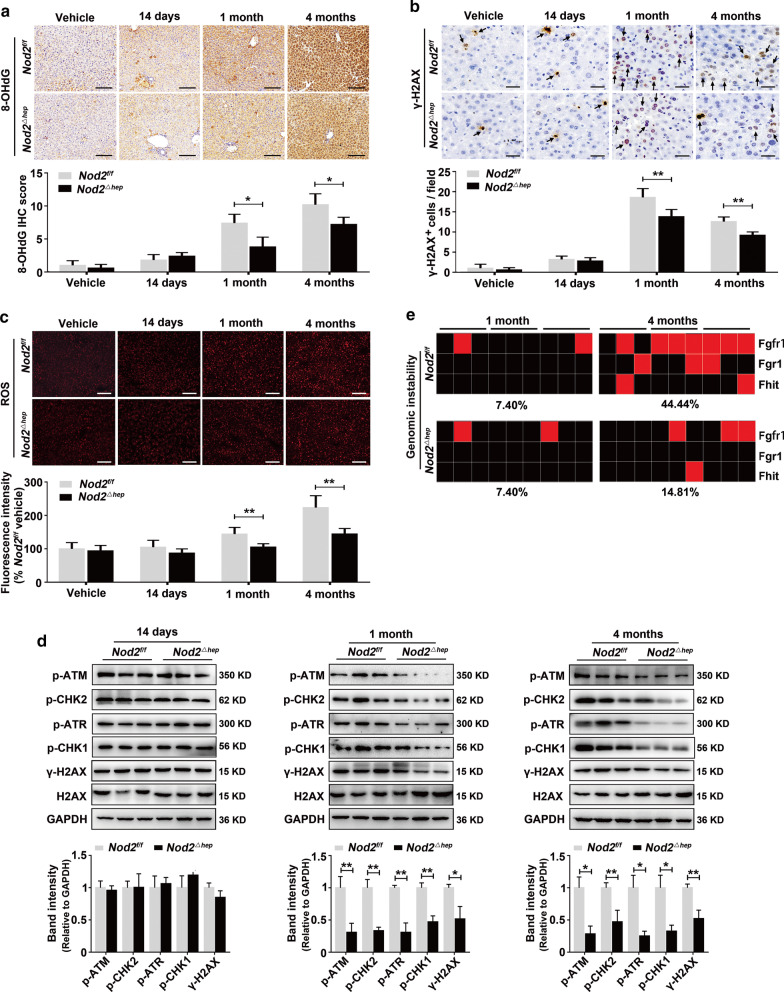
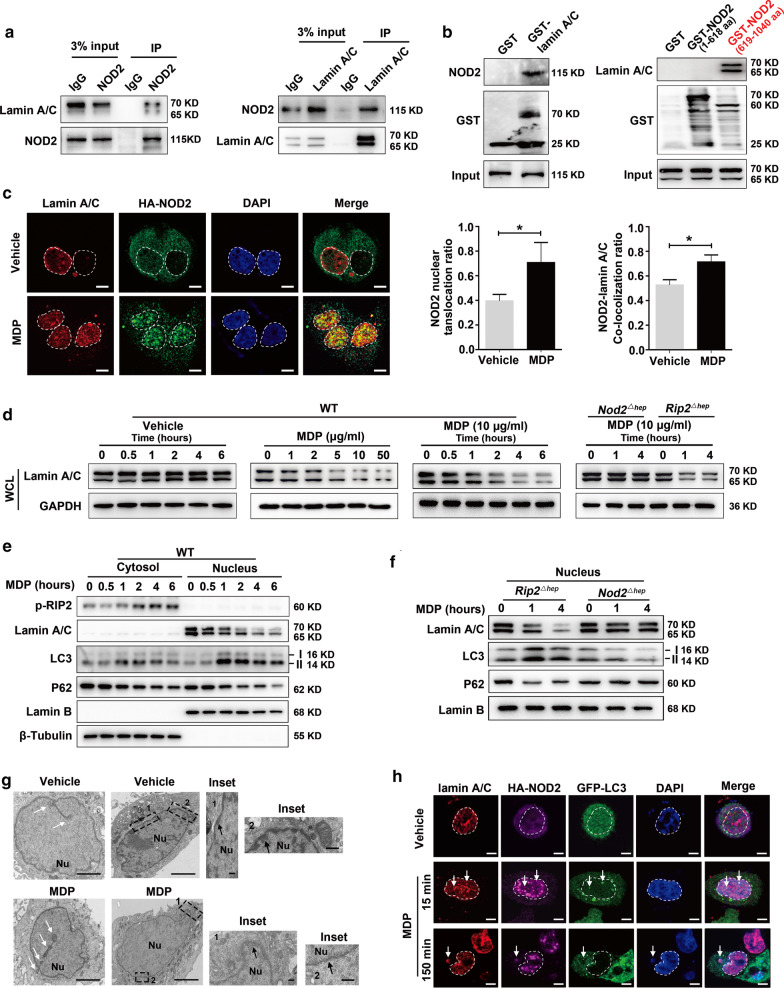
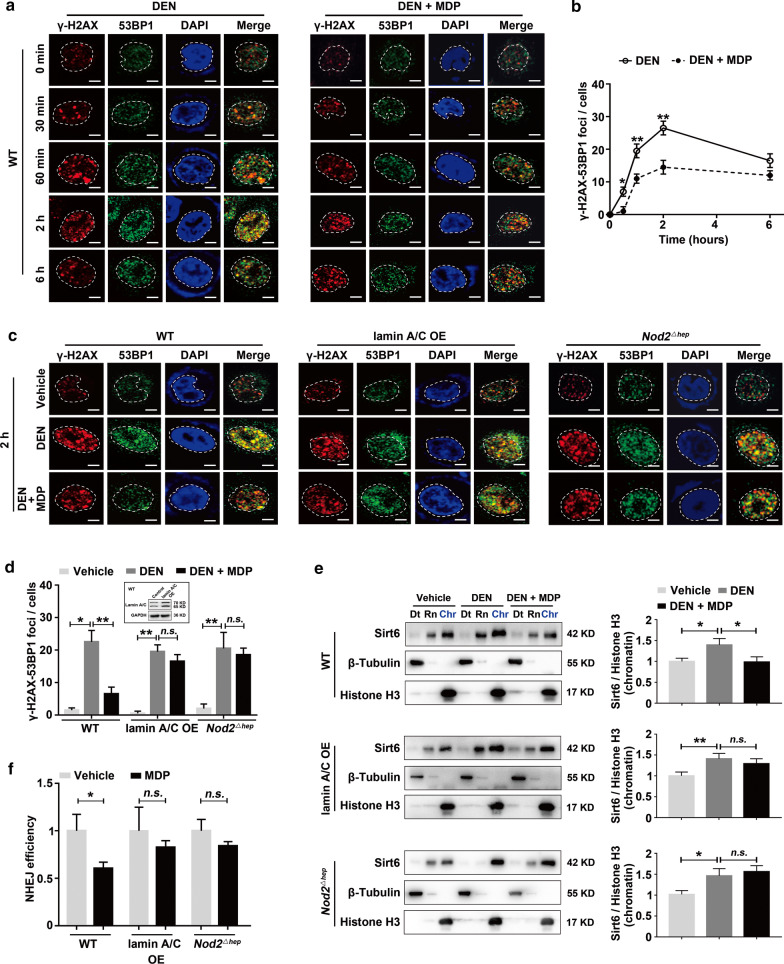
Results: NOD2 was upregulated and activated in HCC samples, and high NOD2 expression correlated with poor prognosis in HCC patients. Hepatic NOD2 deletion in vivo decreased DEN/CCl4-induced HCC by reducing the inflammatory response, DNA damage and genomic instability. NOD2 activation increased liver inflammation via RIP2-dependent activation of the MAPK, NF-κB and STAT3 pathways. Notably, a novel RIP2-independent mechanism was discovered, whereby NOD2 activation induces the nuclear autophagy pathway. We showed that NOD2 undergoes nuclear transport and directly binds to a component of nuclear laminae, lamin A/C, to promote its protein degradation, leading to impaired DNA damage repair and increased genomic instability.

Conclusions: We reveal a novel bridge, bacterial sensor NOD2, linking gut-derived microbial metabolites to hepatocarcinogenesis via induction of the inflammatory response and nuclear autophagy. Thus, we propose hepatic NOD2 as a promising therapeutic target against HCC.

Keywords: C; DNA damage; Hepatocellular carcinoma; Lamin A; NOD2; Nuclear autophagy; RIP2.


Conflict of interest statement

The authors declare no conflict of interest.

Figures

Fig. 1
Fig. 1
Increased NOD2 expression correlates with poor prognosis of HCC. a Relative NOD2 mRNA expression in 80 paired HCC (T) and adjacent non-tumor tissues (ANT) from Zhongshan Hospital HCC2 (ZHH2). b NOD2 mRNA expression in HCC cohorts from TCGA and GEO (GSE124535 and GSE121248) databases. c Representative expression pattern (left) and relative intensity (right) of NOD2 protein in 30 paired HCC and ANT tissues from ZHH2. d Representative immunohistochemistry images of NOD2 in HCC and ANT tissues. e Immunohistochemistry staining of NOD2 (e1) and p-RIP2 (e2) in 141 paired HCC and ANT tissues from ZHH1 (n = 141). f Kaplan–Meier analysis for OS and TTR according to NOD2 expression in HCC patients from ZHH1. g Kaplan–Meier analysis for OS in TCGA HCC cohorts. h Positive correlation between NOD2 scores and p-RIP2 scores in HCC samples from ZHH1, n = 141; Pearson correlation analysis. Data were shown as mean ± SD, and significance was determined using paired (c, e), and unpaired Student’s t test (b). ** P < 0.01. Scale bar, 50 μm
Fig. 2
Fig. 2
Hepatic NOD2 deficiency suppresses DEN/CCl4-induced hepatocarcinogenesis. a Effect of hepatic NOD2 deficiency on tumor growth in DEN/CCl4-induced HCC model. Male mice were injected with DEN (25 mg/kg, i.p.) at the age of 14–16 days followed by 8 injections of CCl4 (1.2 ml/kg, i.p., biweekly, starting 4 weeks after DEN injection) and killed 8 months after DEN injection. Representative gross appearance of the livers. Arrowheads indicate tumors in liver. b Quantification of tumor incidence in Nod2f/f (n = 15) and Nod2△hep (n = 15) mice (left panel). Quantification of tumor number (middle panel) and tumor size (right panel) in Nod2f/f (n = 15) and Nod2△hep (n = 11) mice. c Representative H&E staining of liver sections from Nod2f/f and Nod2△hep. Scale bar, 200 μm (top panel) or 25 μm (bottom panel). d Survival rate of mice treated with DEN/CCl4. Median survival time for Nod2f/f (n = 20) and Nod2△hep (n = 20) mice was 330 and 399 days, respectively. e–f TUNEL (e) and Ki67 staining (f) in Nod2f/f and Nod2△hep mice livers. Arrowheads indicate Ki67-positive cells, n = 5–6. Scale bar, 100 μm (top panel) or 50 μm (bottom panel). g Serum ALT and AST levels in Nod2f/f and Nod2△hep mice. n = 6. h Sirius red and Masson staining in Nod2f/f and Nod2△hep mice livers 4 months after DEN injection. n = 6. Scale bar, 100 μm. Data were shown as mean ± SD, and significance was determined using ordinary one-way ANOVA with Sidak test (e, f), and unpaired Student’s t test (b, g, h). *P < 0.05, **P < 0.01
Fig. 3
Fig. 3
Hepatic NOD2 deficiency attenuates DEN/CCl4-induced liver inflammatory responses. a, b Hierarchical clustering (a) and KEGG pathway analysis (b) of up- and downregulated genes in livers from Nod2f/f and Nod2△hep mice treated with DEN/CCl4 for 4 months. c Relative mRNA expression of IL-6, TNF-α, IL-1β and IFN-γ in livers of Nod2f/f and Nod2△hep mice treated with DEN/CCl4 for the indicated time points, n = 6. d Western blots analysis of NF-κB (p65), JAK2/STAT3 and MAPK (ERK, JNK, P38) pathways in livers of Nod2f/f and Nod2△hep mice treated with DEN/CCl4 for the indicated time points. e Representative immunohistochemistry images and quantification of F4/80 in livers of Nod2f/f and Nod2△hep mice treated with DEN/CCl4 for the indicated time points, n = 5. Scale bar, 50 μm. Data were shown as mean ± SD, and significance was determined using unpaired Student’s t test (c–e). *P < 0.05, **P < 0.01
Fig. 4
Fig. 4
Hepatic NOD2 deficiency reduces DEN/CCl4-induced DNA damage. a, b Representative immunohistochemistry staining and semi-quantitative analysis of 8-OHdG (a) and γ-H2AX (b) in liver sections of Nod2f/f and Nod2△hep mice treated with DEN/CCl4 for the indicated time points. Arrowheads indicate γ-H2AX+ cells, n = 5. c Representative immunofluorescence images and quantification of ROS in liver of Nod2f/f and Nod2△hep mice treated with DEN/CCl4 for the indicated time points, n = 5. d Western blot analysis and quantification of ATM/CHK2, ATR/CHK1 pathways and γ-H2AX+ in livers of Nod2f/f and Nod2△hep mice treated with DEN/CCl4 for the indicated time points, n = 3. e Allelic imbalances (AI) were measured using TaqMan copy number assay in livers of Nod2f/f and Nod2△hep mice treated with DEN/CCl4 for the indicated time points. Each square represents one area of microdissected liver tissue, and lines indicate different areas of the same liver sample (red, AI; black, no AI). Data were shown as mean ± SD, and significance was determined using Student’s t test (a–d). *P < 0.05, **P < 0.01. Scale bar, 100 μm or 25 μm
Fig. 5
Fig. 5
NOD2 interacts with lamin A/C and promotes its degradation through nuclear autophagy. a Co-immunoprecipitation of endogenous NOD2 with lamin A/C in primary hepatocytes. b GST pull-down assay showing that NOD2 directly interacts with lamin A/C through its LRR domain (amino acids 619–1040). c Immunofluorescence showed co-localization (yellow) of HA-NOD2 (green) and lamin A/C (red) in primary hepatocytes after MDP treatment. Bar graphs shown are HA-NOD2 nuclear translocation ratio and overlap co-efficient of HA-NOD2/lamin A/C co-localization, n = 3; *P < 0.05. Scale bar, 5 μm. d NOD2 activation decreases lamin A/C protein independently from RIP2. Primary hepatocytes from indicated mice were treated with different concentrations of MDP for 4 h or MDP (10 μg/ml) at the indicated time points. e Primary hepatocytes were treated with MDP (10 μg/ml), and then, p-RIP2, lamin A/C, LC3 and P62 protein levels were examined in the nucleus and cytoplasm. f Primary hepatocytes from indicated mice were treated with MDP (10 μg/ml). The protein levels of lamin A/C, LC3 and P62 were examined in the nucleus. g Transmission electron microscopy analysis of primary hepatocytes treated with MDP. White arrow: autophagosome; black arrow: perinuclear heterochromatin; representative nuclear membrane collapse and perinuclear heterochromatin decrease are labeled as event 1 and event 2, respectively. Nu, nucleus. Scale bar, 2.5 μm or 500 nm. h Primary hepatocytes expressing HA-NOD2 were infected with lentivirus carrying GFP-LC3 and treated with vehicle or MDP (10 μg/ml) for 2 h. Cells were then stained with lamin A/C and HA antibodies. co-localization (white) of lamin A/C (red), HA-NOD2 (purple), GFP-LC3 (green) and DAPI (blue) in primary hepatocytes was imaged by confocal microscopy after MDP treatment. Nuclear and cytoplasmic events are indicated by arrows. Scale bar, 5 μm. Data were shown as mean ± SD, and significance was determined using Student’s t test (c)
Fig. 6
Fig. 6
NOD2 activation inhibits DNA damage repair via lamin A/C degradation. a, b MDP (10 μg/ml) treatment inhibited 53BP1 recruitment to the DNA lesion sites in DEN-treated (100 μg/ml) hepatocytes. Representative images (a) and quantification (b) of γ-H2AX/53BP1 overlapping foci, n = 3. Immunofluorescence showed co-localization (yellow) of 53BP1 (green) and γ-H2AX (red). c, d The inhibitory effect of MDP (10 μg/ml) on 53BP1 recruitment is NOD2-dependent and can be reversed by lamin A/C overexpression (OE) in DEN-treated (100 μg/ml) hepatocytes. Representative images (c) and quantification (d) of γ-H2AX/53BP1 overlapping foci, n = 3. e MDP (10 μg/ml) treatment NOD2-dependently decreased chromatin-bound SITR6 in DEN-treated (100 μg/ml) hepatocytes, which was restored by lamin A/C overexpression. Cell lysates were fractionated to determine chromatin-bound Sirt6 levels. Bar graph shows the densitometric analyses of chromatin Sirt6 bands relative to Histone 3, n = 3. Dt, detergent-extractable fraction; Rn, RNase-extractable fraction; Chr, purified chromatin fraction, indicated in blue. f MDP (10 μg/ml) treatment NOD2-dependently decreased NHEJ efficiency, which was reversed by lamin A/C overexpression, n = 3. Data were shown as mean ± SD, and significance was determined using ordinary two-way (b) or one-way ANOVA with a Sidak test (d, e) and Student’s t test (f). *P < 0.05, **P < 0.01, n.s., not significant. Scale bar, 5 μm
Fig. 7
Fig. 7
Both RIP2 and lamin A/C are required for NOD2 activation-promoted hepatocarcinogenesis. a, b Male Lamn△hep and Rip2/Lamn△hep mice were injected with DEN (25 mg/kg, i.p.) at the age of 14–16 days followed by 8 injections of CCl4 (1.2 ml/kg, i.p., biweekly, starting 4 weeks after DEN injection) and either MDP (100 μg/mice, every other day) or PBS via intraperitoneal injection for 10 times starting three week before the first injection of CCl4. Mice were killed 1 and 6 months after DEN injection. a Representative immunohistochemistry images and quantification of 8-OHdG and γ-H2AX in livers of Lamn△hep and Rip2/Lamn△hep mice 1 month after DEN treatment. Arrowheads indicate γ-H2AX+ cells, n = 5. Scale bar, 50 μm or 25 μm. b Representative gross appearance, quantification of tumor number and size 6 months after DEN treatment are shown, n = 5–8. Arrowheads indicate tumors in liver. c Immunohistochemistry staining and semi-quantification of lamin A/C in HCC samples from ZHH1. n = 141. Scale bar, 50 μm. d Representative immunohistochemistry images of lamin A/C in HCC and ANT tissues. Scale bar, 50 μm. e Negative correlation between NOD2 and lamin A/C protein in HCC samples from ZHH1, n = 141; Pearson correlation analysis. Scale bar, 400 μm or 50 μm. f Allelic imbalances were measured in HCC clinical samples (red, AI; black, no AI). g Increased NOD2 expression in HCC patients from TCGA database with TP53 mutations. h Proposed schematic of hepatic NOD2 regulatory mechanisms in HCC carcinogenesis. Data were shown as mean ± SD, and significance was determined using ordinary two-way ANOVA with Sidak test (a, b), paired (c) and unpaired Student’s t test (g). *P < 0.05, **P < 0.01, n.s., not significant

Similar articles

Cited by

References

    1. Bray F, Ferlay J, Soerjomataram I, Siegel RL, Torre LA, Jemal A. Global cancer statistics 2018: GLOBOCAN estimates of incidence and mortality worldwide for 36 cancers in 185 countries. CA Cancer J Clin. 2018;68:394–424. doi: 10.3322/caac.21492. - DOI - PubMed
    1. Roos WP, Thomas AD, Kaina B. DNA damage and the balance between survival and death in cancer biology. Nat Rev Cancer. 2016;16:20–33. doi: 10.1038/nrc.2015.2. - DOI - PubMed
    1. Zhang HL, Yu LX, Yang W, Tang L, Lin Y, Wu H, et al. Profound impact of gut homeostasis on chemically-induced pro-tumorigenic inflammation and hepatocarcinogenesis in rats. J Hepatol. 2012;57:803–812. doi: 10.1016/j.jhep.2012.06.011. - DOI - PubMed
    1. Yu L, Yan H, Liu Q, Yang W, Wu H, Dong W, et al. Endotoxin accumulation prevents carcinogen-induced apoptosis and promotes liver tumorigenesis in rodents. Hepatology (Baltimore, Md.). 2010;52:1322–1333. - PubMed
    1. Yu LX, Schwabe RF. The gut microbiome and liver cancer: mechanisms and clinical translation. Nat Rev Gastroenterol Hepatol. 2017;14:527–539. doi: 10.1038/nrgastro.2017.72. - DOI - PMC - PubMed

Publication types

MeSH terms

Substances