

SARS-CoV-2 Transmission From People Without COVID-19 Symptoms
- PMID: 33410879
- PMCID: PMC7791354
- DOI: 10.1001/jamanetworkopen.2020.35057
SARS-CoV-2 Transmission From People Without COVID-19 Symptoms
Erratum in
-
Error in Supplement.JAMA Netw Open. 2021 Feb 1;4(2):e211383. doi: 10.1001/jamanetworkopen.2021.1383. JAMA Netw Open. 2021. PMID: 33576813 Free PMC article. No abstract available.
Abstract
Importance: Severe acute respiratory syndrome coronavirus 2 (SARS-CoV-2), the etiology of coronavirus disease 2019 (COVID-19), is readily transmitted person to person. Optimal control of COVID-19 depends on directing resources and health messaging to mitigation efforts that are most likely to prevent transmission, but the relative importance of such measures has been disputed.
Objective: To assess the proportion of SARS-CoV-2 transmissions in the community that likely occur from persons without symptoms.
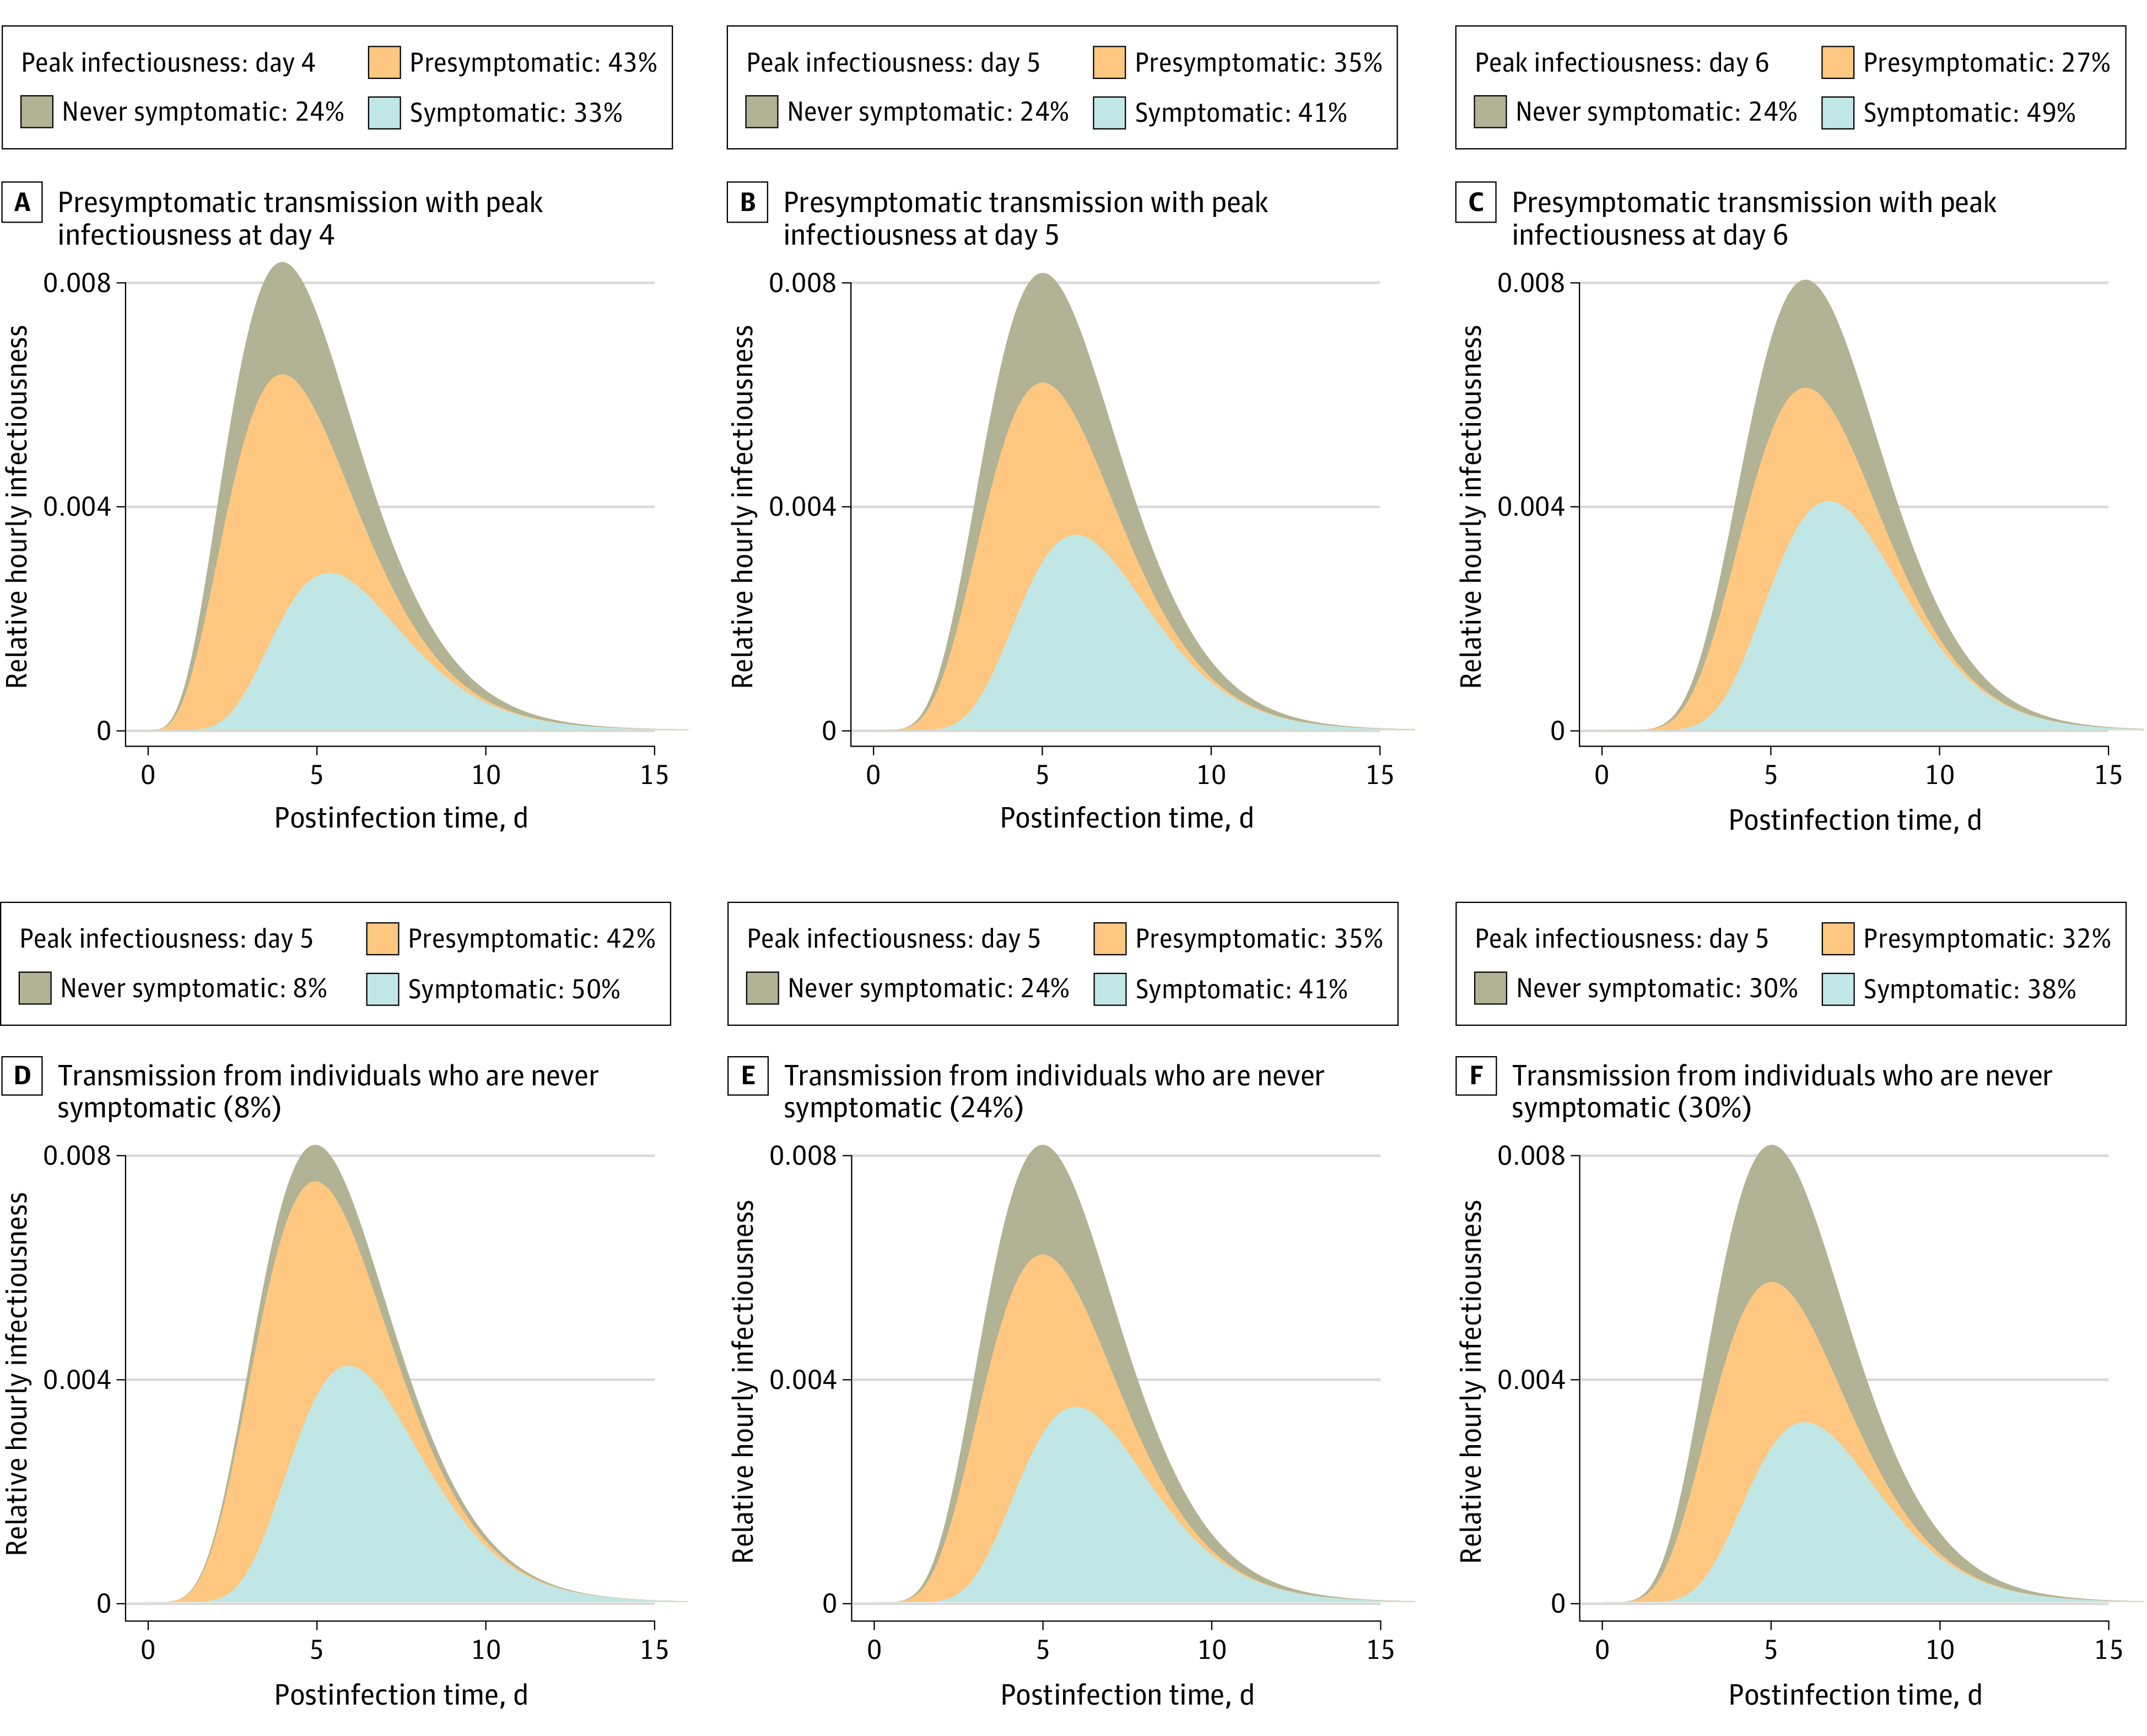
Design, setting, and participants: This decision analytical model assessed the relative amount of transmission from presymptomatic, never symptomatic, and symptomatic individuals across a range of scenarios in which the proportion of transmission from people who never develop symptoms (ie, remain asymptomatic) and the infectious period were varied according to published best estimates. For all estimates, data from a meta-analysis was used to set the incubation period at a median of 5 days. The infectious period duration was maintained at 10 days, and peak infectiousness was varied between 3 and 7 days (-2 and +2 days relative to the median incubation period). The overall proportion of SARS-CoV-2 was varied between 0% and 70% to assess a wide range of possible proportions.
Main outcomes and measures: Level of transmission of SARS-CoV-2 from presymptomatic, never symptomatic, and symptomatic individuals.
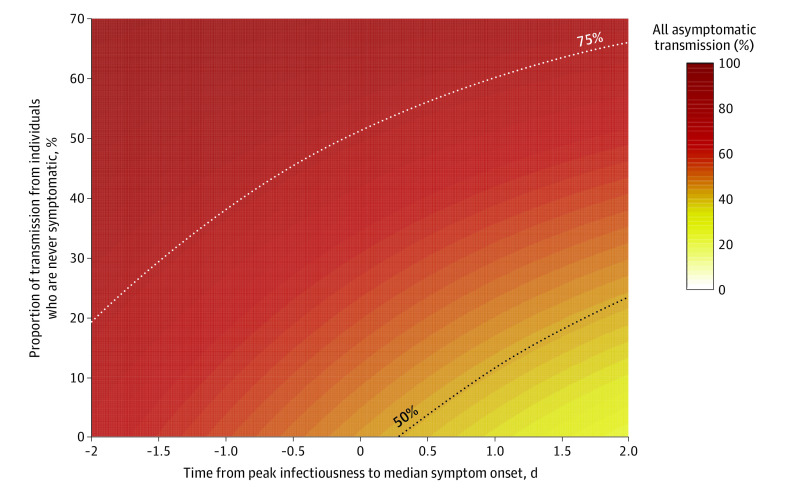
Results: The baseline assumptions for the model were that peak infectiousness occurred at the median of symptom onset and that 30% of individuals with infection never develop symptoms and are 75% as infectious as those who do develop symptoms. Combined, these baseline assumptions imply that persons with infection who never develop symptoms may account for approximately 24% of all transmission. In this base case, 59% of all transmission came from asymptomatic transmission, comprising 35% from presymptomatic individuals and 24% from individuals who never develop symptoms. Under a broad range of values for each of these assumptions, at least 50% of new SARS-CoV-2 infections was estimated to have originated from exposure to individuals with infection but without symptoms.
Conclusions and relevance: In this decision analytical model of multiple scenarios of proportions of asymptomatic individuals with COVID-19 and infectious periods, transmission from asymptomatic individuals was estimated to account for more than half of all transmissions. In addition to identification and isolation of persons with symptomatic COVID-19, effective control of spread will require reducing the risk of transmission from people with infection who do not have symptoms. These findings suggest that measures such as wearing masks, hand hygiene, social distancing, and strategic testing of people who are not ill will be foundational to slowing the spread of COVID-19 until safe and effective vaccines are available and widely used.
Conflict of interest statement
Figures
Similar articles
-
High infectiousness immediately before COVID-19 symptom onset highlights the importance of continued contact tracing.Elife. 2021 Apr 26;10:e65534. doi: 10.7554/eLife.65534. Elife. 2021. PMID: 33899740 Free PMC article.
-
Universal screening for SARS-CoV-2 infection: a rapid review.Cochrane Database Syst Rev. 2020 Sep 15;9(9):CD013718. doi: 10.1002/14651858.CD013718. Cochrane Database Syst Rev. 2020. PMID: 33502003 Free PMC article.
-
[Transmission of SARS-CoV-2 through contact with a SARS-CoV-2-infected individual in the presymptomatic or asymptomatic state in Japan: A case series].Nihon Koshu Eisei Zasshi. 2021 Aug 11;68(8):550-558. doi: 10.11236/jph.20-145. Epub 2021 May 14. Nihon Koshu Eisei Zasshi. 2021. PMID: 33994491 Japanese.
-
Transmission of Severe Acute Respiratory Syndrome Coronavirus-2 (SARS-CoV-2) from pre and asymptomatic infected individuals: a systematic review.Clin Microbiol Infect. 2022 Feb;28(2):178-189. doi: 10.1016/j.cmi.2021.10.015. Epub 2021 Oct 29. Clin Microbiol Infect. 2022. PMID: 34757116 Free PMC article. Review.
-
Pathophysiology, Transmission, Diagnosis, and Treatment of Coronavirus Disease 2019 (COVID-19): A Review.JAMA. 2020 Aug 25;324(8):782-793. doi: 10.1001/jama.2020.12839. JAMA. 2020. PMID: 32648899 Review.
Cited by
-
Le dépistage des personnes asymptomatiques au moyen de tests antigéniques rapides: un outil de santé publique pour lutter contre la COVID-19.CMAJ. 2021 Jun 7;193(23):E888-E891. doi: 10.1503/cmaj.210100-f. CMAJ. 2021. PMID: 34099478 Free PMC article. French. No abstract available.
-
Tools and Techniques for Severe Acute Respiratory Syndrome Coronavirus 2 (SARS-CoV-2)/COVID-19 Detection.Clin Microbiol Rev. 2021 May 12;34(3):e00228-20. doi: 10.1128/CMR.00228-20. Print 2021 Jun 16. Clin Microbiol Rev. 2021. PMID: 33980687 Free PMC article. Review.
-
Prevalence of SARS-CoV-2 antibodies after the Omicron surge, Kingston, Jamaica, 2022.J Clin Virol Plus. 2022 Nov;2(4):100124. doi: 10.1016/j.jcvp.2022.100124. Epub 2022 Nov 17. J Clin Virol Plus. 2022. PMID: 36415687 Free PMC article.
-
Challenges in the Detection of SARS-CoV-2: Evolution of the Lateral Flow Immunoassay as a Valuable Tool for Viral Diagnosis.Biosensors (Basel). 2022 Sep 5;12(9):728. doi: 10.3390/bios12090728. Biosensors (Basel). 2022. PMID: 36140114 Free PMC article. Review.
-
Post-Vaccination SARS-CoV-2 Infections among Health Workers at the University Hospital of Verona, Italy: A Retrospective Cohort Survey.Vaccines (Basel). 2022 Feb 10;10(2):272. doi: 10.3390/vaccines10020272. Vaccines (Basel). 2022. PMID: 35214733 Free PMC article.
References
-
- Zhao S, Gao D, Zhuang Z, et al. . Estimating the serial interval of the novel coronavirus disease (COVID-19): a statistical analysis using the public data in Hong Kong from January 16 to February 15, 2020. Front Phys. Published online September 17, 2020. doi:10.3389/fphy.2020.00347 - DOI
Publication types
MeSH terms
LinkOut - more resources
Full Text Sources
Other Literature Sources
Medical
Miscellaneous
