. 2021 Feb 5;371(6529):eabf4063.
doi: 10.1126/science.abf4063. Epub 2021 Jan 6.

Immunological memory to SARS-CoV-2 assessed for up to 8 months after infection

Affiliations

Immunological memory to SARS-CoV-2 assessed for up to 8 months after infection

Jennifer M Dan et al. Science. .

Abstract

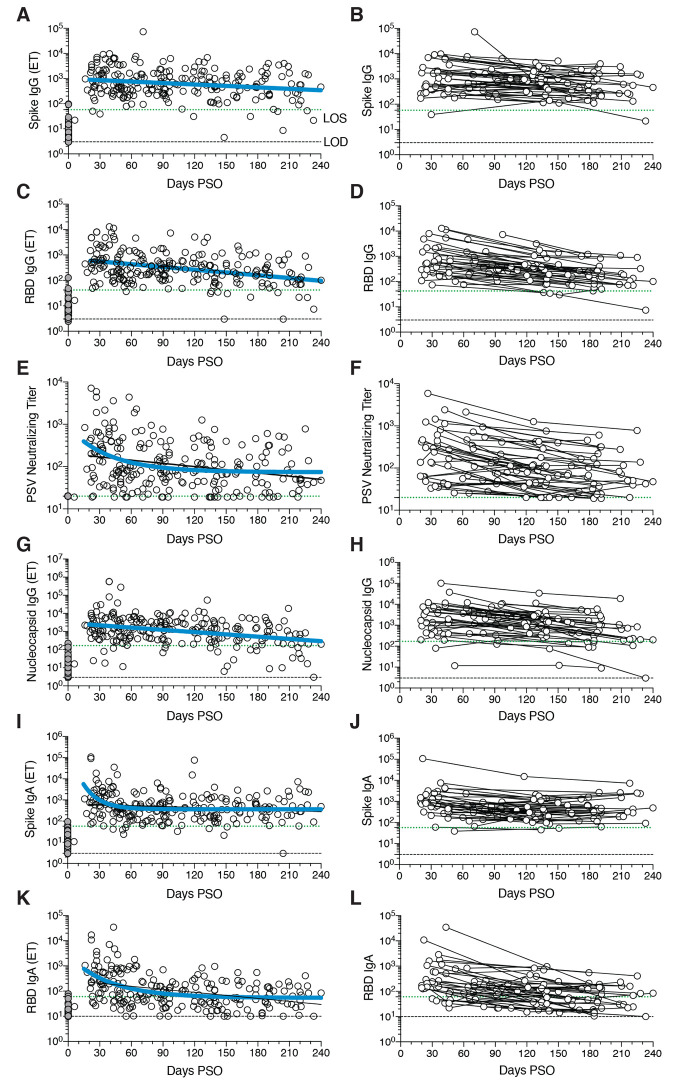
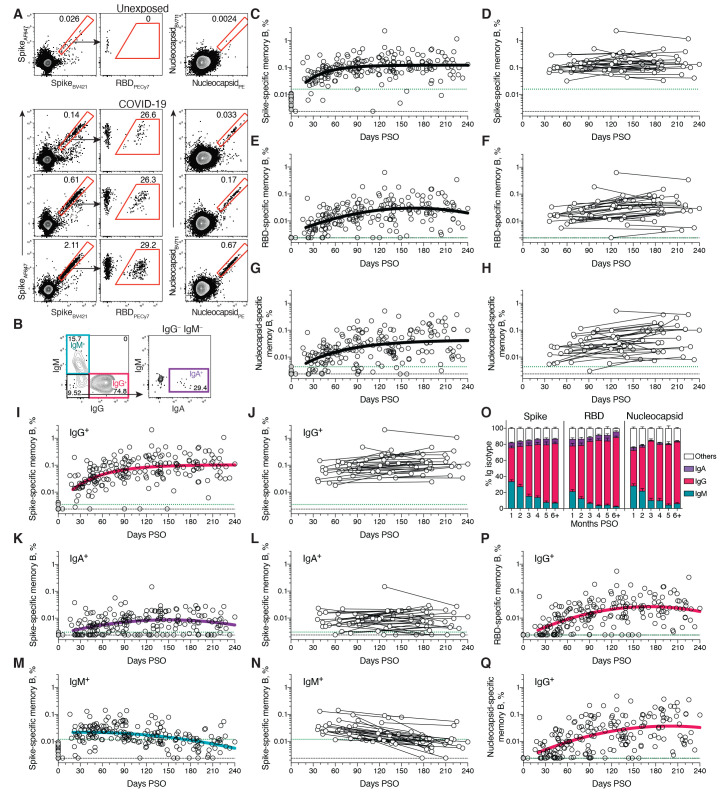
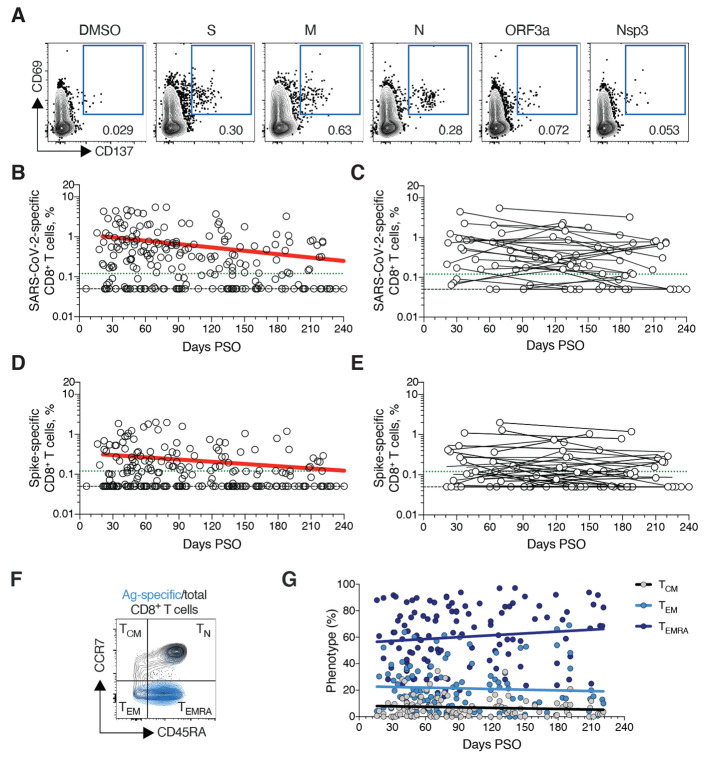
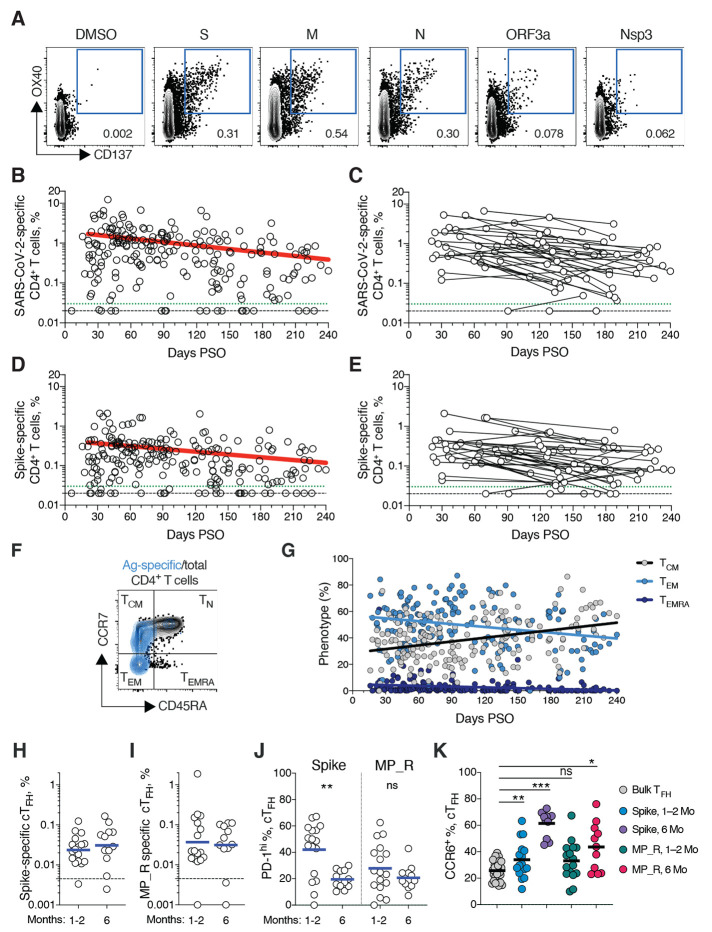
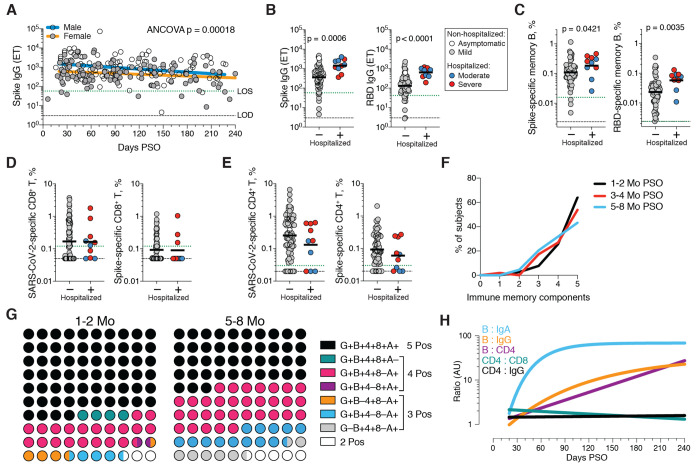
Understanding immune memory to severe acute respiratory syndrome coronavirus 2 (SARS-CoV-2) is critical for improving diagnostics and vaccines and for assessing the likely future course of the COVID-19 pandemic. We analyzed multiple compartments of circulating immune memory to SARS-CoV-2 in 254 samples from 188 COVID-19 cases, including 43 samples at ≥6 months after infection. Immunoglobulin G (IgG) to the spike protein was relatively stable over 6+ months. Spike-specific memory B cells were more abundant at 6 months than at 1 month after symptom onset. SARS-CoV-2-specific CD4+ T cells and CD8+ T cells declined with a half-life of 3 to 5 months. By studying antibody, memory B cell, CD4+ T cell, and CD8+ T cell memory to SARS-CoV-2 in an integrated manner, we observed that each component of SARS-CoV-2 immune memory exhibited distinct kinetics.


Figures

Fig. 1
Fig. 1. Circulating antibodies to SARS-CoV-2 over time.
(A) Cross-sectional Spike IgG from COVID-19 subject plasma samples (n=228). Continuous decay preferred model for best fit curve, t1/2 = 140 days, 95% CI: 89-325 days. R = -0.23, p=0.0006. (B) Longitudinal Spike IgG (n=51), average t1/2 = 103 days, 95% CI: 65-235 days (C) Cross-sectional RBD IgG. Continuous decay preferred model for best fit curve, t1/2 = 83 days, 95% CI: 62 to 126 days. R = -0.36, p<0.0001. (D) Longitudinal RBD IgG, average t1/2 = 69 days, 95% CI: 58-87 days (E) Cross-sectional SARS-CoV-2 PSV neutralizing titers. One-phase decay (blue line) preferred model for best fit curve, initial t1/2 = 27 days, 95% CI 11-157d. R = -0.32. Continuous decay fit line shown as black line. (F) Longitudinal PSV neutralizing titers of SARS-CoV-2 infected subjects, average t1/2 = 90 days, 95% CI: 70-125 days. (G) Cross-sectional Nucleocapsid IgG. Continuous decay preferred model for best fit curve, t1/2 = 68 days, 95% CI: 50-106 days. R = -0.34, p<0.0001. (H) Longitudinal Nucleocapsid IgG, average t1/2 = 68 days, 95% CI: 55-90 days. (I) Cross-sectional Spike IgA titers. One-phase decay (blue line) preferred model for best fit curve, initial t1/2 = 11 days, 95% CI 5-25d. R = -0.30. Continuous decay fit shown as black line. (J) Longitudinal Spike IgA, t1/2 = 210 days, 95% CI 126-627 days. (K) Cross-sectional RBD IgA. One-phase decay (blue line) preferred model for best fit curve, initial t1/2 = 27 days, 95% CI: 15-59 days. R = -0.45. Continuous decay line fit shown in black. (L) Longitudinal RBD IgA, average t1/2 = 74 days, 95% CI: 56-107 days. For cross-sectional analyses, SARS-CoV-2 infected subjects (white circles, n=238) and unexposed subjects (gray circles, n=51). For longitudinal samples, SARS-CoV-2 subjects (n=51). The dotted black line indicates limit of detection (LOD). The dotted green line indicates limit of sensitivity (LOS) above uninfected controls. Unexposed = gray, COVID subjects = white. Log data analyzed in all cases. Thick blue line represents best fit curve. When two fit curves are shown, the thin black line represents the alternative fit curve.
Fig. 2
Fig. 2. Kinetics of SARS-CoV-2 memory B cell responses.
(A) Example flow cytometry plots showing staining patterns of SARS-CoV-2 antigen probes on memory B cells (See fig. S1 for gating). One unexposed donor and three convalescent COVID-19 subjects are shown. Numbers indicate percentages. (B) Gating strategies to define IgM+, IgG+, or IgA+ SARS-CoV-2 Spike-specific memory B cells. The same gating strategies were used for RBD- or Nucleocapsid-specific B cells. (C) Cross-sectional analysis of frequency (% of CD19+ CD20+ B cells) of SARS-CoV-2 S-specific total (IgG+, IgM+, or IgA+) memory B cells. Pseudo-first order kinetic model for best fit curve (R = 0.38). (D) Longitudinal analysis of SARS-CoV-2 Spike-specific memory B cells. (E) Cross-sectional analysis of SARS-CoV-2 RBD-specific total (IgG+, IgM+, or IgA+) memory B cells. Second order polynomial model for best fit curve (R = 0.46). (F) Longitudinal analysis of SARS-CoV-2 RBD-specific memory B cells. (G) Cross-sectional analysis of SARS-CoV-2 Nucleocapsid-specific total (IgG+, IgM+, or IgA+) memory B cells. Pseudo-first order kinetic model for best fit curve (R = 0.44). (H) Longitudinal analysis of IgG+ SARS-CoV-2 Nucleocapsid-specific memory B cells. (I) Cross-sectional analysis of SARS-CoV-2 Spike-specific IgG+ memory B cells. Pseudo-first order kinetic model for best fit curve (R = 0.49). (J) Longitudinal analysis of SARS-CoV-2 Spike-specific IgG+ memory B cells. (K) Cross-sectional analysis of SARS-CoV-2 Spike-specific IgA+ memory B cells. Second order polynomial model for best fit curve (|R| = 0.32). (L) Longitudinal analysis of SARS-CoV-2 Spike-specific IgA+ memory B cells. (M) Cross-sectional analysis of SARS-CoV-2 Spike-specific IgM+ memory B cells. Second order polynomial model for best fit curve (|R| = 0.41). (N) Longitudinal analysis of SARS-CoV-2 Spike-specific IgM+ memory B cells. (O) Fraction of SARS-CoV-2 antigen-specific memory B cells that belong to indicated Ig isotypes at 1-8 months PSO. Mean ± SEM. (P) Cross-sectional analysis of SARS-CoV-2 RBD-specific IgG+ memory B cells. Second order polynomial model for best fit curve (|R| = 0.51). (Q) Cross-sectional analysis of SARS-CoV-2 Nucleocapsid-specific IgG+ memory B cells. Second order polynomial model for best fit curve (|R| = 0.51). n = 20 unexposed subjects (gray circles) and n = 160 COVID-19 subjects (n = 197 data points, white circles) for cross-sectional analysis. n = 36 COVID-19 subjects (n = 73 data points, white circles) for longitudinal analysis. The dotted black line indicates limit of detection (LOD). The dotted green line indicates limit of sensitivity (LOS).
Fig. 3
Fig. 3. SARS-CoV-2 circulating memory CD8+ T cells.
(A) Representative flow cytometry plots of SARS-CoV-2-specific CD8+ T cells (CD69+ CD137+, See fig. S3 for gating) after overnight stimulation with S, N, M, ORF3a, or nsp3 peptide pools, compared to negative control (DMSO). (B) Cross-sectional analysis of frequency (% of CD8+ T cells) of total SARS-CoV-2-specific CD8+ T cells. Continuous decay preferred fit model, t1/2 = 125 days. R = -0.24, p = 0.0003. (C) Longitudinal analysis of total SARS-CoV-2-specific CD8+ T cells in paired samples. (D) Cross-sectional analysis of Spike-specific CD8+ T cells. Linear decay preferred model, t1/2 = 225 days. R = -0.18, p = 0.007. (E) Longitudinal analysis of Spike-specific CD8+ T cells in paired samples. (F, G) Distribution of central memory (TCM), effector memory (TEM), and terminally differentiated effector memory cells (TEMRA) among total SARS-CoV-2-specific CD8+ T cells. n = 169 COVID-19 subjects (n = 215 data points, white circles) for cross-sectional analysis. n = 37 COVID-19 subjects (n = 83 data points, white circles) for longitudinal analysis. The dotted black line indicates limit of detection (LOD). The dotted green line indicates limit of sensitivity (LOS).
Fig. 4
Fig. 4. SARS-CoV-2 circulating memory CD4+ T cells.
(A) Representative flow cytometry plots of SARS-CoV-2-specific CD4+ T cells (CD137+ OX40+, See fig. S4 for gating) after overnight stimulation with S, N, M, ORF3a, or nsp3 peptide pools, compared to negative control (DMSO). (B) Cross-sectional analysis of frequency (% of CD4+ T cells) of total SARS-CoV-2-specific CD4+ T cells. Continuous decay preferred fit model, t1/2 = 94 days. R = -0.29, p<0.0001. (C) Longitudinal analysis of total SARS-CoV-2-specific CD4+ T cells in paired samples from the same subjects. (D) Cross-sectional analysis of Spike-specific CD4+ T cells. Linear decay preferred model, t1/2 = 139 days. R = -0.26, p<0.0001. (E) Longitudinal analysis of Spike-specific CD4+ T cells in paired samples from the same subjects. (F, G) Distribution of central memory (TCM), effector memory (TEM), and terminally differentiated effector memory cells (TEMRA) among total SARS-CoV-2-specific CD4+ T cells. (H, I) Quantitation of SARS-CoV-2-specific circulating T follicular helper (cTFH) cells (surface CD40L+ OX40+, as % of CD4+ T cells. See fig. S5 for gating) after overnight stimulation with (H) Spike (S) or (I) MP_R peptide pools. (J) PD-1hi SARS-CoV-2-specific TFH at 1-2 months (mo) and 6 mo PSO. (K) CCR6+ SARS-CoV-2-specific cTFH in comparison to bulk cTFH cells in blood. For (A-E), n = 169 COVID-19 subjects (n = 215 data points, white circles) for cross-sectional analysis, n = 37 COVID-19 subjects (n = 83 data points, white circles) for longitudinal analysis. The dotted black line indicates limit of detection (LOD). The dotted green line indicates limit of sensitivity (LOS). For (H-J), n = 29 COVID-19 subject samples (white circles), n = 17 COVID-19 subjects at 1-2 mo, n = 12 COVID-19 subjects at 6 mo. The dotted black line indicates limit of detection (LOD). Statistics by (J) Mann-Whitney U test and (K) Wilcoxon signed-rank test. * p<0.05, **p<0.01, *** p<0.001.
Fig. 5
Fig. 5. Immune memory relationships.
(A) Relationship between gender and Spike IgG titers over time. Males: Linear decay preferred model, t1/2 = 110 days, 95% CI: 65-349 days, R = -0.27, p = 0.0046. Females: linear decay preferred model, t1/2 = 159 days, 95% CI 88-846 days, R = -0.22, p = 0.016. ANCOVA p = 0.00018. Test for homogeneity of regressions F = 1.51, p = 0.22. (B-E) Immune memory at 120+ days PSO in COVID-19 non-hospitalized and hospitalized subjects. Symbol colors represent peak disease severity (white: asymptomatic, gray: mild, blue: moderate, red: severe.) For subjects with multiple sample timepoints, only the final timepoint was used for these analyses. (B) Spike-specific IgG (left) and RBD-specific IgG (right) binding titers. n = 64 (non-hospitalized), n = 10 (hospitalized). Mann-Whitney U tests. (C) Frequency memory B cells specific to Spike (left) and RBD (right) at 120+ days PSO. n = 66 (non-hospitalized), n = 10 (hospitalized). Mann-Whitney U tests. (D) Frequency total SARS-CoV-2-specific CD8+ T cells (left) and Spike-specific CD8+ T cells (right). p = 0.72 for total SARS-2-CoV-specific, p = 0.60 for Spike-specific by Mann-Whitney U tests. n = 72 (non-hospitalized), n = 10 (hospitalized). (E) Frequency total SARS-CoV-2-specific CD4+ T cells (left) and Spike-specific CD4+ T cells (right). p = 0.23 for total SARS-CoV-2-specific, p = 0.24 for Spike-specific by Mann-Whitney U tests (F) Immune memory to SARS-CoV-2 during the early phase (1-2 mo, black line), medium phase (3-4 mo, red line), or late phase (5-8 mo, blue line). For each individual, a score of 1 was assigned for each response above LOS for RBD IgG, Spike IgA, RBD-specific memory B cells, SARS-CoV-2 specific CD4+ T cells, and SARS-CoV-2-specific CD8+ T cells, giving a maximum total of 5 components of SARS-CoV-2 immune memory. Only COVID-19 convalescent subjects with all five immunological parameters tested were included in the analysis. n = 78 (1-2 mo), n = 52 (3-4 mo), n = 44 (5-8 mo). (G) Percentage dot plots showing frequencies (normalized to 100%) of subjects with indicated immune memory components as described in (B) during the early (1-2 mo) or late (5-8 mo) phase. “G”, RBD-specific IgG. “B”, RBD-specific memory B cells. “4”, SARS-CoV-2 specific CD4+ T cells. “8”, SARS-CoV-2 specific CD8+ T cells. “A”, Spike-specific IgA. n = 78 (1-2 mo), n = 44 (5-8 mo). (H) Relationships between immune memory compartments in COVID-19 subjects over time, as ratios (full curves and data shown in fig. S10, B to F). AU = arbitrary units, scaled from fig. S10, B to F. “B/IgA”, RBD-specific memory B cell ratio to Spike IgA antibodies. “B/IgG”, RBD-specific memory B cell ratio to RBD IgG antibodies. “B/CD4”, RBD-specific memory B cell ratio to SARS-CoV-2-specific CD4+ T cells. “CD4/CD8”, SARS-CoV-2-specific CD4+ T cells ratio to SARS-CoV-2-specific CD8+ T cells. “CD4/IgG”, SARS-CoV-2-specific CD4+ T cells ratio to RBD IgG antibodies.

Update of

Similar articles

Cited by

References

    1. Stephens D. S., McElrath M. J., COVID-19 and the Path to Immunity. JAMA 324, 1279–1281 (2020). 10.1001/jama.2020.16656 - DOI - PubMed
    1. Grifoni A., Weiskopf D., Ramirez S. I., Mateus J., Dan J. M., Moderbacher C. R., Rawlings S. A., Sutherland A., Premkumar L., Jadi R. S., Marrama D., de Silva A. M., Frazier A., Carlin A. F., Greenbaum J. A., Peters B., Krammer F., Smith D. M., Crotty S., Sette A., Targets of T Cell Responses to SARS-CoV-2 Coronavirus in Humans with COVID-19 Disease and Unexposed Individuals. Cell 181, 1489–1501.e15 (2020). 10.1016/j.cell.2020.05.015 - DOI - PMC - PubMed
    1. Krammer F., SARS-CoV-2 vaccines in development. Nature 586, 516–527 (2020). 10.1038/s41586-020-2798-3 - DOI - PubMed
    1. Suthar M. S., Zimmerman M. G., Kauffman R. C., Mantus G., Linderman S. L., Hudson W. H., Vanderheiden A., Nyhoff L., Davis C. W., Adekunle O., Affer M., Sherman M., Reynolds S., Verkerke H. P., Alter D. N., Guarner J., Bryksin J., Horwath M. C., Arthur C. M., Saakadze N., Smith G. H., Edupuganti S., Scherer E. M., Hellmeister K., Cheng A., Morales J. A., Neish A. S., Stowell S. R., Frank F., Ortlund E., Anderson E. J., Menachery V. D., Rouphael N., Mehta A. K., Stephens D. S., Ahmed R., Roback J. D., Wrammert J., Rapid generation of neutralizing antibody responses in COVID-19 patients. Cell Rep. Med. 1, 100040 (2020). 10.1016/j.xcrm.2020.100040 - DOI - PMC - PubMed
    1. Rydyznski Moderbacher C., Ramirez S. I., Dan J. M., Grifoni A., Hastie K. M., Weiskopf D., Belanger S., Abbott R. K., Kim C., Choi J., Kato Y., Crotty E. G., Kim C., Rawlings S. A., Mateus J., Tse L. P. V., Frazier A., Baric R., Peters B., Greenbaum J., Ollmann Saphire E., Smith D. M., Sette A., Crotty S., Antigen-specific adaptive immunity to SARS-CoV-2 in acute COVID-19 and associations with age and disease severity. Cell 183, 996–1012.e19 (2020). 10.1016/j.cell.2020.09.038 - DOI - PMC - PubMed

Publication types

Substances