. 2021 Jan 4;12(1):94.
doi: 10.1038/s41467-020-20307-9.

TARM1 contributes to development of arthritis by activating dendritic cells through recognition of collagens

Affiliations

TARM1 contributes to development of arthritis by activating dendritic cells through recognition of collagens

Rikio Yabe et al. Nat Commun. .

Abstract

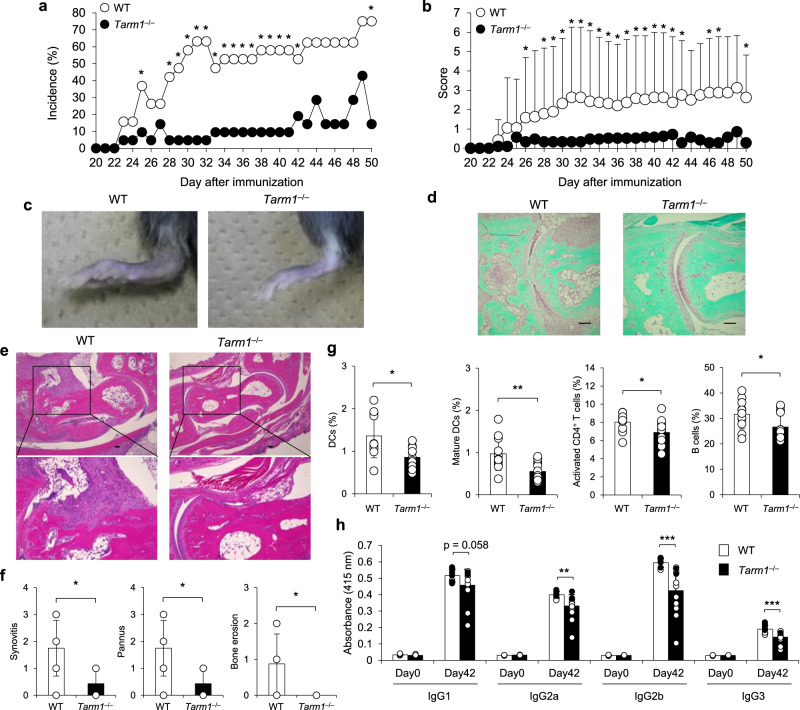
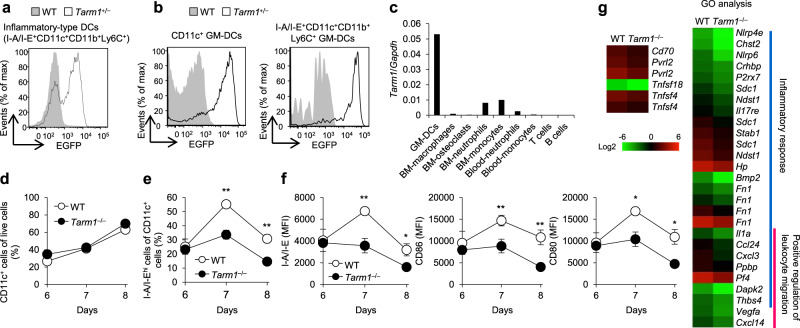
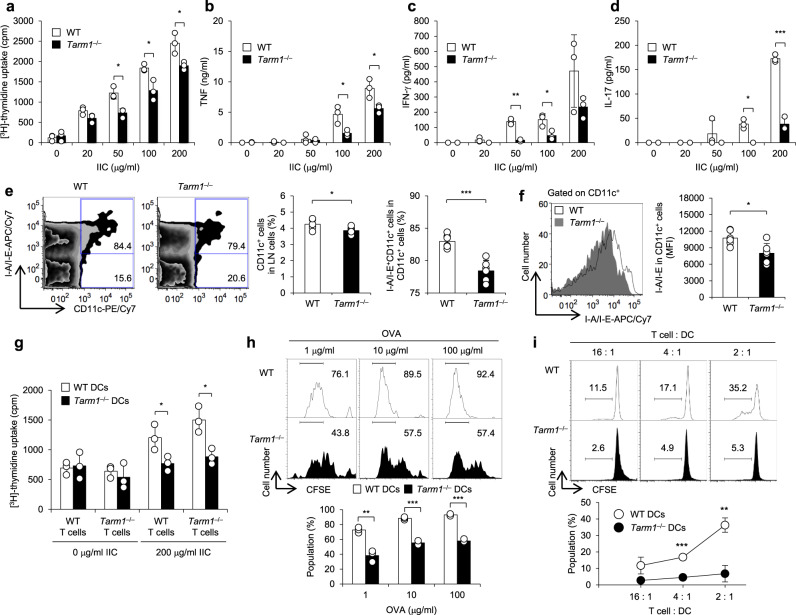
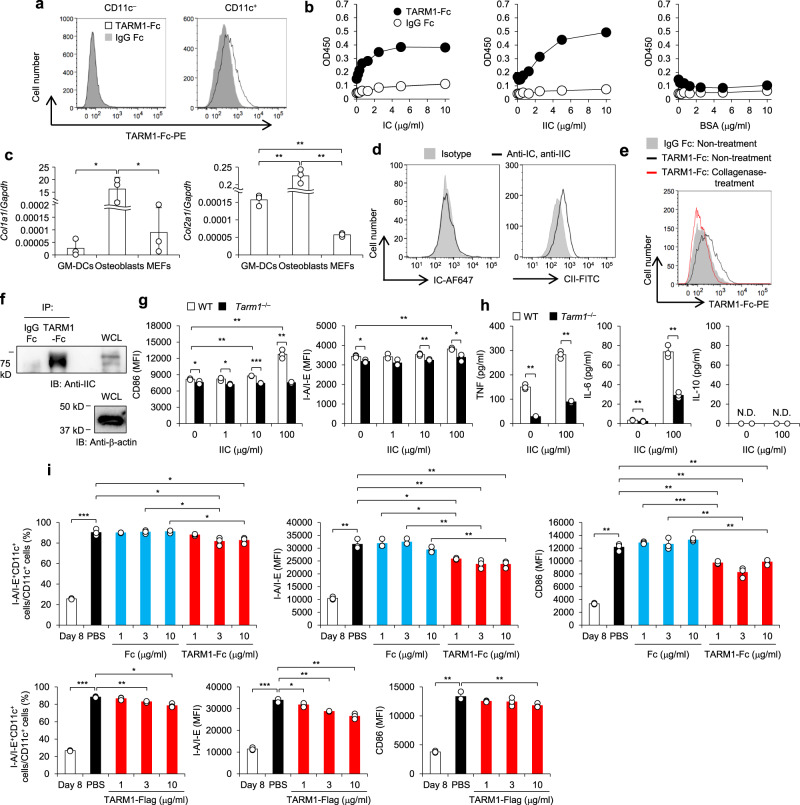
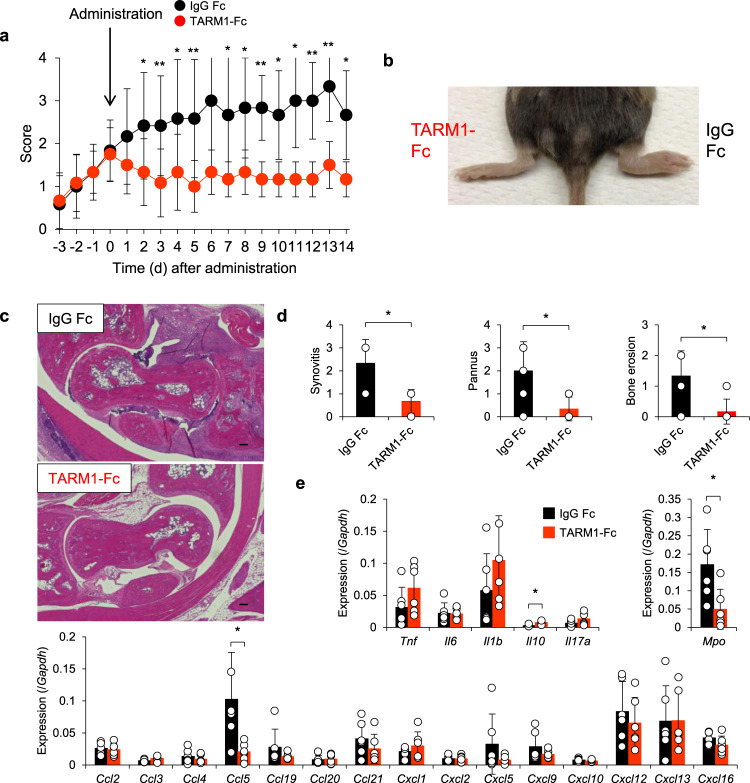
TARM1 is a member of the leukocyte immunoglobulin-like receptor family and stimulates macrophages and neutrophils in vitro by associating with FcRγ. However, the function of this molecule in the regulation of the immune system is unclear. Here, we show that Tarm1 expression is elevated in the joints of rheumatoid arthritis mouse models, and the development of collagen-induced arthritis (CIA) is suppressed in Tarm1-/- mice. T cell priming against type 2 collagen is suppressed in Tarm1-/- mice and antigen-presenting ability of GM-CSF-induced dendritic cells (GM-DCs) from Tarm1-/- mouse bone marrow cells is impaired. We show that type 2 collagen is a functional ligand for TARM1 on GM-DCs and promotes DC maturation. Furthermore, soluble TARM1-Fc and TARM1-Flag inhibit DC maturation and administration of TARM1-Fc blocks the progression of CIA in mice. These results indicate that TARM1 is an important stimulating factor of dendritic cell maturation and could be a good target for the treatment of autoimmune diseases.


Conflict of interest statement

The authors declare no competing interests.

Figures

Fig. 1
Fig. 1. Development of CIA is suppressed in Tarm1–/– mice.
a, b Incidence (a) and severity score (b) of arthritis in WT and Tarm1–/– mice immunized with IIC plus CFA. The sum of individual score was divided by the total mouse number in b. Data from two independent experiments are combined. WT = 19, Tarm1–/– = 21. Mean ± SD. *P < 0.05 [χ2-test (a) and two-tailed Mann–Whitney U test (b)]. c Representative images of ankle joints from WT and Tarm1–/– mice 50 days after CIA induction. bf Representative histology of the affected joints after induction of CIA. Sections (5 μm) of hind limbs of WT and Tarm1–/– mice at day 50 after immunization were stained with Safranin O (d) and HE (e). Histopathological scores including synovitis, pannus, and bone erosion are shown in (f). WT = 8, Tarm1–/– = 7. Mean ± SD. Scale bar, 100 μm. *P < 0.05 (two-tailed Mann–Whitney U test). g Contents of DCs (CD11c+), mature DCs (I-A/I-E+CD11c+), and activated T (CD44+CD4+) and B (CD19+) cells in inguinal LNs from WT and Tarm1–/– mice at 42 days after IIC immunization were determined by flow cytometry. WT = 11, Tarm1–/– = 14. Mean ± SD. *P < 0.05; **P < 0.01 (two-tailed unpaired t test). h IIC-specific IgGs in sera were determined by ELISA. WT = 11, Tarm1–/– = 14. Mean ± SD. Closed circle = arthritic mouse, open circle = non-arthritic mouse. **P < 0.01; ***P < 0.001 (two-tailed unpaired t test). Source data are provided as a Source data file.
Fig. 2
Fig. 2. TARM1 is expressed by and is required for the activation of DCs.
a EGFP expression was examined in inflammatory-type DCs (I-A/I-E+CD11c+CD11b+Ly6C+) of dLNs from WT and Tarm1+/– mice at day 7 after CIA induction by flow cytometry. Data are representative of two independent experiments. b EGFP expression was examined in GM-DCs from Tarm1+/– EGFP reporter mice by flow cytometry at day 8 after treatment with GM-CSF. Non-Tg WT mice were used as controls. Data are representative of three independent experiments. c Tarm1 expression was examined in GM-DCs, BM macrophages, BM osteoclasts, BM neutrophils, BM monocytes, blood neutrophils, blood monocytes, T cells, and B cells from non-immunized WT mice using qPCR. Data are shown as mean of duplicate wells from a mouse and are representative of two independent experiments. d, e GM-DC differentiation from BM cells was examined in vitro. The proportion of CD11c+ (d) and I-A/I-EhiCD11c+ cells (e) were analyzed in WT and Tarm1–/– GM-DCs by flow cytometry at the indicated days after treatment with GM-CSF. Data are representative of three independent experiments. Mean ± SD of triplicate wells. **P < 0.01 (two-tailed unpaired t test). f Expression of DC activation markers, I-A/I-E, CD86, and CD80, were examined in WT and Tarm1–/– GM-DCs after treatment with GM-CSF. Data are representative of three independent experiments. Mean ± SD of triplicate wells. *P < 0.05; **P < 0.01 (two-tailed unpaired t test). g Gene expression levels in WT and Tarm1–/– GM-DCs at day 8 after treatment with GM-CSF were analyzed by DNA microarray. Heat map shows log2 intensity of representative differentially expressed genes between WT and Tarm1–/– GM-DCs (fold change >2.0). Source data are provided as a Source data file and Supplementary Data 1.
Fig. 3
Fig. 3. Antigen-presenting ability of DCs is impaired in Tarm1–/– mice.
a At day 10 after immunization, LN cells from WT and Tarm1–/– mice were re-stimulated with the indicated concentrations of IIC for 66 h. [3H]-thymidine incorporation into acid-insoluble fraction was determined. Data are representative of three independent experiments. Mean ± SD *P < 0.05 (two-tailed unpaired t test). bd Cytokine concentrations in culture supernatants in a were determined by ELISA. Data are representative of three independent experiments. Mean ± SD. *P < 0.05; **P < 0.01; ***P < 0.001 (two-tailed unpaired t test). e The proportions of CD11c+ cells in inguinal LN cells and I-A/I-E+CD11c+ cells in CD11c+ cells from WT and Tarm1–/– mice were analyzed by flow cytometry at day 10 after immunization. Data are representative of three independent experiments. WT = 6, Tarm1–/– = 6. Mean ± SD. *P < 0.05; ***P < 0.001 (two-tailed unpaired t test). f The expression of I-A/I-E on CD11c+ LN cells from WT and Tarm1–/– mice were analyzed by flow cytometry at day 10 after immunization. Data are representative of three independent experiments. WT = 6, Tarm1–/– = 6. Mean ± SD. *P < 0.05 (two-tailed unpaired t test). g At day 10 after immunization, DCs and T cells from WT and Tarm1–/– mouse dLNs were co-cultured in the presence of IIC. T cell proliferation was determined by [3H]-thymidine incorporation. Data are representative of three independent experiments. Mean ± SD. *P < 0.05 (two-tailed unpaired t test). h CFSE-labeled OT-II CD4+ T cells were co-cultured with WT and Tarm1–/– GM-DCs in the presence of the indicated concentrations of OVA. Three days later, CFSE intensity was assessed by flow cytometry. Data are representative of three independent experiments. Mean ± SD of triplicate wells. **P < 0.01; ***P < 0.001 (two-tailed unpaired t test). i T cells from BALB/cA mice were co-cultured with WT and Tarm1–/– GM-DCs from C57BL/6J mice. Five days later, CFSE intensity was assessed by flow cytometry. Data are representative of two independent experiments. Mean ± SD of triplicate wells. **P < 0.01; ***P < 0.001 (two-tailed unpaired t test). Source data are provided as a Source data file.
Fig. 4
Fig. 4. IIC is a functional ligand for TARM1 and controls GM-DC maturation in a TARM1-dependent manner.
a Bindings of TARM1-Fc to WT GM-DCs were analyzed by flow cytometry at day 8 after GM-CSF treatment. IgG Fc was used as a negative control. b Bindings of TARM1-Fc and IgG Fc to plate-coated IC, IIC, and BSA were analyzed by solid-phase binding assay. c Expression levels of Col1a1 and Col2a1 in GM-DCs, osteoblasts, and MEFs were analyzed by qPCR. d Cell surface expression of IC and IIC on GM-DCs at day 8 was analyzed by flow cytometry using specific antibodies. e Binding of TARM1-Fc to non- or collagenase-treated GM-DCs was analyzed by flow cytometry. IgG Fc was used as a negative control. f Whole GM-DC lysate was incubated with TARM1-Fc- and IgG Fc-beads, and after collection of beads, proteins were recovered. Then these proteins were immunoblotted with anti-IIC antibodies. Whole-cell lysate (WCL) was also immunoblotted with anti-IIC and anti-β-actin antibodies. g Expression of DC activation markers (CD86 and I-A/I-E) on WT and Tarm1–/– GM-DCs was analyzed by flow cytometry after stimulation with different concentration of soluble IIC for 24 h. h Cytokine concentrations (TNF, IL-6, and IL-10) of culture supernatants in g were determined by flow cytometry with cytometric beads. i GM-DCs at day 8 after GM-CSF treatment were stimulated with plate-bound IIC (1 μg/ml) for 24 h in the absence (PBS) or presence of TARM1-Fc, Fc, or TARM1-Flag (1, 3, and 10 μg/ml). The expression levels of I-A/I-E and CD86 in CD11c+ cells before and after IIC stimulation were analyzed by flow cytometry. The expression levels of these molecules on GM-DCs at day 8 before IIC treatment were shown as Day 8. All the data are representative of three independent experiments, except two experiments in i. Mean ± SD of triplicate wells. N.D. not detected. *P < 0.05; **P < 0.01; ***P < 0.001 (two-tailed unpaired t test). Source data are provided as a Source data file.
Fig. 5
Fig. 5. Administration of TARM1-Fc attenuates the development of CIA.
a Severity score of arthritic joints from CIA-induced DBA/1J mice treated with TARM1-Fc or IgG Fc. TARM1-Fc and IgG Fc (1 μg/30 μl for each) were administrated into the articular cavity of the left and right knee joints of a CIA-induced mouse, respectively, and the severity scores of IgG Fc- (black) or TARM1-Fc-injected paw (red) were measured separately. Data from two independent experiments are combined (n = 12). Mean ± SD. *P < 0.05; **P < 0.01 (two-tailed Mann–Whitney U test). b Representative photograph of feet treated with TARM1-Fc (left) or IgG Fc (right) as shown in a. c, d Histology of the HE-stained ankle joint at day 14 after TARM1-Fc or IgG Fc treatment (c). Data are representative of six mice. Histological score of synovitis, pannus formation, and bone erosion of ankle joints are shown in (d). Mean ± SD. Scale bar, 100 μm. *P < 0.05 (two-tailed Mann–Whitney U test). e Gene expressions in arthritic ankles and tarsal joints from TARM1-Fc- or IgG Fc-treated legs were analyzed by qPCR (n = 6). Mean ± SD. *P < 0.05 (two-tailed unpaired t test). Source data are provided as a Source data file.

Similar articles

Cited by

References

    1. Martin AM, Kulski JK, Witt C, Pontarotti P, Christiansen FT. Leukocyte Ig-like receptor complex (LRC) in mice and men. Trends Immunol. 2002;23:81–88. doi: 10.1016/S1471-4906(01)02155-X. - DOI - PubMed
    1. Barrow AD, Trowsdale J. The extended human leukocyte receptor complex: diverse ways of modulating immune responses. Immunol. Rev. 2008;224:98–123. doi: 10.1111/j.1600-065X.2008.00653.x. - DOI - PubMed
    1. Trowsdale J, Jones DC, Barrow AD, Traherne JA. Surveillance of cell and tissue perturbation by receptors in the LRC. Immunol. Rev. 2015;267:117–136. doi: 10.1111/imr.12314. - DOI - PubMed
    1. Anderson KJ, Allen RL. Regulation of T-cell immunity by leucocyte immunoglobulin-like receptors: innate immune receptors for self on antigen-presenting cells. Immunology. 2009;127:8–17. doi: 10.1111/j.1365-2567.2009.03097.x. - DOI - PMC - PubMed
    1. van Vliet SJ, Garcia-Vallejo JJ, van Kooyk Y. Dendritic cells and C-type lectin receptors: coupling innate to adaptive immune responses. Immunol. Cell Biol. 2008;86:580–587. doi: 10.1038/icb.2008.55. - DOI - PubMed

Publication types

MeSH terms