. 2020 Dec 22:9:e58037.
doi: 10.7554/eLife.58037.

Neuronal hyperexcitability is a DLK-dependent trigger of herpes simplex virus reactivation that can be induced by IL-1

Affiliations

Neuronal hyperexcitability is a DLK-dependent trigger of herpes simplex virus reactivation that can be induced by IL-1

Sean R Cuddy et al. Elife. .

Abstract

Herpes simplex virus-1 (HSV-1) establishes a latent infection in neurons and periodically reactivates to cause disease. The stimuli that trigger HSV-1 reactivation have not been fully elucidated. We demonstrate HSV-1 reactivation from latently infected mouse neurons induced by forskolin requires neuronal excitation. Stimuli that directly induce neurons to become hyperexcitable also induced HSV-1 reactivation. Forskolin-induced reactivation was dependent on the neuronal pathway of DLK/JNK activation and included an initial wave of viral gene expression that was independent of histone demethylase activity and linked to histone phosphorylation. IL-1β is released under conditions of stress, fever and UV exposure of the epidermis; all known triggers of clinical HSV reactivation. We found that IL-1β induced histone phosphorylation and increased the excitation in sympathetic neurons. Importantly, IL-1β triggered HSV-1 reactivation, which was dependent on DLK and neuronal excitability. Thus, HSV-1 co-opts an innate immune pathway resulting from IL-1 stimulation of neurons to induce reactivation.

Keywords: IL-1; dual leucine zipper kinase; epigenetics; herpes simplex virus; hyperexcitability; infectious disease; microbiology; mouse; neuroscience.


Conflict of interest statement

SC, AS, SD, PS, JS, PK, TD, MF, BD, CB, AC No competing interests declared

Figures

Figure 1.
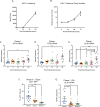
Figure 1.. HSV-1 Reactivation from sympathetic neurons is induced by adenylate cyclase activation.
(A) Schematic of the primary sympathetic superior cervical ganglia (SCG)-derived model of HSV latency. Reactivation was quantified based on Us11-GFP-positive neurons in presence of WAY-150168, which prevents cell-to-cell spread. (B) Schematic of the cellular pathways activated by forskolin treatment. Forskolin can act both intracellularly to activate adenylate cyclase (AC) and increasing the levels of cAMP or extracellularly on ion channels. (C) Numbers of Us11-GFP-positive neurons following addition of either forskolin (60 μM) or cell-impermeable dideoxy-forskolin (60 μM) treatment of latently-infected sympathetic neurons. (D) Numbers of Us11-GFP-positive neurons following treatment with a cAMP mimetic 8-Bromo-cAMP (125 μM). (E) Reactivation, quantified by Us11-GFP-positive neurons, was induced by forskolin in the presence or absence of the adenylate cyclase inhibitor SQ22,536 (50 μM). In C-E each point represents a single biological replicate, and the mean and standard errors of the mean (SEM) are also shown. In D statistical comparisons were made using an unpaired t-test. In C and E statistical comparisons were made using a one-way ANOVA with a Tukey's multiple comparisons test. *p<0.05, **p<0.01.
Figure 2.
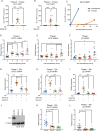
Figure 2.. Reactivation triggered by forskolin involves a DLK/JNK-dependent phase I of viral gene expression.
(A) Reactivation was induced by forskolin in the presence of JNK inhibitor SP600125 (20 μM). (B) Reactivation was induced by forskolin in the presence of the DLK inhibitor GNE-3511 (4 μM). In A and B each experimental replicate is shown. (C) Reactivation was induced by forskolin or superinfection with a wild-type (F strain) HSV-1 (MOI of 10 PFU/cell) and qualified based on Us11-GFP-positive neurons (n = 3). (D–F) RT-qPCR for viral mRNA transcripts following forskolin treatment of latently infected SCGs. (G–I) RT-qPCR for viral lytic transcripts at 20 hr post-forskolin treatment and in presence of the JNK inhibitor SP600125 (20 μM) and the DLK inhibitor GNE-3511 (4 μM). (J) Neurons were transduced with a non-targeting shRNA control lentivirus or two independent lentiviruses expressing shRNAs that target DLK (shDLK-1, shDLK-2). Western-blotting for DLK or β-III tubulin was carried out 3 days post transduction. The percentage knock-down of DLK normalized to β-III tubulin is shown. (K and L) RT-qPCR for viral mRNA transcripts following forskolin treatment of latently infected SCGs that were either transduced with the shRNA control or shRNA DLK lentiviruses. In D-I, K, and L, each experimental replicate is represented. Statistical comparisons were made using a one-way ANOVA with a Tukey’s multiple comparison. *p<0.05, **p<0.01, ***p<0.001. The mean and SEM are shown.
Figure 2—figure supplement 1.
Figure 2—figure supplement 1.. Reactivation triggered by forskolin triggers a wave of lytic gene expression that precedes DNA Replication and infectious virus production.
(A) Titers of infectious virus detected from reactivating neurons induced with forskolin (n = 4). (B) Quantification of the relative viral genome copy number following forskolin-mediated reactivation based on gC copy number normalized to cellular GAPDH and expressed relative to the 0 hr time-point (n = 7). (C–E) RT-qPCR for viral mRNA transcripts following forskolin treatment of latently infected SCGs. (F) Quantification of Us11-GFP neurons and (G) RT-qPCR for UL30 mRNA transcript following forskolin treatment of latently infected SCGs that were either transduced with the shRNA control or shRNA DLK lentiviruses. Statistical comparisons were made using a one-way ANOVA with a Tukey’s multiple comparison. *p<0.05, **p<0.01, ***p<0.001. (C–E) In C-G each biological replicate is represented. The means and SEMs are shown.
Figure 2—figure supplement 2.
Figure 2—figure supplement 2.. Effect of PKA, CREB, Rapgef2 and EPAC Inhibition on HSV-1 Reactivation.
(A) Latently infected cultures were reactivated with forskolin (60 μM) in the presence of the PKA inhibitor KT 5720 (3 µM) and the number of Us11-GFP-positive neurons quantified at 3 days post-reactivation. (B) RT-qPCR for the viral lytic transcript ICP27 at 20 hr post-forskolin treatment and in the presence of KT 5720. (C) Latently infected cultures were reactivated with forskolin in the presence of the CREB inhibitor 666–15 (2 µM). (D) RT-qPCR for ICP27 at 20 hr post-forskolin treatment and in the presence of 666–15. (E) Latently infected cultures were reactivated with forskolin (60 μM) in the presence of the EPAC inhibitor ESI09 (10 µM). (F) Latently infected cultures were reactivated with 8-Bromo-cAMP (125 μM) in the presence of the Rapgef2 inhibitor SQ22,536 (50 µM). Individual experimental replicates are represented along with the means and SEMs. Statistical comparisons were made using a one-way ANOVA with a Tukey’s multiple comparison. *p<0.05, **p<0.01, ***p<0.001.
Figure 3.
Figure 3.. The Initial wave of viral lytic gene expression during forskolin-mediated reactivation is independent on histone demethylase activity.
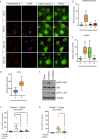
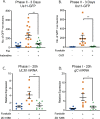
(A) Quantification of the percentage of genome foci stained using click-chemistry that co-localize with H3K9me3/S10p. At least 15 fields of view with 1–8 genomes per field of view were blindly scored from two independent experiments. Data are plotted around the median, with the boxes representing the 25th–75th percentiles and the whiskers the 1st-99th percentiles. (B) Representative images of click-chemistry based staining of HSV-EdC genomes and H3K9me3/S10p staining at 5 hr post-forskolin treatment. (C and D). Effect of the LSD1 inhibitors OG-L002 and S 2101 on forskolin-mediated Phase I of reactivation determined by RT-qPCR for ICP27 (C) and gC (D) viral lytic transcripts at 20 hr post-forskolin treatment and in the presence of 15 μM OG-L002 and 20 μM S 2102. (E) Effect of the JMJD3 and UTX inhibitor GSK-J4 (2 μM) on forskolin-mediated Phase I measured by RT-qPCR for viral lytic transcripts ICP27 (E) and gC (F) at 20 hr post-forskolin treatment and in the presence of GSK-J4. For C-F each experimental replicate along with the mean and SEM is represented. (C–F). Statistical comparisons were made using a one-way ANOVA with a Tukey’s multiple comparison. *p<0.05, **p<0.01, ***p<0.001.
Figure 3—figure supplement 1.
Figure 3—figure supplement 1.. Forskolin induces hyperexcitability-associated chromatin changes, and hsv reactivation that requires histone demethylase.
(A) SCG neurons were treated with forskolin and immunofluorescence staining was carried out for H3K9me3/S10p, the DNA damage marker γH2AX and the neuronal marker beta III-tubulin. (B) Quantification of neuronal nuclear staining intensity for H3K9me3 (>150 cells/condition). (C) Quantification of neuronal nuclear staining for γH2AX. In B and C data are plotted around the median and whiskers represent the 2.5–97.5 percentile range. (D). Western blotting for pS475-AKT, total AKT, pS73-c-Jun and tubulin at 15 hr post-treatment with the PI3-kinase inhibitor LY294002 (20 µM) or forskolin (60 µM) (E). Effect of the LSD1 inhibitors OG-L002 (15 μM) and S 2101 (20μM) on forskolin-mediated reactivation measured by Us11-GFP-positive neurons (F). Effect of the JMJD3 and UTX inhibitor GSK-J4 (2 μM) on forskolin-mediated reactivation measured by Us11-GFP-positive neurons (G). Statistical comparisons were made using a one-way ANOVA with a Tukey’s multiple comparison. *p<0.05, **p<0.01, ***p<0.001 (E, F). In E and F individual experimental replicates are shown along with the mean and SEM.
Figure 4.
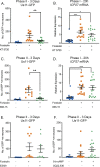
Figure 4.. HSV Reactivation Mediated by Forskolin Requires Neuronal Excitability.
(A) Latently infected cultures were reactivated with forskolin in the presence of the voltage-gated sodium channel blocker tetrodotoxin (TTX; 1 µM) and the number of Us11-GFP-positive neurons quantified at 3 days post-reactivation. (B) Latently infected cultures were reactivated with forskolin in the presence of the voltage-gated potassium channel blocker tetraethylammonium (TEA; 10 mM) and the number of Us11-GFP-positive neurons quantified at 3 days post-reactivation. (C) Forskolin-mediated reactivation in the presence of the HCN channel blockers ZD 7288 (10μM) quantified as the numbers of Us11-GFP-positive neurons at 3 days post-reactivation. (D) The effect of ZD 7288 on the HSV lytic gene transcript ICP27 during Phase I reactivation measured at 20 hr post-forskolin treatment by RT-qPCR. In A-D individual experimental replicates are represented along with the mean and SEM. (E and F) Quantification of the relative nuclear staining for H3K9me3/S10p and γH2AX in SCG neurons at 5 hr post-forskolin treatment and in the presence of ZD 7288 from >800 cells/condition from two independent experiments. Data are plotted around the mean, with the boxes representing the 25th-75th percentiles and the whiskers the 5st-95th percentiles. Statistical comparisons were made using a one-way ANOVA with a Tukey’s multiple comparison (A–D) or two-tailed unpaired t-test (E–F). *p<0.05, **p<0.01, ***p<0.001. In A-D individual experimental replicates are represented.
Figure 4—figure supplement 1.
Figure 4—figure supplement 1.. HSV Reactivation Mediated by Forskolin Requires Neuronal Excitability.
(A and B) Latently infected cultures were reactivated with forskolin in the presence of the HCN channel inhibitors ivabradine (20 µM; A) and CsCl (3 mM; B). Latently infected cultures were reactivated with forskolin in the presence of the HCN inhibitor ZD 7288 (10 µM) and viral lytic transcripts measured at 20 hr post-reactivation (C and D). Individual experimental replicates are represented in addition to the mean and SEM. Statistical comparisons were made using a one-way ANOVA with a Tukey’s multiple comparison. *p<0.05, **p<0.01.
Figure 5.
Figure 5.. HSV Reactivation triggered by prolonged neuronal hyperexcitability is DLK/JNK-dependent.
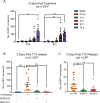
(A) Latently infected SCG cultures were treated with forskolin or KCl (55 mM) for the indicated times followed by wash-out. Reactivation was quantified by number of Us11-GFP-positive neurons at 3 days after the initial stimulus was added. (B) Latently infected neurons were placed in tetrodotoxin (TTX; 1 μM) for 2 days and the TTX was then washed out. At the time of wash-out the JNK inhibitor SP600125 (20 μM) or DLK inhibitor GNE-3511 (4 μM) was added. (C) Latently infected neurons were transduced with either control non-targeting shRNA or shRNA targeting DLK for 3 days, then placed in tetrodotoxin (TTX; 1 μM) for 2 days and the TTX was then washed out. Reactivation was quantified at 3 days post-wash-out. Individual experimental replicates, the mean and SEMs are represented. Statistical comparisons were made using a one-way ANOVA with a Tukey’s multiple comparison. **p<0.01, ***p<0.001.
Figure 6.
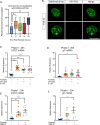
Figure 6.. IL-1β Treatment of sympathetic neurons results in changes consistent with heightened neuronal excitability.
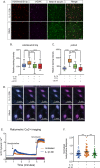
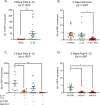
(A) Adult P36 SCG neurons were treated with IL-1β (30 ng/mL) for 15 hr and stained for H3K9me3/S10p, γH2AX and beta II-tubulin to mark neurons. (B and C) Quantification of the intensity of H3K9me3/S10p (B) and γH2AX (C) staining following 15 of IL-1β treatment and in the presence of tetrodotoxin (TTX; 1 μM) or anti-IL1 receptor (IL-1R) blocking antibody (2 μg/mL). Data are plotted around the median and whiskers represent the 5th-95th percentiles. (D) Representative images of cytosolic Ca2+ elevations measured using Fura-2-AM in neurons stimulated with 100 µM acetylcholine either pre-treated with IL-1β for 20 hr or mock treated. As a control the neurons were also treated with Ionomycin at the end of the protocol. Bar = 100 μm. (E) Representative experiment for cytosolic Ca2+ elevations in neurons stimulated with 100 µM acetylcholine. Cells were pretreated with IL-1β or vehicle for 20 hr prior to imaging. The plotted values were calculated as a change in fluorescence/initial fluorescence (ΔF/F0). Error bars represent SEM (IL-1β treatment, n = 58 cells and vehicle control, n = 25 cells). (F) Peak cytosolic Ca2+ elevations normalized to untreated controls in neurons stimulated with 100 µM acetylcholine. Cells were pretreated with IL-1β (n = 70, wells) or vehicle (n = 58, wells) for 20 hr prior to imaging. IL-1R blocking antibody (n = 54, wells) was also added. Data points represent individual wells, horizontal line represents mean. Statistical comparisons were made using a one-way ANOVA with a Tukey’s multiple comparison (B–D). ***p<0.001 ****p<0.0001.
Figure 6—figure supplement 1.
Figure 6—figure supplement 1.. IL-1β Treatment of mature scg neurons induces excitability-associated histone post-translational modifications (supplement to Figure 6).
Quantification of the nuclear staining intensity in P36 sympathetic neurons for H3K9me3/S10 (A) and γH2AX (B) following treatment with IL-1β (30 ng/mL) from 150 nuclei from two independent experiments. Data are plotted around the median and whiskers represent the 5th-95th percentile.
Figure 7.
Figure 7.. IL-1β-Induced HSV Reactivation is linked to heightened neuronal excitability and dlk activation.
(A) Quantification of Us11-GFP expressing neurons following addition of IL-1β to latently infected cultures of mature SCG neurons. (B) Numbers of Us11-GFP-positive neurons following addition of forskolin or IL-1β to mature SCG neurons, and in the presence of an IL-1R-blocking antibody (2 μg/mL). (C) Quantification of IL-1β induced reactivation in the presence of the voltage-gated sodium channel blocker TTX (1 μM), the HCN-channel blocker ZD 7288 (10 μM) and the DLK inhibitor GNE-3511 (4 μM). (D) Latently infected SCG neurons were transduced with an shRNA control lentivirus or lentiviruses expressing shRNA against DLK. Three days later IL-1β was added to the cultures and the numbers of GFP-positive neurons quantified at 3 days later. Individual experimental replicates, means and SEMs are represented. Statistical comparisons were made using two-tailed unpaired t-test (A) or a one-way ANOVA with a Tukey’s multiple comparison (B–D). *p<0.05, **p<0.01.

Similar articles

Cited by

References

    1. Aarreberg LD, Esser-Nobis K, Driscoll C, Shuvarikov A, Roby JA, Gale M. Interleukin-1β induces mtDNA release to activate innate immune signaling via cGAS-STING. Molecular Cell. 2019;74:801–815. doi: 10.1016/j.molcel.2019.02.038. - DOI - PMC - PubMed
    1. Alandijany T, Roberts APE, Conn KL, Loney C, McFarlane S, Orr A, Boutell C. Distinct temporal roles for the promyelocytic leukaemia (PML) protein in the sequential regulation of intracellular host immunity to HSV-1 infection. PLOS Pathogens. 2018;14:e1006769. doi: 10.1371/journal.ppat.1006769. - DOI - PMC - PubMed
    1. Alt FW, Schwer B. DNA double-strand breaks as drivers of neural genomic change, function, and disease. DNA Repair. 2018;71:158–163. doi: 10.1016/j.dnarep.2018.08.019. - DOI - PMC - PubMed
    1. Arvin A. Human Herpesviruses: Biology. Therapy, and Immunoprophylaxis. Cambridge: Cambridge University Press; 2007. - DOI - PubMed
    1. Benboudjema L, Mulvey M, Gao Y, Pimplikar SW, Mohr I. Association of the herpes simplex virus type 1 Us11 gene product with the cellular kinesin light-chain-related protein PAT1 results in the redistribution of both polypeptides. Journal of Virology. 2003;77:9192–9203. doi: 10.1128/JVI.77.17.9192-9203.2003. - DOI - PMC - PubMed

Publication types

Substances