. 2021 Jan 11;49(1):458-478.
doi: 10.1093/nar/gkaa1189.

The mTOR regulated RNA-binding protein LARP1 requires PABPC1 for guided mRNA interaction

Affiliations

The mTOR regulated RNA-binding protein LARP1 requires PABPC1 for guided mRNA interaction

Ewan M Smith et al. Nucleic Acids Res. .

Abstract

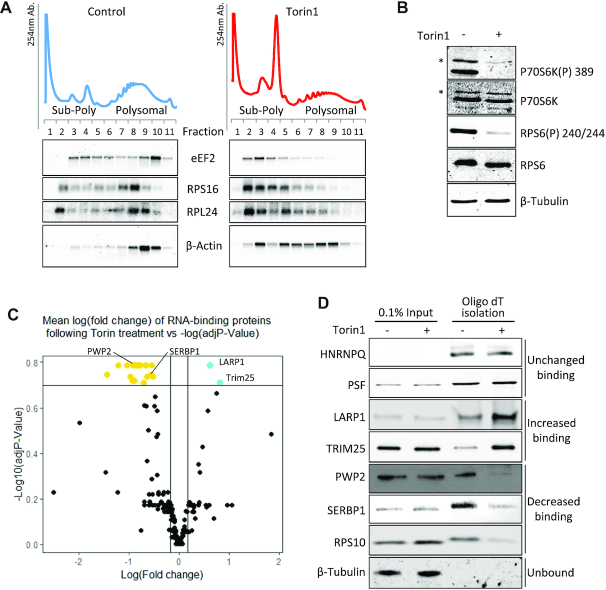
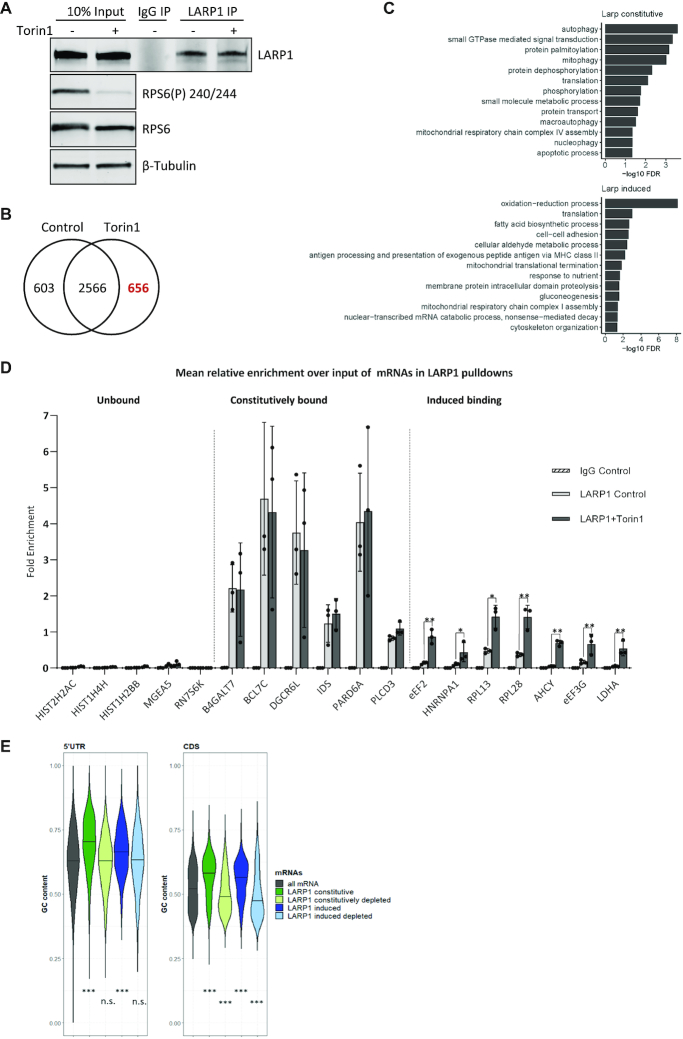
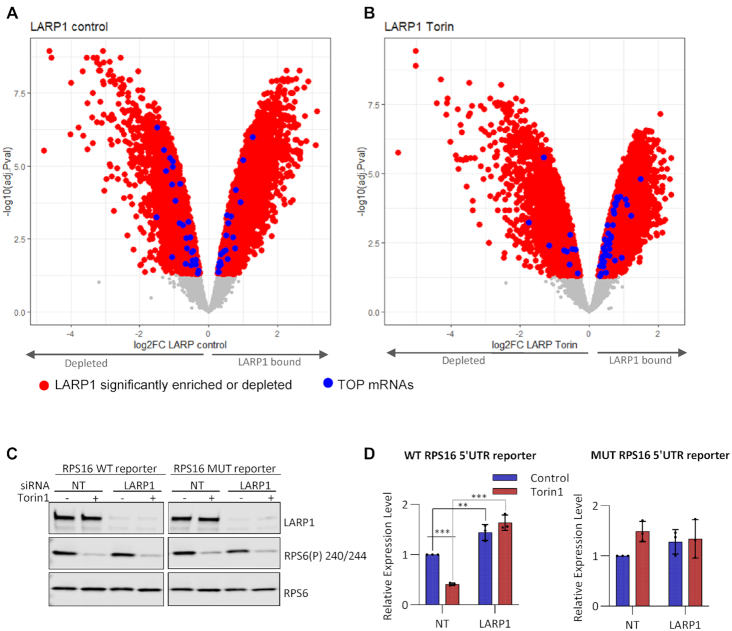
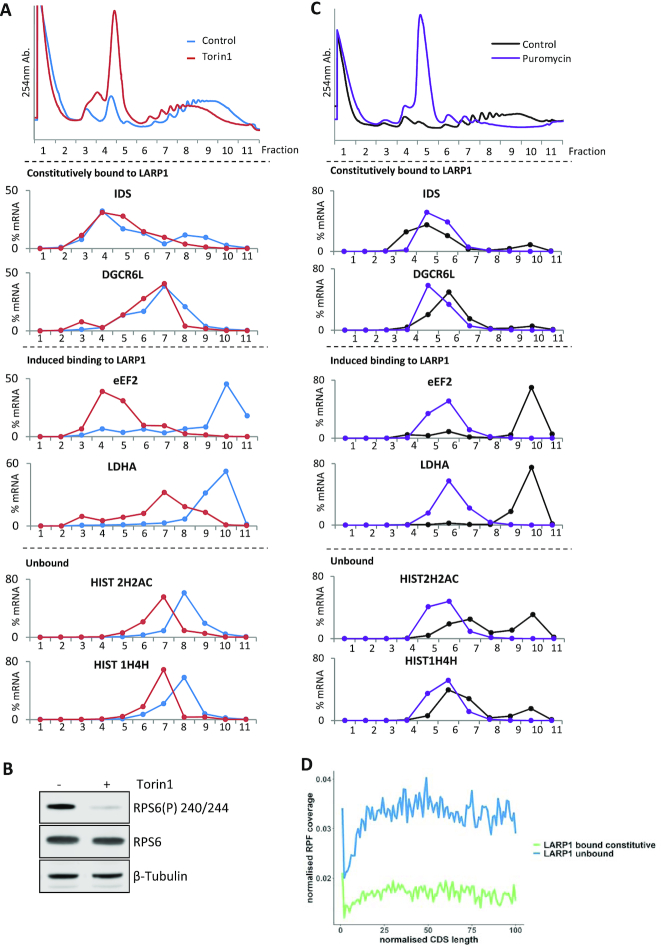
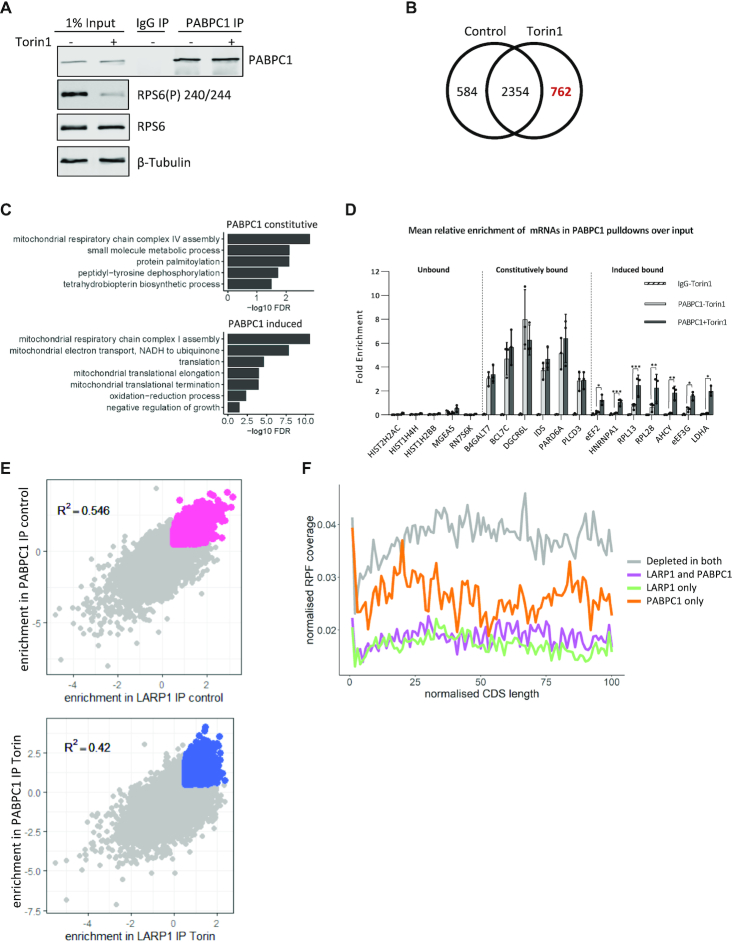
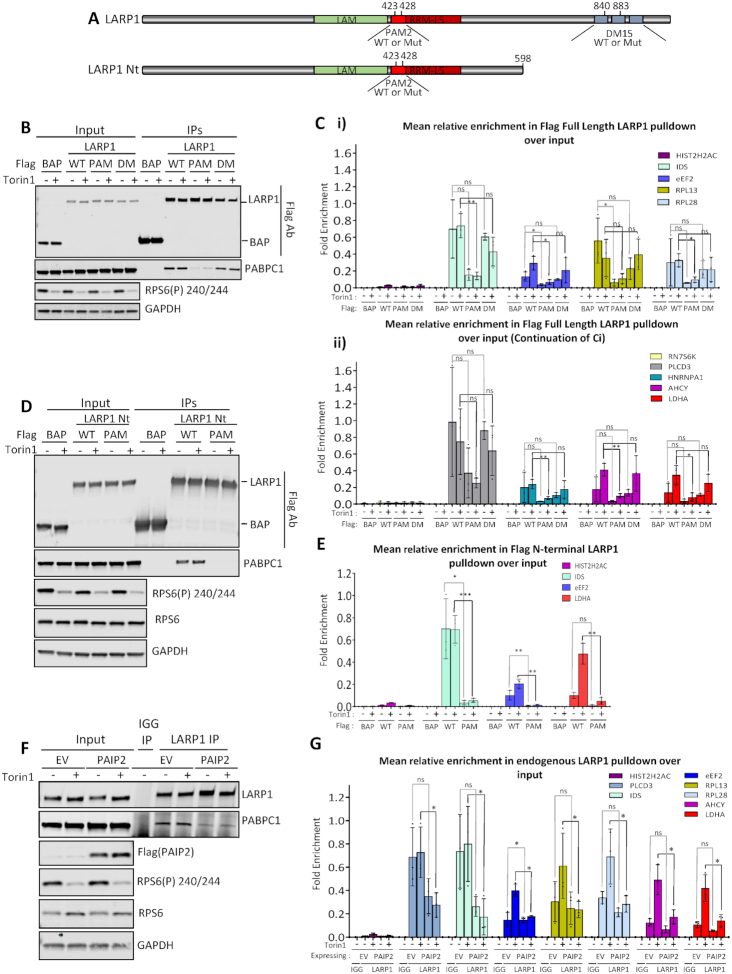
The mammalian target of rapamycin (mTOR) is a critical regulator of cell growth, integrating multiple signalling cues and pathways. Key among the downstream activities of mTOR is the control of the protein synthesis machinery. This is achieved, in part, via the co-ordinated regulation of mRNAs that contain a terminal oligopyrimidine tract (TOP) at their 5'ends, although the mechanisms by which this occurs downstream of mTOR signalling are still unclear. We used RNA-binding protein (RBP) capture to identify changes in the protein-RNA interaction landscape following mTOR inhibition. Upon mTOR inhibition, the binding of LARP1 to a number of mRNAs, including TOP-containing mRNAs, increased. Importantly, non-TOP-containing mRNAs bound by LARP1 are in a translationally-repressed state, even under control conditions. The mRNA interactome of the LARP1-associated protein PABPC1 was found to have a high degree of overlap with that of LARP1 and our data show that PABPC1 is required for the association of LARP1 with its specific mRNA targets. Finally, we demonstrate that mRNAs, including those encoding proteins critical for cell growth and survival, are translationally repressed when bound by both LARP1 and PABPC1.


Figures

Figure 1.
Figure 1.
Changes in RNA-binding proteins upon mTOR inactivation. (A–D) HeLa cells were treated with 200 nM Torin1 or DMSO as control. (A) Polysome profiling was performed and RNA from fractions was analysed by Northern blot. Representative UV traces from one of two independent experiments and corresponding blots from gradient fractions using probes against indicated RNAs are shown. B–D: Whole cell RNA-binding protein (RBP) capture using oligo(dT) affinity isolation. (B) Representative western blots of lysates from one of three experiments used for oligo(dT) pulldowns in C and D to show mTOR inactivation and equal loading using indicated antisera. Asterisks denote p85S6K. (C) Plot of mean fold change of proteins identified in control (DMSO carrier) versus Torin1 (mTOR inhibited) RBP capture (using TOP3 unique peptides for quantitation). Cut-offs shown on graph are log FC > 1.3, adjusted P-values <0.2 using Benjamini–Hochberg adjusted P-value. Following Torin1 treatment: gold = RBP decreasing binding; cyan = RBP increasing binding; black = no significant change in binding. Three independent experiments performed. (D) Validation of changes in RNA-binding proteins upon mTOR inactivation. Representative western blots of proteins changing their RNA binding following mTOR inhibition from independent oligo(dT) pulldowns n = 5.
Figure 2.
Figure 2.
mRNAs associated with LARP1 with and without mTOR inactivation. HeLa cells were serum stimulated followed by control or Torin1 treatment. Endogenous LARP1 immunoprecipitation was performed and beads split for analysis of RNA and proteins. (A–C) mRNA arrays were performed using RNA extracted from both input and LARP1 pulldowns in control and mTOR inhibited conditions. The experiment was performed four times independently. (A) Western blots of endogenous LARP1 immunoprecipitates and 10% input samples from one representative experiment using indicated antibodies. (B) Number of RNAs significantly enriched over input in LARP1 IPs (Control log FC > 0.5 & Torin1 log FC > 0.5). (C) Genes uniquely assigned to either the induced or constitutively bound groups were assessed for enrichment of gene ontology biological process (BP) terms using David functional annotation. The graphs present terms enriched with an FDR < 0.05. (D) qPCR validation of RNA enrichment over input using primers for indicated RNAs, expressed as mean relative enrichment in LARP1 pulldown over input. mRNAs defined as unbound, constitutively bound or induced bound to LARP1 as described in main text. Paired 2-tailed t test on the means of three independent experiments. (E) Analysis of the GC content of 5′UTR and CDS sequences of all RefSeq mRNAs and LARP1 bound mRNAs. The term constitutively depleted refers to mRNAs that are significantly depleted (LogFC > –0.5) in both control and mTOR inhibited conditions and ‘induced depleted’ refers to mRNAs that are unbound in control conditions (FDR > 0.05) and depleted (log FC < –0.5) in Torin1-treated conditions. Medians indicated by black lines and statistical significance calculated using Kruskal-Wallis followed by Dunn test.
Figure 3.
Figure 3.
LARP1 binding to terminal oligopyrimidine tract containing mRNAs increases after mTOR inactivation. Log fold enrichment over input of all LARP1 bound mRNAs following immunoprecipitation from (A) Control treated or (B) Torin1 treated HeLa cells. mRNAs significantly (FDR < 0.05) enriched (LARP1 bound) or depleted over input shown in red, of these, blue data points represent TOP containing mRNAs as listed in (5). Non-significantly enriched mRNAs are in grey. C and D: HeLa cells transfected at a final concentration of 20 nM control or LARP1 siRNA were subsequently transfected with RPS16- PEST-CL reporters and control pRL-SV40 vector (Promega E2231). After 24 h, cells were treated with Torin1 or DMSO (control) for 2h followed by lysis. Experiment performed three times. (C) Western blots were performed using indicated antibodies. Representative western blots shown from one experiment of three. (D) Luciferase assays were performed in duplicate for each of 3 triplicate wells. Relative luciferase activity was calculated as a ratio of firefly luciferase to renilla luciferase. These were then normalized to firefly RNA levels to determine luciferase protein expression changes. The means and individual data points of three independent experiments are plotted with error bars indicating SD. Non-RNA normalized data is shown in Supplementary Figure S6.
Figure 4.
Figure 4.
Polysome distribution of LARP1 bound mRNAs. HeLa cells supplemented with serum and then 200 nM Torin1 or DMSO vehicle control. (A-C) Sucrose density gradients were run and RNAs extracted from individual fractions. (A) Top panel: UV 254 traces of polysome gradients from control and Torin1 treated HeLa cell extracts. Lower panels: Percentage mRNA distribution across polysome gradients calculated from RT-qPCR. Data presented from one experiment representative of three independent experiments. (B) Western blots of input samples from A, for one of three independent experiments using indicated antibodies. (C) HeLa cells were treated with 200 μg/ml Puromycin for 1 h or 100 μg/ml cycloheximide for 3 min (Control). Sucrose gradients as in A. RNA was extracted from individual fractions and qPCR performed. Top panel: UV 254 traces of polysome gradients from control and puromycin treated HeLa cell extracts. Lower panels: Representative percentage mRNA distribution across polysome gradients calculated from RT-qPCR. (D) LARP1 constitutively bound mRNAs show reduced ribosome occupancy across the CDS. Graph shows RPF coverage normalized for mRNA abundance against normalized CDS length.
Figure 5.
Figure 5.
mRNAs associated with endogenous PABPC1 with/without mTOR inactivation and overlap with LARP1. (A–D) PABPC1 and control IgG immunoprecipitation from HeLa cells following mTOR inactivation. (A) Representative western blots of PABPC1 IP and input samples using indicated antibodies. (B) RNAs significantly enriched over input (log FC > 0.5) in PABPC1 IPs. Analysis performed as in Figure 2. (C) Genes uniquely assigned to either the induced following mTOR inhibition or constitutive group for PABPC1 were assessed for enrichment of gene ontology biological process (BP) terms using David functional annotation. The graphs present terms enriched with an FDR < 0.05. (D) QPCR validation of RNA binding to PABPC1 following mTOR inhibition. (E) Overlap of RNA enrichment over input in PABPC1 and LARP1 IPs from either control or Torin1 (mTOR inhibited) conditions. Pink and blue dots represent statistically significant enriched mRNAs in overlapped IPs from control or Torin1 conditions, respectively. Gray dots are non-significantly enriched mRNAs. R2 values displayed. (F) mRNAs bound by LARP1 or LARP1 & PABPC1 display decreased ribosome occupancy throughout the CDS. Groups used for this figure are listed in Supplementary Table S7.
Figure 6.
Figure 6.
Dissecting the functional domains of LARP1. (A) Schematic representation of the LARP1 constructs used in overexpression experiments. Amino acid numbering based on LARP1 Isoform 2 (Q6PKG0–3) B-C. Immunoprecipitation of transiently overexpressed Flag-tagged LARP1 2–1019: wild type (WT); PAM2 L423A/F428A double point mutant (PAM); DM15 R840E/Y883A double point mutant (DM) or flag tagged bacterial alkaline phosphatase (BAP) control protein from HeLa cells treated with or without Torin1. (B) Western blots of Flag tagged protein overexpression in 10% inputs and immunoprecipitations from one representative experiment of three. (C) (i) and (ii). Mean relative enrichment from qPCR analysis as mean relative enrichment in Flag pulldowns over input with data points from three individual experiments plotted. D-E. HeLa cells were transiently transfected with either: Flag tagged wild type LARP1 N-terminus (‘WT LARP1 Nt’ -amino acids 2–598) wild type (WT); LARP1 N-terminus PAM2 L423A/F428A double point mutant (PAM) or bacterial alkaline phosphatase (BAP) flag tagged control protein. Cells were treated plus or minus mTOR inhibition using Torin1 and flag immunoprecipitations performed. (D) Western blots of Flag tagged LARP1 N-terminal (Nt) (2–598) truncation overexpression in 10% inputs and immunoprecipitations using indicated antisera. Blots are from one representative experiment, N = 3. (E) Mean relative enrichment from qPCR as in C. (F and G) HeLa cells were transiently transfected with empty vector or PAIP2 and left for 24h. Endogenous LARP1 immunoprecipitations were then performed from control or 200 nM Torin1 treated cells. (F) Westerns blots showing mTOR inhibition and overexpression of PAIP2 and the resulting reduced capacity of PABPC1 to bind to LARP1 using indicated antibodies. Western blots from one representative experiment, N = 3. (G) qPCR enrichment analysis of LARP1 bound mRNAs in the absence and presence of PAIP2 overexpression as in (C).

Similar articles

Cited by

References

    1. Loewith R., Jacinto E., Wullschleger S., Lorberg A., Crespo J.L., Bonenfant D., Oppliger W., Jenoe P., Hall M.N.. Two TOR complexes, only one of which is rapamycin sensitive, have distinct roles in cell growth control. Mol. Cell. 2002; 10:457–468. - PubMed
    1. Kim D.H., Sarbassov D.D., Ali S.M., Latek R.R., Guntur K.V., Erdjument-Bromage H., Tempst P., Sabatini D.M.. GbetaL, a positive regulator of the rapamycin-sensitive pathway required for the nutrient-sensitive interaction between raptor and mTOR. Mol. Cell. 2003; 11:895–904. - PubMed
    1. Peterson T.R., Laplante M., Thoreen C.C., Sancak Y., Kang S.A., Kuehl W.M., Gray N.S., Sabatini D.M.. DEPTOR is an mTOR inhibitor frequently overexpressed in multiple myeloma cells and required for their survival. Cell. 2009; 137:873–886. - PMC - PubMed
    1. Sarbassov D.D., Ali S.M., Kim D.H., Guertin D.A., Latek R.R., Erdjument-Bromage H., Tempst P., Sabatini D.M.. Rictor, a novel binding partner of mTOR, defines a rapamycin-insensitive and raptor-independent pathway that regulates the cytoskeleton. Curr. Biol. 2004; 14:1296–1302. - PubMed
    1. Frias M.A., Thoreen C.C., Jaffe J.D., Schroder W., Sculley T., Carr S.A., Sabatini D.M.. mSin1 is necessary for Akt/PKB phosphorylation, and its isoforms define three distinct mTORC2s. Curr. Biol. 2006; 16:1865–1870. - PubMed

Publication types

MeSH terms

Substances