Global Burden of Cardiovascular Diseases and Risk Factors, 1990-2019: Update From the GBD 2019 Study
- PMID: 33309175
- PMCID: PMC7755038
- DOI: 10.1016/j.jacc.2020.11.010
Global Burden of Cardiovascular Diseases and Risk Factors, 1990-2019: Update From the GBD 2019 Study
Erratum in
-
Correction.J Am Coll Cardiol. 2021 Apr 20;77(15):1958-1959. doi: 10.1016/j.jacc.2021.02.039. J Am Coll Cardiol. 2021. PMID: 33858636 Free PMC article. No abstract available.
Abstract
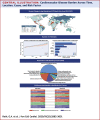
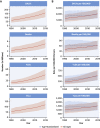
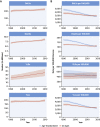
Cardiovascular diseases (CVDs), principally ischemic heart disease (IHD) and stroke, are the leading cause of global mortality and a major contributor to disability. This paper reviews the magnitude of total CVD burden, including 13 underlying causes of cardiovascular death and 9 related risk factors, using estimates from the Global Burden of Disease (GBD) Study 2019. GBD, an ongoing multinational collaboration to provide comparable and consistent estimates of population health over time, used all available population-level data sources on incidence, prevalence, case fatality, mortality, and health risks to produce estimates for 204 countries and territories from 1990 to 2019. Prevalent cases of total CVD nearly doubled from 271 million (95% uncertainty interval [UI]: 257 to 285 million) in 1990 to 523 million (95% UI: 497 to 550 million) in 2019, and the number of CVD deaths steadily increased from 12.1 million (95% UI:11.4 to 12.6 million) in 1990, reaching 18.6 million (95% UI: 17.1 to 19.7 million) in 2019. The global trends for disability-adjusted life years (DALYs) and years of life lost also increased significantly, and years lived with disability doubled from 17.7 million (95% UI: 12.9 to 22.5 million) to 34.4 million (95% UI:24.9 to 43.6 million) over that period. The total number of DALYs due to IHD has risen steadily since 1990, reaching 182 million (95% UI: 170 to 194 million) DALYs, 9.14 million (95% UI: 8.40 to 9.74 million) deaths in the year 2019, and 197 million (95% UI: 178 to 220 million) prevalent cases of IHD in 2019. The total number of DALYs due to stroke has risen steadily since 1990, reaching 143 million (95% UI: 133 to 153 million) DALYs, 6.55 million (95% UI: 6.00 to 7.02 million) deaths in the year 2019, and 101 million (95% UI: 93.2 to 111 million) prevalent cases of stroke in 2019. Cardiovascular diseases remain the leading cause of disease burden in the world. CVD burden continues its decades-long rise for almost all countries outside high-income countries, and alarmingly, the age-standardized rate of CVD has begun to rise in some locations where it was previously declining in high-income countries. There is an urgent need to focus on implementing existing cost-effective policies and interventions if the world is to meet the targets for Sustainable Development Goal 3 and achieve a 30% reduction in premature mortality due to noncommunicable diseases.
Keywords: cardiovascular diseases; global health; health policy; population health.
Copyright © 2020 The Authors. Published by Elsevier Inc. All rights reserved.
Conflict of interest statement
Author Disclosures This study was funded by the Bill and Melinda Gates Foundation. Dr. Benjamin has received funding from the National Institutes of Health (NIH)/National Heart, Lung, and Blood Institute (NHLBI) (R01HL092577, 1R01HL128914) and American Heart Association (18SFRN34110082). Dr. Brauer has received a grant from the Bill and Melinda Gates Foundation. Dr. Catapano has received support from Fondazione Cariplo 2015-0524 and 2015-0564, H2020 REPROGRAM PHC-03-2015/667837-2, ERA NET ER-2017-2364981, GR-2011-02346974, Ministry of Health - Ricerca Corrente Multimedica; has received research grant/support from Sanofi, Sanofi Regeneron, Amgen, Mylan, Menarini, and Eli Lilly; has served on the speakers bureau for Akcea, Amgen, Sanofi, Esperion, Kowa, Novartis, Ionis Pharmaceuticals, Mylan, Menarini, Merck, Recordati, Regeneron, Daiichi-Sankyo, AstraZeneca, Aegerion, Amryt, and Sandoz; has received honoraria from Akcea, Amgen, Sanofi, Esperion, Kowa, Novartis, Ionis Pharmaceuticals, Mylan, Menarini, Merck, Recordati, Regeneron Daiichi-Sankyo, AstraZeneca, Aegerion, Amryt, and Sandoz; and has served as a consultant/on the Advisory Board for Akcea, Amgen, Sanofi, Esperion, Kowa, Novartis, Ionis Pharmaceuticals, Mylan, Menarini, Merck, Recordati, Regeneron Daiichi-Sankyo, Genzyme, Aegerion, and Sandoz. Dr. Coresh has received funding from the NIH and National Kidney Foundation; and has served as an advisor to Healthy.io. Dr. Fowkes has served on the Advisory Board for AstraZeneca. Dr. Muntner has received grants and personal fees from Amgen Inc. Dr. Ribeiro has received partial support by CNPq (310679/2016-8 and 465518/2014-1) and by FAPEMIG (PPM-00428-17). Dr. Zuhlke has received funding by the UK Medical Research Council (MRC) and the UK Department for International Development (DFID) under the MRC/DFID Concordat agreement and the National Research Foundation of South Africa. Dr. Rigotti has served as a consultant to Achieve Life Sciences; and has received royalties from UpToDate, Inc. Dr. Rodgers is employed by The George Institute for Global Health (TGI) and seconded part time to George Medicines Pty Ltd (GM); TGI has submitted patent applications with respect to low-fixed-dose combination products for the treatment of cardiovascular or cardiometabolic disease and is listed as one of the inventors; George Health Enterprises Pty. Ltd. (GHE) and its subsidiary, GM, have received investment funds to develop fixed-dose combination products, including combinations of blood pressure-lowering drugs; GHE is the social enterprise arm of TGI (Dr. Rodgers does not have a direct financial interest in these patent applications or investments). Dr. Sundström holds ownership in companies providing services to Itrim, Amgen, Janssen, Novo Nordisk, Eli Lilly, Boehringer Ingelheim, Bayer, Pfizer, and AstraZeneca, outside the submitted work. All other authors have reported that they have no relationships relevant to the contents of this paper to disclose.
Figures


Similar articles
-
National disability-adjusted life years (DALYs) for 257 diseases and injuries in Ethiopia, 1990-2015: findings from the global burden of disease study 2015.Popul Health Metr. 2017 Jul 21;15(1):28. doi: 10.1186/s12963-017-0146-0. Popul Health Metr. 2017. PMID: 28732542 Free PMC article.
-
Cancer Incidence, Mortality, Years of Life Lost, Years Lived With Disability, and Disability-Adjusted Life Years for 29 Cancer Groups From 2010 to 2019: A Systematic Analysis for the Global Burden of Disease Study 2019.JAMA Oncol. 2022 Mar 1;8(3):420-444. doi: 10.1001/jamaoncol.2021.6987. JAMA Oncol. 2022. PMID: 34967848 Free PMC article.
-
Burden of Neurological Disorders Across the US From 1990-2017: A Global Burden of Disease Study.JAMA Neurol. 2021 Feb 1;78(2):165-176. doi: 10.1001/jamaneurol.2020.4152. JAMA Neurol. 2021. PMID: 33136137 Free PMC article.
-
World Health Organization Estimates of the Global and Regional Disease Burden of 22 Foodborne Bacterial, Protozoal, and Viral Diseases, 2010: A Data Synthesis.PLoS Med. 2015 Dec 3;12(12):e1001921. doi: 10.1371/journal.pmed.1001921. eCollection 2015 Dec. PLoS Med. 2015. PMID: 26633831 Free PMC article. Review.
-
Global and regional burden of stroke during 1990-2010: findings from the Global Burden of Disease Study 2010.Lancet. 2014 Jan 18;383(9913):245-54. doi: 10.1016/s0140-6736(13)61953-4. Lancet. 2014. PMID: 24449944 Free PMC article. Review.
Cited by
-
Myocardial ischemia-reperfusion injury upregulates nucleostemin expression via HIF-1α and c-Jun pathways and alleviates apoptosis by promoting autophagy.Cell Death Discov. 2024 Oct 30;10(1):461. doi: 10.1038/s41420-024-02221-x. Cell Death Discov. 2024. PMID: 39477962 Free PMC article.
-
Mediating Role of Glucose-Lipid Metabolism in the Association between the Increased Risk of Coronary Heart Disease and Exposure to Organophosphate Esters, Phthalates, and Polycyclic Aromatic Hydrocarbons.Environ Health (Wash). 2024 Feb 5;2(3):170-179. doi: 10.1021/envhealth.3c00155. eCollection 2024 Mar 15. Environ Health (Wash). 2024. PMID: 39473817 Free PMC article.
-
Association of estimated glucose disposal rate with incident cardiovascular disease under different metabolic and circadian rhythm states: findings from a national population-based prospective cohort study.Diabetol Metab Syndr. 2024 Oct 30;16(1):257. doi: 10.1186/s13098-024-01494-7. Diabetol Metab Syndr. 2024. PMID: 39472994 Free PMC article.
-
Cost-effectiveness of Evolocumab in Cardiovascular Disease: A Systematic Review.Curr Ther Res Clin Exp. 2024 Sep 1;101:100758. doi: 10.1016/j.curtheres.2024.100758. eCollection 2024. Curr Ther Res Clin Exp. 2024. PMID: 39469092 Free PMC article. Review.
-
Coaching People with Cardiovascular Disease to Close Their "Treatment Gaps" Reduces Hospital Utilization, Saves Lives, and Delivers Net Cost Savings Over 10 Years.Am J Med Open. 2024 Aug 16;12:100075. doi: 10.1016/j.ajmo.2024.100075. eCollection 2024 Dec. Am J Med Open. 2024. PMID: 39469059 Free PMC article.
References
-
- Mensah G.A., Roth G.A., Fuster V. The global burden of cardiovascular diseases and risk factors: 2020 and beyond. J Am Coll Cardiol. 2019;74:2529–2532. - PubMed
-
- GBD Compare. https://vizhub.healthdata.org/gbd-compare/ Available at:
Publication types
MeSH terms
Grants and funding
- R01 HL128914/HL/NHLBI NIH HHS/United States
- T32 HL007828/HL/NHLBI NIH HHS/United States
- MR/S005242/1/MRC_/Medical Research Council/United Kingdom
- P30 DK079626/DK/NIDDK NIH HHS/United States
- K23 HL140133/HL/NHLBI NIH HHS/United States
- MR/R024227/1/MRC_/Medical Research Council/United Kingdom
- U54 HG007479/HG/NHGRI NIH HHS/United States
- R01 NS115944/NS/NINDS NIH HHS/United States
- R01 NS107900/NS/NINDS NIH HHS/United States
- MR/M015084/1/MRC_/Medical Research Council/United Kingdom
- MR/S011676/1/MRC_/Medical Research Council/United Kingdom
- R01 HL092577/HL/NHLBI NIH HHS/United States

