. 2021 Jan 21;184(2):460-475.e21.
doi: 10.1016/j.cell.2020.11.007. Epub 2020 Nov 10.

Baricitinib treatment resolves lower-airway macrophage inflammation and neutrophil recruitment in SARS-CoV-2-infected rhesus macaques

Affiliations

Baricitinib treatment resolves lower-airway macrophage inflammation and neutrophil recruitment in SARS-CoV-2-infected rhesus macaques

Timothy N Hoang et al. Cell. .

Abstract

SARS-CoV-2-induced hypercytokinemia and inflammation are critically associated with COVID-19 severity. Baricitinib, a clinically approved JAK1/JAK2 inhibitor, is currently being investigated in COVID-19 clinical trials. Here, we investigated the immunologic and virologic efficacy of baricitinib in a rhesus macaque model of SARS-CoV-2 infection. Viral shedding measured from nasal and throat swabs, bronchoalveolar lavages, and tissues was not reduced with baricitinib. Type I interferon (IFN) antiviral responses and SARS-CoV-2-specific T cell responses remained similar between the two groups. Animals treated with baricitinib showed reduced inflammation, decreased lung infiltration of inflammatory cells, reduced NETosis activity, and more limited lung pathology. Importantly, baricitinib-treated animals had a rapid and remarkably potent suppression of lung macrophage production of cytokines and chemokines responsible for inflammation and neutrophil recruitment. These data support a beneficial role for, and elucidate the immunological mechanisms underlying, the use of baricitinib as a frontline treatment for inflammation induced by SARS-CoV-2 infection.

Keywords: COVID-19; SARS-CoV-2; baricitinib; immune activation; immunology; inflammation; nonhuman primate; pathogenesis.


Conflict of interest statement

Declaration of interests R.F.S. served as an unpaid consultant for Eli Lilly whose drugs are being evaluated in the research described in this paper. In addition, R.F.S. owns shares in Eli Lilly. The terms of this arrangement have been reviewed and approved by Emory University in accordance with its conflict of interest policies. Eli Lilly had no role in the design of this study and did not have any role during its execution, analyses, interpretation of the data, or decision to submit results. All other authors do not have any conflicts to declare.

Figures

None
Graphical abstract
Figure 1
Figure 1
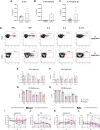
Baricitinib is detectable in plasma and tissues from SARS-CoV-2-infected RMs but has no impact on viral kinetics (A) Study design; 8 RMs were infected intranasally and intratracheally with SARS-CoV-2, and at 2 days after infection, 4 RMs began daily baricitinib administration (4 mg). Longitudinal collections performed are indicated in circles. (B and C) Concentration of baricitinib 24 h after dosing in plasma (6 days after infection closed symbol; 8 days after infection open symbol) (B) and at necropsy in upper and lower lungs of baricitinib-treated SARS-CoV-2-infected RMs (C). (D and E) Daily cage-side assessment and physical examination scores (D) and changes in body weight from baseline (E) in baricitinib-treated (blue symbols; n = 4) and untreated (red symbols; n = 4) SARS-CoV-2-infected RMs. (F) Longitudinal pulse oximetry readings. (G–J) After SARS-CoV-2 inoculation, nasal, throat, bronchoalveolar lavages (BALs), and rectal swabs were collected, and viral loads were quantified by qRT-PCR. (K) Viral loads in tissues measured at necropsy (10–11 days after infection). Abbreviation is as follows: Ct, cycle threshold. Different symbols represent individual RMs. Thick lines represent the average of the baricitinib-treated (blue lines) and untreated (red lines) groups. Bars in (B), (C), and (K) represent the average of the treated and untreated groups. Statistical analysis was performed using a non-parametric Mann-Whitney test. See also Figures S1 and S2A and Tables S1, S2, and S3.
Figure S1
Figure S1
Baricitinib was well-tolerated and detectable in the central nervous system in SARS-CoV-2-infected RMs, related to Figure 1 (A) Left, concentration of baricitinib 2 hours after dosing in brain and CSF and, right, 24 hours after dosing in CSF. (B–D) Longitudinal frequency of (B) monocytes, (C) neutrophils, and (D) lymphocytes in blood of SARS-CoV-2 infected RMs. (E–H) In (E), red blood cell counts (RBC), (F) hematocrit (HCT), (G) hemoglobin (HGB) and (H) alkaline phosphatase (ALP) levels were analyzed throughout the study. (I) Longitudinal rectal temperatures. Different symbols represent individual animals. Bold lines represent the average of the baricitinib treated group (blue), and the untreated group (red).
Figure S2
Figure S2
Baricitinib reduced lung neutrophil and macrophage infiltration, preserved IFN responses but did not reduce SARS-CoV-2 replication in RMs, related to Figures 1 and 2 (A–I) In (A), representative images of in situ RNA hybridization (RNAscope) targeting viral RNA strands identifying clusters of infected cells within the lung parenchyma in both treated and untreated SARS-CoV-2 infected RMs. Scale bars: 100 um. Representative immunohistochemistry (IHC) images of (B) neutrophils (myeloperoxidase+, MPO, cells) (D) macrophages (ionized calcium-binding adaptor molecule 1+, Iba-1, cells), (F) proliferating (Ki-67), and (H) Interferon-induced GTP-binding protein+ (Mx1), cells in lungs of baricitinib treated and untreated SARS-CoV-2 infected RMs, and uninfected RMs. Scale bars 500 μm. Quantification of (C) neutrophils (MPO+ positive cells/mm2), (E) macrophages (lba-1+ cells/mm2), (G) proliferating (Ki-67+), and (I) Interferon-induced protein Mx1 (% area total lung Mx1+) in IHC lung images of baricitinib treated, and untreated controls of SARS-CoV-2 infected RMs, and uninfected RMs.
Figure 2
Figure 2
Reduced respiratory disease and lower levels of lung pathology in baricitinib-treated RMs (A) Representative ventrodorsal radiograph of an untreated RM before SARS-CoV-2 infection (5 days before infection), and at 4, and 7 days after infection. Red squares indicate regions of pulmonary infiltrates and opacity. (B and C) Daily (B) and cumulative (C) radiograph scores; ventrodorsal and lateral radiographs were scored for the presence of pulmonary infiltration by a clinical radiologist according to a standard scoring system (0: normal; 1: mild interstitial pulmonary infiltrates; 2: moderate pulmonary infiltrates with partial cardiac border effacement and small areas of pulmonary consolidation; 3: severe interstitial infiltrates, large areas of pulmonary consolidation, alveolar patterns, and air bronchograms). (D and E) Fold change to 2 days after infection for ferritin (D) and C-reactive protein (CRP) levels (E). (F and G) Panel (F) shows 100× magnification, and (G) shows 200× magnification (zoomed in from F), representative lung lesions in an untreated SARS-Cov-2-infected RM with focally extensive interstitial pneumonia, type 2 pneumocytes hyperplasia, alveolar septal thickening, syncytia formation (arrow), neutrophils, and macrophages infiltrations (arrowhead). (H) 200× magnification, Thyroid Transcription Factor-1 (TTF-1) staining with prominent type 2 pneumocyte hyperplasia (brown) in a control SARS-CoV-2-infected RM. (I and J) Panel (I) shows 100× magnification, and (J) shows 200× magnification (zoomed in from I), treatment effects of baricitinib in SARS-CoV-2-infected RMs with a reduction in pulmonary lesions, lesser inflammatory infiltrates (arrowhead), and reduced type 2 pneumocyte hyperplasia. (K) 200× magnification, TTF-1 staining with lesser type 2 pneumocyte hyperplasia (brown) after baricitinib treatment. (L) Average pathology score per lobe. (M) Total pathology score. (N) Pathology scores for individual parameters. Scale bar, (F) and (I): 100 μM; (G), (H), (J), and (K): 50 μM. Bars in (D), (E), (L), (M), and (N) indicate mean values for baricitinib-treated (blue) and untreated (red) SARS-CoV-2-infected RMs. Each symbol represents individual animals. Statistical analysis in (D), (E), and (L)–(N) were performed using non-parametric Mann-Whitney test. Statistical analyses were performed two-sided with p ≤ 0.05 deemed significant. Ranges of significance were graphically annotated as follows: p < 0.05. See also Figures S2B–S2I.
Figure 3
Figure 3
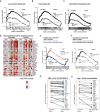
Baricitinib treatment suppresses gene expression of inflammation and neutrophil degranulation in the BALs of SARS-CoV-2-infected RMs Bulk RNA-seq profiles of BAL cell suspensions from RMs obtained at day −5 prior to SARS-CoV-2 inoculation (baseline), at 2 days after infection, prior to baricitinib treatment, and at 4 days after infection, 2 days after initiation of baricitinib. (A) Venn diagrams indicating the number of differential expression genes (DEGs) detected at 2 or 4 days after infection relative to −5 days after infection in the untreated (red) and baricitinib-treated (blue) groups. The total DEGs for each comparison are shown in parentheses. (B) Bar plots showing enrichment of top scoring inflammatory and immunological gene signatures from the MSIGDB (Hallmark and Canonical Pathways) and databases, and custom gene sets (interferon-stimulated genes [ISGs]; see below) ranked by GSEA comparisons of gene expression in the 4 days after infection versus 2 days after infection samples from the untreated (red bars) and baricitinib-treated (blue bars) groups. The x axis depicts the normalized enrichment score (NES); a positive enrichment score indicated higher expression at 4 days after infection relative to 2 days after infection (bars facing right); conversely, negative scores of a pathway indicate cumulatively higher expression in 2 days after infection samples relative to 4 days after infection (bars facing left). Nominal p values are indicated. (C–F) GSEA enrichment plots depicting pairwise comparison of gene expression of 2 days after infection versus 4 days after infection samples for the untreated group and for the baricitinib-treated group. The top-scoring (i.e., leading edge) genes are indicated by solid dots. The hash plot under GSEA curves indicates individual genes and their rank in the dataset. Left-leaning curves (i.e., positive enrichment scores) indicate higher expression of pathways at 4 days after infection; right-leaning curves (negative enrichment scores) indicate higher expression at 2 days after infection. Sigmoidal curves indicate equivalent expression between the groups being compared. The NES and nominal p values testing the significance of each comparison are indicated. (C) REACTOME_ NEUTROPHIL_DEGRANULATION (MSIDB #M27620). (D) GSEA line plot of HALLMARK_TNFA_SIGNALING_VIA_NFKB pathway (MSIGDB #M5890). (E) GSEA line plot of HALLMARK_IL6_JAK_STAT3_SIGNALING (MSIGDB #M5897). (F) A custom gene set of ISGs from prior NHP studies (Nganou-Makamdop et al., 2018; Palesch et al., 2018; Sandler et al., 2014). (G–J) Heatmaps of top-scoring (i.e., leading edge) from the untreated 4 days after infection versus 2 days after infection GSEA analyses. The color scale indicates the log2 expression relative to the median of all baseline samples. See also Figure S3.
Figure S3
Figure S3
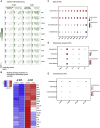
Baricitinib Suppressed the expression of inflammatory mediators and neutrophil degranulation genes in BALs from SARS-CoV-2-infected RMs, related to Figure 3 Cross-sectional GSEA analysis comparing 4 days after infection untreated versus 4 days after infection baricitinib treated, or 2 days after infection untreated versus 2 days after infection baricitinib treated in bulk BAL from SARS-CoV-2 infected RMs. (A–C) GSEA comparisons of 4 days after infection untreated versus 4 days after infection baricitinib treated are shown as black symbols, and comparisons of or 2 days after infection untreated versus 2 days after infection baricitinib treated are shown as gray symbols. (A) GSEA enrichment plots for the GSEA line plot of HALLMARK_IL6_JAK_STAT3_SIGNALING pathway (MSIGDB #M5897). (B) GSEA line plot of HALLMARK_TNFA_SIGNALING_VIA_NFKB pathway (MSIGDB #M5890). (C) GSEA line plot of REACTOME NEUTROPHIL DEGRANULATION gene set (REACTOME #M27620). (D) Heatmap of leading edge genes for REACTOME NEUTROPHIL DEGRANULATION gene set based on untreated 4 days after infection versus baseline contrast. The log2 expression and the reference is the median of all baseline samples as indicated at right. The top 35 genes are shown in order of GSEA analysis of the cross-sectional 4 days after infection comparison. (E and F) GSEA analysis for KEGG Rheumatoid Arthritis gene set (E) GSEA contrasting 4 days after infection versus 2 days after infection for untreated and treated arms. GSEA curves are colored by experimental arm. Leading edge genes are indicated by solid dots. The hash plot under GSEA curves indicate individual genes and their rank in the dataset. Left-leaning curves (i.e., positive enrichment scores) indicate enrichment at 4 days after infection, right-leaning curves (negative enrichment scores) indicate higher enrichment at 2 days after infection, and sigmoidal curves indicate a lack of enrichment, i.e., equivalent expression between the groups being compared. The normalized enrichment scores and nominal p values testing the significance of each comparison are indicated. (F) GSEA comparisons of 4 days after infection untreated versus 4 days after infection baricitinib treated samples (black symbols); comparisons of 2 days after infection untreated versus 2 days after infection baricitinib treated samples (gray symbols). (G) plot showing log10 average normalized counts obtained from DESeq2 for leading edge genes at 2 days after infection in untreated and treated samples, and (H) at 4 days after infection.
Figure 4
Figure 4
Baricitinib treatment abolishes inflammatory cytokine and neutrophil chemoattractant expression in bronchoalveolar macrophages Single-cell suspensions from BALs of SARS-CoV-2-infected RMs were subject to 10× Genomics capture and sequencing. (A) UMAP showing major cell types in BAL samples (n = 10 samples; untreated, baseline n = 3; untreated, 4 days after infection n = 3; treated, baseline n = 2; treated, 4 days after infection n=2). (B) UMAP showing clusters in BAL samples by treatment days (n = 10). (C) UMAP projection of pro-inflammatory cytokines in macrophages. (D) UMAP projection of neutrophil chemoattractant and pro-inflammatory chemokines. (E and F) Expression of chemokines and interferon-stimulated genes (ISGs) in treated and untreated samples at baseline and 4 days after infection. The colored expression scale of expression in UMAPs is depicted on a per gene basis: the scale represents the per cell reads for each gene divided by the total reads for of that cell, scaled to the factor shown and natural log-transformed. See also Figures S4 and S5.
Figure S4
Figure S4
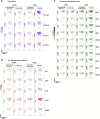
Baricitinib inhibited the expression of inflammatory and macrophage/neutrophil chemokine genes while preserving ISGs in lung macrophages from SARS-CoV-2-infected RMs, related to Figure 4 (A) Expression as UMAP projection of interferon stimulated genes (ISGs) in macrophages for treated and untreated samples at baseline and 4 days after infection. (B) Heatmap showing average expression of genes of interest in macrophages for treated and untreated samples at baseline and 4 days after infection. (C–E) Dot plots representing gene expression levels and percentage of cells expressing genes associated with inflammation, chemokine response and interferon stimulation
Figure S5
Figure S5
Baricitinib reduced the expression of inflammatory and chemokine gGenes while maintaining ISGs in BALs from SARS-CoV-2-infected RMs, related to Figure 4 (A–C) Expression as UMAP projection of inflammation, chemokine and interferon stimulated genes (ISGs) across major cell types in BAL for treated and untreated samples at baseline and 4 days after infection.
Figure 5
Figure 5
Baricitinib-treated RMs have decreased infiltration of innate immune cells and lowered neutrophil NETosis (A) UMAP analysis of BALs in baricitinib-treated (n = 4) and untreated (n = 4) SARS-CoV-2-infected RMs before infection (D −5 PI; baseline), and at 4 and 10 days after infection. (B) Longitudinal levels of neutrophils within BAL samples depicted as a percentage of CD45+ cells (C) Fold change to 2 days after infection of neutrophils in blood of baricitinib-treated and untreated SARS-CoV-2-infected RMs. (D) Longitudinal levels of CD14+CD16 monocytes within BAL samples depicted as a percentage of CD45+ cells. (E) Representative microscopy images of NETS by Sytox green assay in baricitinib-treated and untreated SARS-CoV-2-infected RMs. Scale bar, 200 μm. (F) Quantification of NETosis activity upon staining extracellular DNA with Sytox in isolated stimulated neutrophils from blood. Fold change of Sytox levels to −5 days after infection. (G) Quantification of citrullinated H3 in plasma. (H) Staining of citrullinated H3 in lungs at 10–11 days after infection. In (B)–(D), (F), and (G), each symbol represents individual animals. Thick lines represent the average of the baricitinib-treated (blue line) and untreated groups (red line). Bars in (C) and (F) represent the average of the treated and untreated groups. Statistical analysis in (B), (C), (F), and (G) was performed using a non-parametric Mann-Whitney test. Statistical analyses were performed two-sided with p ≤ 0.05 deemed significant. Ranges of significance were graphically annotated as follows: p < 0.05. See also Figures S6A and S6B.
Figure S6
Figure S6
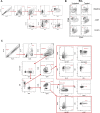
Flow cytometry gating strategy for innate and adaptive cells, related to Figures 5 and 6 Representative gating strategy of (A) neutrophils, (B) neutrophil infiltration in BAL at baseline, and 4 and 10 days after infection, and (C) T cell populations analyzed in the study.
Figure 6
Figure 6
Decreased levels of T cell proliferation and activation in baricitinib-treated RMs (A and B) Longitudinal levels of (A) circulating CD4+ T cells and (B) CD4+ TReg (CD45+CD3+CD4+ CD95+ CD127 CD25+ FoxP3+; representative staining in Figure S6C) cells measured by flow cytometry of baricitinib-treated (blue) and untreated (red) SARS-CoV-2-infected RMs. (C) Fold changes to 2 days after infection of circulating CD4+ TReg cells. (D and E) Levels of circulating CD8+ T cells (D) and proliferating (Ki-67+) memory CD8+ T cells (E). (F and G) Levels of CD4+ T cells (F) and HLA-DRCD38+ memory CD4+ T cells (G) in bronchoalveolar lavages (BALs) measured by flow cytometry. (H–J) Levels of CD8+ T cells (H), proliferating (Ki-67+) memory CD8+ T cells (I), and HLA-DRCD38+ memory CD8+ T cells (J) in BALs. Each symbol represents individual animals. Thick lines represent the average of the baricitinib-treated (blue line) and untreated groups (red line). (K–M) Representative staining of Ki-67 and CD38 by HLA-DR. Bars in (C) represent the average of the treated and untreated groups. Statistical analysis in (C), (E), and (G) was performed using non-parametric Mann-Whitney test. Statistical analyses were performed two-sided with p ≤ 0.05 deemed significant. Ranges of significance were graphically annotated as follows: p < 0.05. See also Figures S6C and S7.
Figure S7
Figure S7
Baricitinib treatment did not affect the immune T cell responses in SARS-CoV-2-infected RMs, related to Figure 6 (A–C) Frequency of circulating CD4+ T cells spontaneously (without stimulation) producing pro-inflammatory Th17 related cytokines (A) IL-17+, (B) IL-17+IL-21+, (C) IL-17+IL- 22+ at necropsy (days 10–11 after infection) in baricitinib (blue) and untreated (red) SARS-CoV-2 infected RMs. (D) Representative flow cytometry staining of IFNγ, TNFα, IL-2, IL-4 and IL-17a in CD4+ and CD8+ T cells of a SARS-CoV-2 infected RM following stimulation with SARS-CoV-2 S peptide pool. IFNγ, Unstimulated background values were subtracted from S peptide stimulated values to determine T cell cytokine. (E and F) IFNγ, TNFα, IL-2, IL-4 and IL-17a frequency levels in (E) CD4+ and (F) CD8+T cells following stimulation with SARS-CoV-2 S peptide pool. (G–L) IFNγ, TNFα, IL-2, IL-4 and IL-17a frequency levels in (G) CD4+ and (H) CD8+T cells following stimulation with PMA/Ionomycin. Values from unstimulated controls were subtracted in all cases. Granzyme B and PD-1 levels in (I and J) blood and (K and L) BAL memory CD8+T cells measured by flow cytometry. Each symbol represents individual animals. Thick lines represent the average of the baricitinib treated (blue line), and untreated groups (red line). Bars represent the average of the treated and untreated groups. Statistical analysis was performed using a non-parametric Mann-Whitney Test.
Figure 7
Figure 7
Effect of baricitinib treatment on the lower airway of SARS-CoV-2-infected RMs (A) SARS-Cov-2 infection in RMs results in an accumulation of inflammatory macrophages and neutrophils in the lower airway. These airway macrophages produce high amounts of inflammatory cytokines and neutrophil-attracting chemokines and show upregulated type I interferon signaling. Neutrophil NETs and the inflammation induced by SARS-CoV-2 infection both contribute to lung pathology. (B) Baricitinib treatment reduced the levels of macrophages producing inflammatory cytokines and neutrophil-attracting chemokines, decreased the infiltration of neutrophils into the lung, and reduced T cell activation. The Netosis activity of neutrophils was also reduced. In treated animals, the antiviral interferon response was maintained, viral replication was not impacted, and lung pathology was mild.

Update of

Similar articles

Cited by

References

    1. Aran D., Looney A.P., Liu L., Wu E., Fong V., Hsu A., Chak S., Naikawadi R.P., Wolters P.J., Abate A.R. Reference-based analysis of lung single-cell sequencing reveals a transitional profibrotic macrophage. Nat. Immunol. 2019;20:163–172. - PMC - PubMed
    1. Arunachalam P.S., Wimmers F., Mok C.K.P., Perera R.A.P.M., Scott M., Hagan T., Sigal N., Feng Y., Bristow L., Tak-Yin Tsang O. Systems biological assessment of immunity to mild versus severe COVID-19 infection in humans. Science. 2020;369:1210–1220. - PMC - PubMed
    1. Bost P., Giladi A., Liu Y., Bendjelal Y., Xu G., David E., Blecher-Gonen R., Cohen M., Medaglia C., Li H. Host-Viral Infection Maps Reveal Signatures of Severe COVID-19 Patients. Cell. 2020;181:1475–1488. - PMC - PubMed
    1. Bronte V., Ugel S., Tinazzi E., Vella A., De Sanctis F., Cane S., Batani V., Trovato R., Fiore A., Petrova V. Baricitinib restrains the immune dysregulation in severe COVID-19 patients. J. Clin. Invest. 2020 - PMC - PubMed
    1. Cantini F., Niccoli L., Matarrese D., Nicastri E., Stobbione P., Goletti D. Baricitinib therapy in COVID-19: A pilot study on safety and clinical impact. J. Infect. 2020;81:318–356. - PMC - PubMed

Publication types

MeSH terms