. 2020 Nov 30;11(11):1022.
doi: 10.1038/s41419-020-03223-0.

The armed oncolytic adenovirus ZD55-IL-24 eradicates melanoma by turning the tumor cells from the self-state into the nonself-state besides direct killing

Affiliations

The armed oncolytic adenovirus ZD55-IL-24 eradicates melanoma by turning the tumor cells from the self-state into the nonself-state besides direct killing

Hai-Jun Hu et al. Cell Death Dis. .

Abstract

ZD55-IL-24 is similar but superior to the oncolytic adenovirus ONYX-015, yet the exact mechanism underlying the observed therapeutic effect is still not well understood. Here we sought to elucidate the underlying antitumor mechanism of ZD55-IL-24 in both immunocompetent and immunocompromised mouse model. We find that ZD55-IL-24 eradicates established melanoma in B16-bearing immunocompetent mouse model not through the classic direct killing pathway, but mainly through the indirect pathway of inducing systemic antitumor immunity. Inconsistent with the current prevailing view, our further results suggest that ZD55-IL-24 can induce antitumor immunity in B16-bearing immunocompetent mouse model in fact not due to its ability to lyse tumor cells and release the essential elements, such as tumor-associated antigens (TAAs), but due to its ability to put a "nonself" label in tumor cells and then turn the tumor cells from the "self" state into the "nonself" state without tumor cell death. The observed anti-melanoma efficacy of ZD55-IL-24 in B16-bearing immunocompetent mouse model was practically caused only by the viral vector. In addition, we also notice that ZD55-IL-24 can inhibit tumor growth in B16-bearing immunocompetent mouse model through inhibiting angiogenesis, despite it plays only a minor role. In contrast to B16-bearing immunocompetent mouse model, ZD55-IL-24 eliminates established melanoma in A375-bearing immunocompromised mouse model mainly through the classic direct killing pathway, but not through the antitumor immunity pathway and anti-angiogenesis pathway. These findings let us know ZD55-IL-24 more comprehensive and profound, and provide a sounder theoretical foundation for its future modification and drug development.


Conflict of interest statement

X.-Y.L., J.-F.G., and L.-Y.S. are inventors on a patent for the construction and application of ZD55-IL-24 (US Patent and Trademark Office, 20090117643A1). The other authors declare no competing financial interests.

Figures

Fig. 1
Fig. 1. ZD55-IL-24 inhibits tumor growth in B16-bearing immunocompetent mouse model not through the classic direct killing pathway, but through unknown indirect pathway.
AD The antitumor efficacy of ZD55-IL-24 in B16-bearing immune-competent mouse model. A Timeline of tumor engraftment and treatments. B Tumor growth curves and C survival over time for mice inoculated with 106 B16 melanoma cells s.c. in the right flank and treated 7 days later (the average tumor volume was about 80 mm3) with the indicated PBS or ZD55-IL-24. D Body weight changes of the B16 melanoma-bearing mice monitored during the therapy period. s.c. subcutaneous injection, i.t. intratumoral injection. Data are presented as the mean ± SEM. n = 10 mice per group per experiment. EH The B16 cell killing effect of ZD55-IL-24 in vitro. E B16 cells were infected with ZD55-IL-24 at a series of MOI (PFU/cell) from 0 to 150, the appearance of cytopathic effect was monitored under microscope, and representative photographs were taken at day 2 post-infection F and cell viability was measured by CCK-8 assay. G The B16 cells at a density of 104 cells/well cultured in 96-well plates were infected with 1500 MOI (PFU/cell) ZD55-IL-24, the appearance of cytopathic effect was monitored under microscope, and representative photographs were taken at 4 days later, and H cell viability was examined by CCK-8 assay. Results represent mean ± SEM of triplicate experiments and are expressed as a percentage of control cells. IO The B16 cell killing effect of ZD55-IL-24 in vivo. I Tumors resected from B16-bearing C57BL/6 mice receiving PBS or ZD55-IL-24 treatment as indicated in A were analyzed 2 days after the last injection by immunohistochemical staining. Shown are representative micrographs of tumor sections immunostained for the proliferation marker Ki-67 (green), and J quantification of the number of Ki-67+ cells in I (Ki-67+ nuclei as % of total nuclei; n = 3). K Shown are representative images of tumor sections immunostained for the apoptosis marker TUNEL (red), and L quantification of the TUNEL+ cells in K (TUNEL+ cells as % of total cells; n = 9). Nuclei is counterstained with DAPI (blue). Data are mean ± SD. Scale bars, 300 µm. Shown is one of three independent experiments. M C57BL/6 mice with B16 tumors were treated as indicated in Fig. 4A, and then the tumor cells were isolated for flow cytometry analysis. Shown are representative flow cytometry plots for Ki-67, and N percentages or O average median fluorescent intensities (MFI) of Ki-67+ cells, mean ± SEM is shown. Data represent cumulative results from eight independent experiments.
Fig. 2
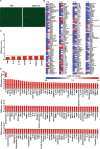
Fig. 2. ZD55-IL-24 therapy remodels the cytokine microenvironment of the established tumors in B16-bearing immunocompetent mouse model.
C57BL/6 mice bearing B16 tumors were treated with the regimens indicated in Fig. A. Two days after the last injection, tumors were isolated and cytokine levels were measured by cytokine antibody arrays. A Original images of cytokine antibody arrays. B Heat-map of cytokine changes in A (average signal intensity of two repeat spot) (see also Supplementary Table 1). P PBS, Z ZD55-IL-24. C The down-regulated cytokines in B. Difference scores ≤0.65 (dashed line) are considered as significant down-regulation. D The up-regulated cytokines in B. Difference scores ≥1.5 (dashed line) are considered as significant up-regulation.
Fig. 3
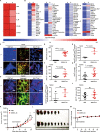
Fig. 3. ZD55-IL-24 inhibits melanoma growth in B16-bearing immunocompetent mouse model mainly through the indirect pathway of inducing systemic antitumor immunity.
A, B Changes of the immune-related cytokines in tumors treated with ZD55-IL-24. A Heat-map of the down-regulated immunosuppressive cytokines in Fig. 2C. B Heat-map of the up-regulated immunostimulatory cytokines in Fig. 2D. CJ Immunohistochemical analysis of immune cell infiltration in tumors, as well as recruitment and activation in spleens. Tumors and spleens resected from B16-bearing C57BL/6 mice receiving PBS or ZD55-IL-24 treatment indicated in Fig. 1A were analyzed 2 days after the last injection by immunohistochemical staining. C Shown are representative images of tumor sections immunostained for CD8 (red, left panel), CD11b and Ly-6G (yellow, middle panel), and NK1.1 (red, right panel). D Quantification of the CD8+ cells in C (n = 11). E Quantification of the CD11b+Ly-6G+Ly-6Clow neutrophils in C (n = 3). f Quantification of the NK1.1+ cells in c (n = 6). G Quantification of the CD8+ cells in H (n = 9). H Shown are representative images of spleen sections immunostained for CD8 (red, left panel), CD11b and Ly-6G (yellow, middle panel), and NK1.1 (red, right panel). I Quantification of the CD11b+Ly-6G+Ly-6Clow neutrophils in H (n = 3). j Quantification of NK1.1+ cells in h (n = 9). Nuclei is counterstained with DAPI (blue). Data are mean ± SD. Scale bars, 300 µm. Shown is one of three independent experiments. KM The anti-melanoma efficacy of ZD55-IL-24 in B16-bearing immunocompromised mouse model. BALB/c nude mice were inoculated with B16 tumors and treated with PBS or ZD55-IL-24 as indicated in Fig. 1A. K Shown are tumor growth curves and L photograph of tumors resected from the sacrificed mice at the end of the experiment. M Body weight changes of the mice monitored during the therapy period. P PBS, Z ZD55-IL-24, mean ± SEM is shown. n = 7 mice for PBS-treated group, and n = 10 mice for ZD55-IL-24-treated group. Data represent results from one of two independent experiments.
Fig. 4
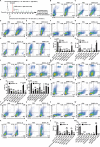
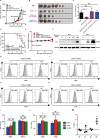
Fig. 4. ZD55-IL-24 induces systemic antitumor immunity in B16-bearing immune-competent mouse model by promoting the immune system recognizing tumor cells.
A Treatment scheme. BK Flow-cytometric analysis of immune cell infiltration in right tumors (local ZD55-IL-24-injected tumors). B Representative flow cytometry plots of tumor-infiltrating total myeloid cells (CD11b+) and neutrophils (CD11b+Ly-6G+Ly-6Clow) in right tumors. C Representative flow cytometry plots of tumor-infiltrating natural killer cells (NK, NK1.1+CD3) and natural killer T cells (NKT, NK1.1+CD3+) in right tumors. D Representative flow cytometry plots of tumor-infiltrating M1 macrophages (F4/80+CD206) and M2 macrophages (F4/80+CD206+) in right tumors. E Representative flow cytometry plots of tumor-infiltrating MHC II+CD11c antigen-presenting cells (APCs) and dendritic cells (DCs, MHC II+CD11c+) in right tumors. F Representative flow cytometry plots of tumor-infiltrating total T cells (CD3+), CD8+CD3 cells, and CD8+ T cells (CD8+CD3+) in right tumors. G Representative flow cytometry plots of tumor-infiltrating CD4+CD3 cells and CD4+ T cells (CD4+CD3+) in right tumors. H Representative flow cytometry plots of tumor-infiltrating conventional T cells (Tconv, CD4+FOXP3) and regulatory T cells (Treg, CD4+FOXP3+) in right tumors. I Representative flow cytometry plots of tumor-infiltrating plasma cells (B220+CD19) and B cells (B220+CD19+) in right tumors. J Percentages of innate immune cells in right tumors. K Percentages of adaptive immune cells in right tumors. LQ Flow-cytometric analysis of immune cell recruitment and activation in spleens. L Representative flow cytometry plots of MHC II+CD11c APCs and DCs in spleens. M Representative flow cytometry plots of total T cells, CD8+CD3 cells, and CD8+ T cells in spleens. N Representative flow cytometry plots of CD4+CD3 cells and CD4+ T cells in spleens. O Representative flow cytometry plots of Tconv cells and Treg cells in spleens. P Percentages of innate immune cells in spleens. Q Percentages of adaptive immune cells in spleens. RAA Flow-cytometric analysis of immune cell infiltration in left tumors (distant ZD55-IL-24-uninjected tumors). R Representative flow cytometry plots of tumor-infiltrating total myeloid cells and neutrophils in left tumors. S Representative flow cytometry plots of tumor-infiltrating NK cells and NKT cells in left tumors. T Representative flow cytometry plots of tumor-infiltrating M1 macrophages and M2 macrophages in left tumors. U Representative flow cytometry plots of tumor-infiltrating MHC II+CD11c APCs and DCs in left tumors. V Representative flow cytometry plots of tumor-infiltrating total T cells, CD8+CD3 cells, and CD8+ T cells in left tumors. W Representative flow cytometry plots of tumor-infiltrating CD4+CD3 cells and CD4+ T cells in left tumors. X Representative flow cytometry plots of tumor-infiltrating Tconv cells and Treg cells in left tumors. Y Representative flow cytometry plots of tumor-infiltrating plasma cells and B cells in left tumors. Z Percentages of innate immune cells in left tumors. AA Percentages of adaptive immune cells in left tumors. s.c. subcutaneous injection, i.t. intratumoral injection, mean ± SEM is shown. Data represent cumulative results from nine to twelve (BK), seven (LQ), or nine (RAA) independent experiments.
Fig. 5
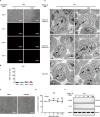
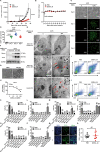
Fig. 5. ZD55-IL-24 promotes the immune recognition of tumor cells in B16-bearing immunocompetent mouse model not due to its ability to lyse immunogenic tumor cells and release the essential elements for the induction of antitumor immunity.
AD Fluorescence microscopic analysis of viral infection and exogenous gene expression in B16 cells. D The murine melanoma B16 cells were infected with ZD55-EGFP at a MOI (PFU/cell) of 0 and 1000, and the viral infection and exogenous gene expression were monitored under the fluorescence microscope on Day 0, Day 1, Day 2, and Day 4 after infection. D Quantification of the EGFP-positive B16 cells in A (n = 9). Error bars indicate mean ± SD. Shown is one of three independent experiments. C The appearance of cytopathic effect in A was monitored under microscope, and representative phase-contrast images were taken at the end of the experiment, and D cell viability was measured by CCK-8 assay. Results represent mean ± SEM of triplicate experiments and are expressed as a percentage of control cells. Scale bars, 300 µm. E Representative transmission electron microscopy images of B16 cells treated with ZD55-IL-24 at a MOI (PFU/cell) of 0 and 2500. Shown is one of three independent experiments. Nuclei are indicated by the black arrow. Scale bar: 4 μm. F Western blot analysis of viral infection and exogenous IL-24 expression in B16 cells infected with ZD55-IL-24 at a series of MOI (PFU/cell) as indicated. Shown is one of three independent experiments.
Fig. 6
Fig. 6. ZD55-IL-24 promotes the immune recognition of tumor cells in B16-bearing immunocompetent mouse model due to its ability to turn the tumor cells from the “self” state into the “nonself” state.
AE The antitumor efficacy of inactive ZD55-IL-24 in B16-bearing immunocompetent mouse model. C57BL/6 mice were inoculated with B16 tumors and treated with PBS, ZD55-IL-24, or inactive ZD55-IL-24 as indicated in Fig. 4A. A In vivo tumor growth curves. B Photograph of tumors resected from the sacrificed mice at the end of the experiment. C Weight of tumors resected from the sacrificed mice at the end of the experiment. D Overall survival. E Body weight changes of the mice monitored during the therapy period. UV ultraviolet, HTHP high temperature and high pressure, E eradication, D death. Data represent results from one of two independent experiments with n = 10 per group, mean ± SEM is shown. F Western blot analysis of E1A expression in B16 and A375 cells infected with ZD55-IL-24 at a series of MOI (PFU/cell) as indicated. Shown is one of three independent experiments. GI Flow-cytometric analysis of MHC molecules on the surface of B16 cells infected with ZD55-IL-24 at a MOI (PFU/cell) of 0, 1, and 100. G Representative flow cytometry plots of surface MHC I. H Representative flow cytometry plots of surface MHC II. I MFI in G and H. JL Flow-cytometric analysis of costimulatory molecules on the surface of B16 cells infected with ZD55-IL-24 at a MOI (PFU/cell) of 0, 1, and 100. J Representative flow cytometry plots of surface CD80. K Representative flow cytometry plots of surface CD86. L MFI in J and K, mean ± SEM is shown. Data represent cumulative results from three independent experiments. M Cytotoxicity analysis of PBMCs obtained from ZD55-IL-24-treated mice bearing no tumors to ZD55-IL-24-treated B16 cells in vitro. B16 cells were treated with PBS or 100 MOI (PFU/cell) ZD55-IL-24, and then cocultured with the PBMCs obtained from PBS or ZD55-IL-24-treated mice (C57BL/6 mice without receiving tumor inoculation) at the effector:target ratio of 100:1 to assess the in vitro cytotoxicity. P/P PBS-treated B16 cells cocultured with PBMCs from PBS-treated mice, P/Z PBS-treated B16 cells cocultured with PBMCs from ZD55-IL-24-treated mice, Z/P ZD55-IL-24-treated B16 cells cocultured with PBMCs from PBS-treated mice, Z/Z ZD55-IL-24-treated B16 cells cocultured with PBMCs from ZD55-IL-24-treated mice, mean ± SEM is shown. Data represent cumulative results from three independent experiments.
Fig. 7
Fig. 7. ZD55-IL-24 inhibits melanoma growth in B16-bearing immune-competent mouse model also through inhibiting angiogenesis.
A, B Changes of the angiogenesis-related cytokines in tumors treated with ZD55-IL-24. A Heat-map of the down-regulated pro-angiogenic cytokines in Fig. 2C. B Heat-map of the up-regulated anti-angiogenic cytokines in Fig. 2D. C, D The anti-angiogenic effect of ZD55-IL-24 in vitro. C The murine vascular endothelial bEnd.3 cells were infected with ZD55-IL-24 at a series of MOI (PFU/cell) from 0 to 150, the appearance of cytopathic effect was monitored under microscope, and representative photographs were taken at day 4 post-infection D and cell viability was measured by CCK-8 assay. Results represent mean ± SEM of triplicate experiments and are expressed as a percentage of control cells. E, F The anti-angiogenic effect of ZD55-IL-24 in vivo. Tumors resected from B16-bearing C57BL/6 mice receiving PBS or ZD55-IL-24 treatment indicated in Fig. 1A were analyzed 2 days after the last injection by immunohistochemical staining. E Representative images of tumor sections immunostained for the endothelial marker CD31 (green) to label the blood vessels in tumors. F Quantification of the CD31+ cells in E (n = 9). Nuclei is counterstained with DAPI (blue). P PBS, Z ZD55-IL-24. Scale bars, 300 µm. Data are mean ± SD. Shown is one of three independent experiments.
Fig. 8
Fig. 8. ZD55-IL-24 eradicates established melanoma in A375-bearing immunocompromised mouse model mainly through the classic direct killing pathway, but not through the antitumor immunity pathway and anti-angiogenesis pathway.
A, B The antitumor efficacy of ZD55-IL-24 in A375-bearing immunocompromised mouse model. A Tumor growth curves over time for BALB/c nude mice inoculated with 2 × 106 A375 cells s.c. in the right flank and treated with PBS or ZD55-IL-24 as indicated in Fig. 1A. B Body weight changes of the treated mice monitored during the therapy period. Data are presented as the mean ± SEM. n = 8 mice per group per experiment. C, D Fluorescence microscopic analysis of viral infection and exogenous gene expression in A375 cells. C The human melanoma A375 cells were infected with ZD55-EGFP at a MOI (PFU/cell) of 0 and 1000, and the viral infection and exogenous gene expression were monitored under the fluorescence microscope on Day 0, Day 1, Day 2, and Day 4 after infection. D quantification of the EGFP-positive A375 cells in C (n = 9). Error bars indicate mean ± SD. Shown is one of three independent experiments. Scale bars, 300 µm. E Representative transmission electron microscopy images of A375 cells treated with ZD55-IL-24 at a MOI (PFU/cell) of 0 and 250. Shown is one of three independent experiments. Nuclei and viral particles are indicated by the black and red arrow, respectively. Scale bar: 4 μm. Inset: high-power view, Scale bar: 100 nm. F Western blot analysis of viral infection and exogenous IL-24 expression in A375 cells infected with ZD55-IL-24 at a series of MOI (PFU/cell) as indicated. Shown is one of three independent experiments. G, H The cytotoxicity of ZD55-IL-24 in A375 cells in vitro. G The A375 cells at a density of 104 cells/well cultured in 96-well plates were infected with ZD55-IL-24 at a series of MOI (PFU/cell) from 0 to 150, the appearance of cytopathic effect was monitored under microscope, and representative phase-contrast images were taken at 2 days later, and H cell viability was examined by CCK-8 assay. Scale bars, 300 µm. Results represent mean ± SEM of triplicate experiments and are expressed as a percentage of control cells. IP Flow-cytometric analysis of immune cells infiltration in tumors, and recruitment and activation in spleens. Tumors and spleens resected from A375-bearing BALB/c nude mice receiving PBS or ZD55-IL-24 treatment indicated in Fig. 4A were analyzed by flow cytometry. I Shown are representative flow cytometry plots of tumor-infiltrating total myeloid cells and neutrophils in right tumors. J Representative flow cytometry plots of tumor-infiltrating NK cells and NKT cells in right tumors. K Percentages of innate immune cells in right tumors. L Percentages of adaptive immune cells in right tumors. M Percentages of innate immune cells in spleens. N Percentages of adaptive immune cells in spleens. O Percentages of innate immune cells in left tumors. P Percentages of adaptive immune cells in left tumors, mean ± SEM is shown. Data represent cumulative results from seven to eleven (IL), eight to nine (M, N) or nine (O, P) independent experiments. Q, R The anti-angiogenic effect of ZD55-IL-24 in A375-bearing immunodeficient mouse model. Tumors resected from A375-bearing BALB/c nude mice receiving PBS or ZD55-IL-24 treatment indicated in Fig. 4A were analyzed by immunohistochemical staining. Q Representative images of tumor sections immunostained for the endothelial marker CD31 (green) to label the blood vessels in tumors. R Quantification of the CD31+ cells in Q (n = 10). Nuclei is counterstained with DAPI (blue). P PBS, Z ZD55-IL-24. Scale bars, 300 µm. Data are mean ± SD. Shown is one of two independent experiments.

Similar articles

Cited by

References

    1. Russell SJ, Peng K-W, Bell JC. Oncolytic virotherapy. Nat. Biotechnol. 2012;30:658–670. doi: 10.1038/nbt.2287. - DOI - PMC - PubMed
    1. Zhao L, et al. Potent antitumor activity of oncolytic adenovirus expressing mda-7/IL-24 for colorectal cancer. Hum. Gene Ther. 2005;16:845–858. doi: 10.1089/hum.2005.16.845. - DOI - PubMed
    1. Liu X, Pestka S, Shi Y. Recent Advances in Cancer Research and Therapy. Beijing: Tsinghua University Press; 2013.
    1. Zhang Z, et al. An armed oncolytic adenovirus system, ZD55-gene, demonstrating potent antitumoral efficacy. Cell Res. 2003;13:481–489. doi: 10.1038/sj.cr.7290191. - DOI - PubMed
    1. Kaufman HL, Kohlhapp FJ, Zloza A. Oncolytic viruses: a new class of immunotherapy drugs. Nat. Rev. Drug Discov. 2015;14:642–662. doi: 10.1038/nrd4663. - DOI - PMC - PubMed

Publication types