

Discriminating pseudoprogression and true progression in diffuse infiltrating glioma using multi-parametric MRI data through deep learning
- PMID: 33230285
- PMCID: PMC7683728
- DOI: 10.1038/s41598-020-77389-0
Discriminating pseudoprogression and true progression in diffuse infiltrating glioma using multi-parametric MRI data through deep learning
Abstract
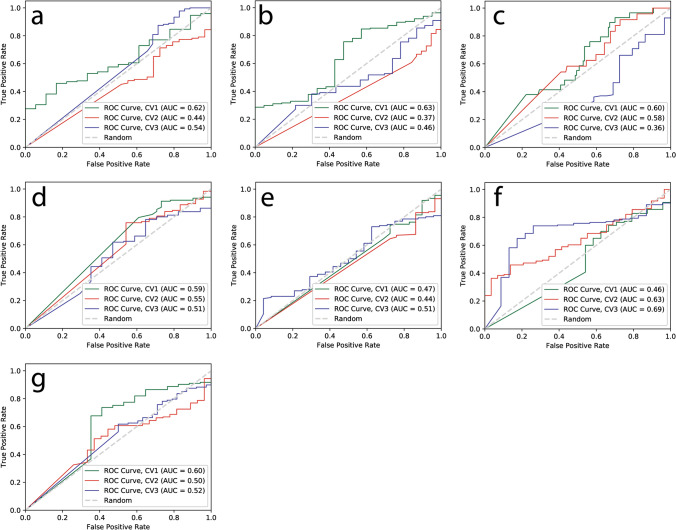
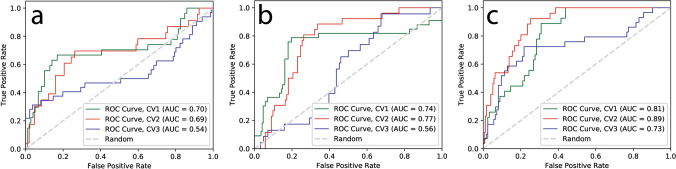
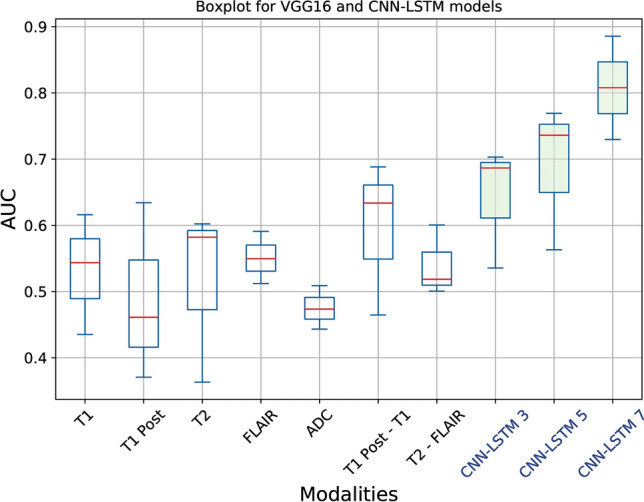
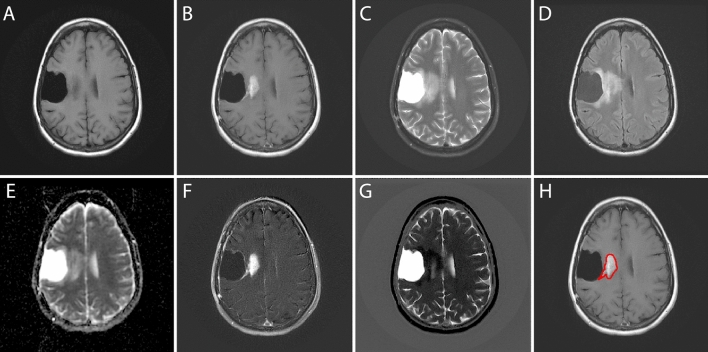
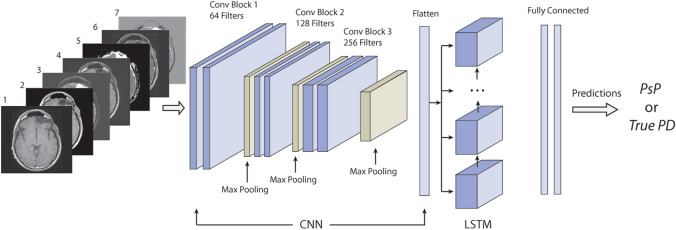
Differentiating pseudoprogression from true tumor progression has become a significant challenge in follow-up of diffuse infiltrating gliomas, particularly high grade, which leads to a potential treatment delay for patients with early glioma recurrence. In this study, we proposed to use a multiparametric MRI data as a sequence input for the convolutional neural network with the recurrent neural network based deep learning structure to discriminate between pseudoprogression and true tumor progression. In this study, 43 biopsy-proven patient data identified as diffuse infiltrating glioma patients whose disease progressed/recurred were used. The dataset consists of five original MRI sequences; pre-contrast T1-weighted, post-contrast T1-weighted, T2-weighted, FLAIR, and ADC images as well as two engineered sequences; T1post-T1pre and T2-FLAIR. Next, we used three CNN-LSTM models with a different set of sequences as input sequences to pass through CNN-LSTM layers. We performed threefold cross-validation in the training dataset and generated the boxplot, accuracy, and ROC curve, AUC from each trained model with the test dataset to evaluate models. The mean accuracy for VGG16 models ranged from 0.44 to 0.60 and the mean AUC ranged from 0.47 to 0.59. For CNN-LSTM model, the mean accuracy ranged from 0.62 to 0.75 and the mean AUC ranged from 0.64 to 0.81. The performance of the proposed CNN-LSTM with multiparametric sequence data was found to outperform the popular convolutional CNN with a single MRI sequence. In conclusion, incorporating all available MRI sequences into a sequence input for a CNN-LSTM model improved diagnostic performance for discriminating between pseudoprogression and true tumor progression.
Conflict of interest statement
The authors declare no competing interests.
Figures
Similar articles
-
MRI based texture analysis to classify low grade gliomas into astrocytoma and 1p/19q codeleted oligodendroglioma.Magn Reson Imaging. 2019 Apr;57:254-258. doi: 10.1016/j.mri.2018.11.008. Epub 2018 Nov 19. Magn Reson Imaging. 2019. PMID: 30465868 Free PMC article.
-
Semi-automatic classification of prostate cancer on multi-parametric MR imaging using a multi-channel 3D convolutional neural network.Eur Radiol. 2020 Feb;30(2):1243-1253. doi: 10.1007/s00330-019-06417-z. Epub 2019 Aug 29. Eur Radiol. 2020. PMID: 31468158
-
The efficacy of using a multiparametric magnetic resonance imaging-based radiomics model to distinguish glioma recurrence from pseudoprogression.Magn Reson Imaging. 2024 Sep;111:168-178. doi: 10.1016/j.mri.2024.05.003. Epub 2024 May 8. Magn Reson Imaging. 2024. PMID: 38729227
-
Post-ictal changes presenting as late pseudoprogression on MRI and PET in a patient with diffuse glioma: Case report and brief literature review.Neuroradiol J. 2024 Apr;37(2):229-233. doi: 10.1177/19714009231166105. Epub 2023 Mar 31. Neuroradiol J. 2024. PMID: 37002537 Review.
-
Imaging and Liquid Biopsy for Distinguishing True Progression From Pseudoprogression in Gliomas, Current Advances and Challenges.Acad Radiol. 2024 Aug;31(8):3366-3383. doi: 10.1016/j.acra.2024.03.019. Epub 2024 Apr 12. Acad Radiol. 2024. PMID: 38614827 Review.
Cited by
-
Pseudoprogression versus true progression in glioblastoma: what neurosurgeons need to know.J Neurosurg. 2023 Feb 10;139(3):748-759. doi: 10.3171/2022.12.JNS222173. Print 2023 Sep 1. J Neurosurg. 2023. PMID: 36790010 Free PMC article. Review.
-
Multi-parametric MRI-based radiomics signature for preoperative prediction of Ki-67 proliferation status in sinonasal malignancies: a two-centre study.Eur Radiol. 2022 Oct;32(10):6933-6942. doi: 10.1007/s00330-022-08780-w. Epub 2022 Jun 10. Eur Radiol. 2022. PMID: 35687135
-
Regorafenib in Glioblastoma Recurrence: How to Deal With MR Imaging Treatments Changes.Front Radiol. 2022 Feb 25;1:790456. doi: 10.3389/fradi.2021.790456. eCollection 2021. Front Radiol. 2022. PMID: 37492166 Free PMC article. Review.
-
Monitoring Therapeutic Responses to Silicified Cancer Cell Immunotherapy Using PET/MRI in a Mouse Model of Disseminated Ovarian Cancer.Int J Mol Sci. 2022 Sep 10;23(18):10525. doi: 10.3390/ijms231810525. Int J Mol Sci. 2022. PMID: 36142437 Free PMC article.
-
Advanced Neuroimaging Approaches to Pediatric Brain Tumors.Cancers (Basel). 2022 Jul 13;14(14):3401. doi: 10.3390/cancers14143401. Cancers (Basel). 2022. PMID: 35884462 Free PMC article. Review.
References
Publication types
MeSH terms
Grants and funding
LinkOut - more resources
Full Text Sources
Medical
