. 2020 Dec 3;80(5):876-891.e6.
doi: 10.1016/j.molcel.2020.10.032. Epub 2020 Nov 19.

Spatiotemporal Proteomic Analysis of Stress Granule Disassembly Using APEX Reveals Regulation by SUMOylation and Links to ALS Pathogenesis

Affiliations

Spatiotemporal Proteomic Analysis of Stress Granule Disassembly Using APEX Reveals Regulation by SUMOylation and Links to ALS Pathogenesis

Hagai Marmor-Kollet et al. Mol Cell. .

Abstract

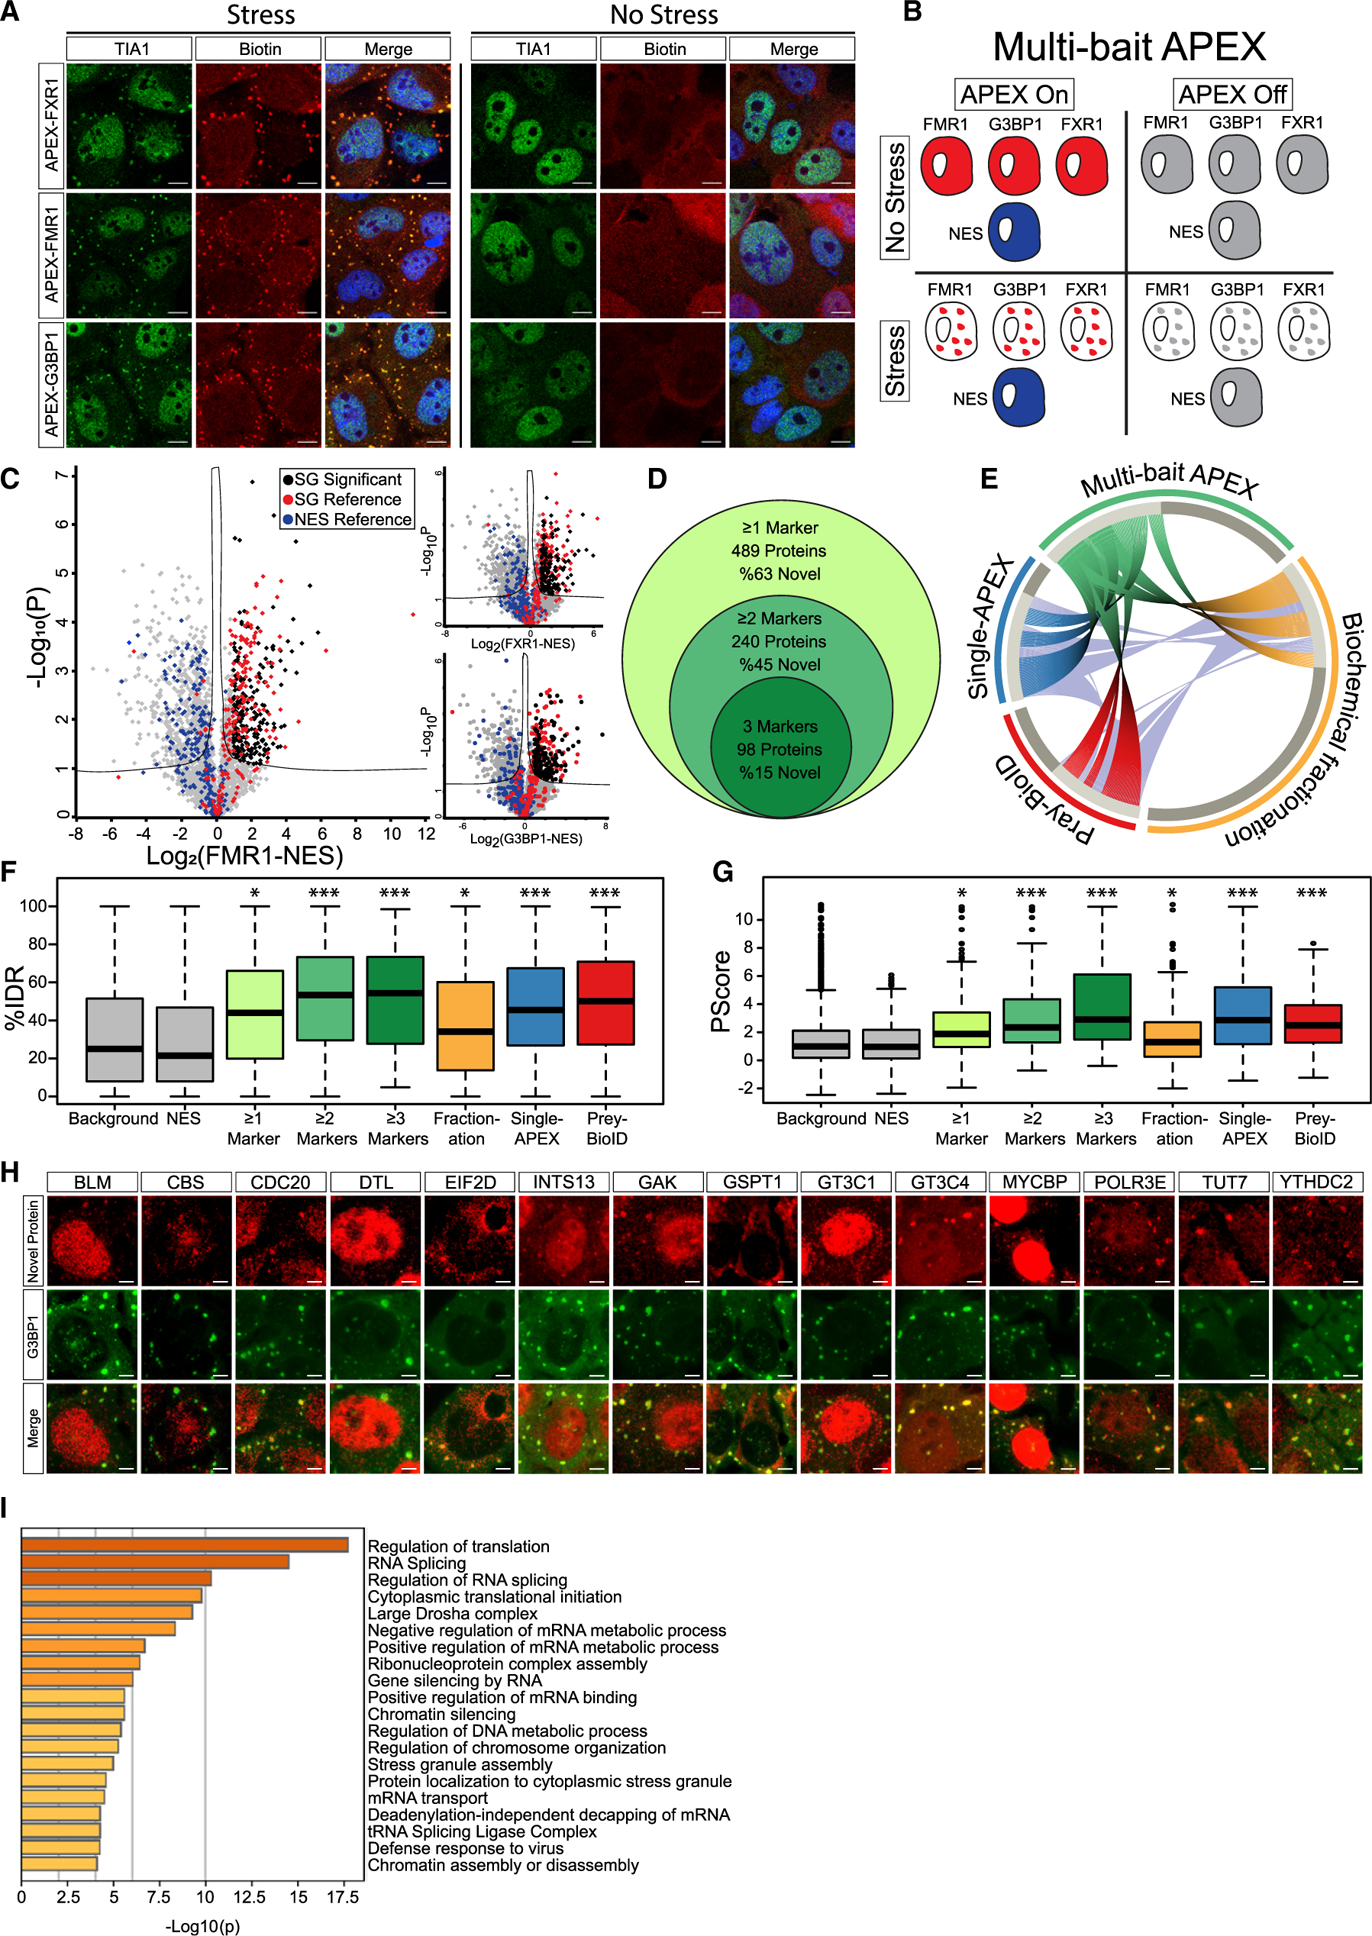
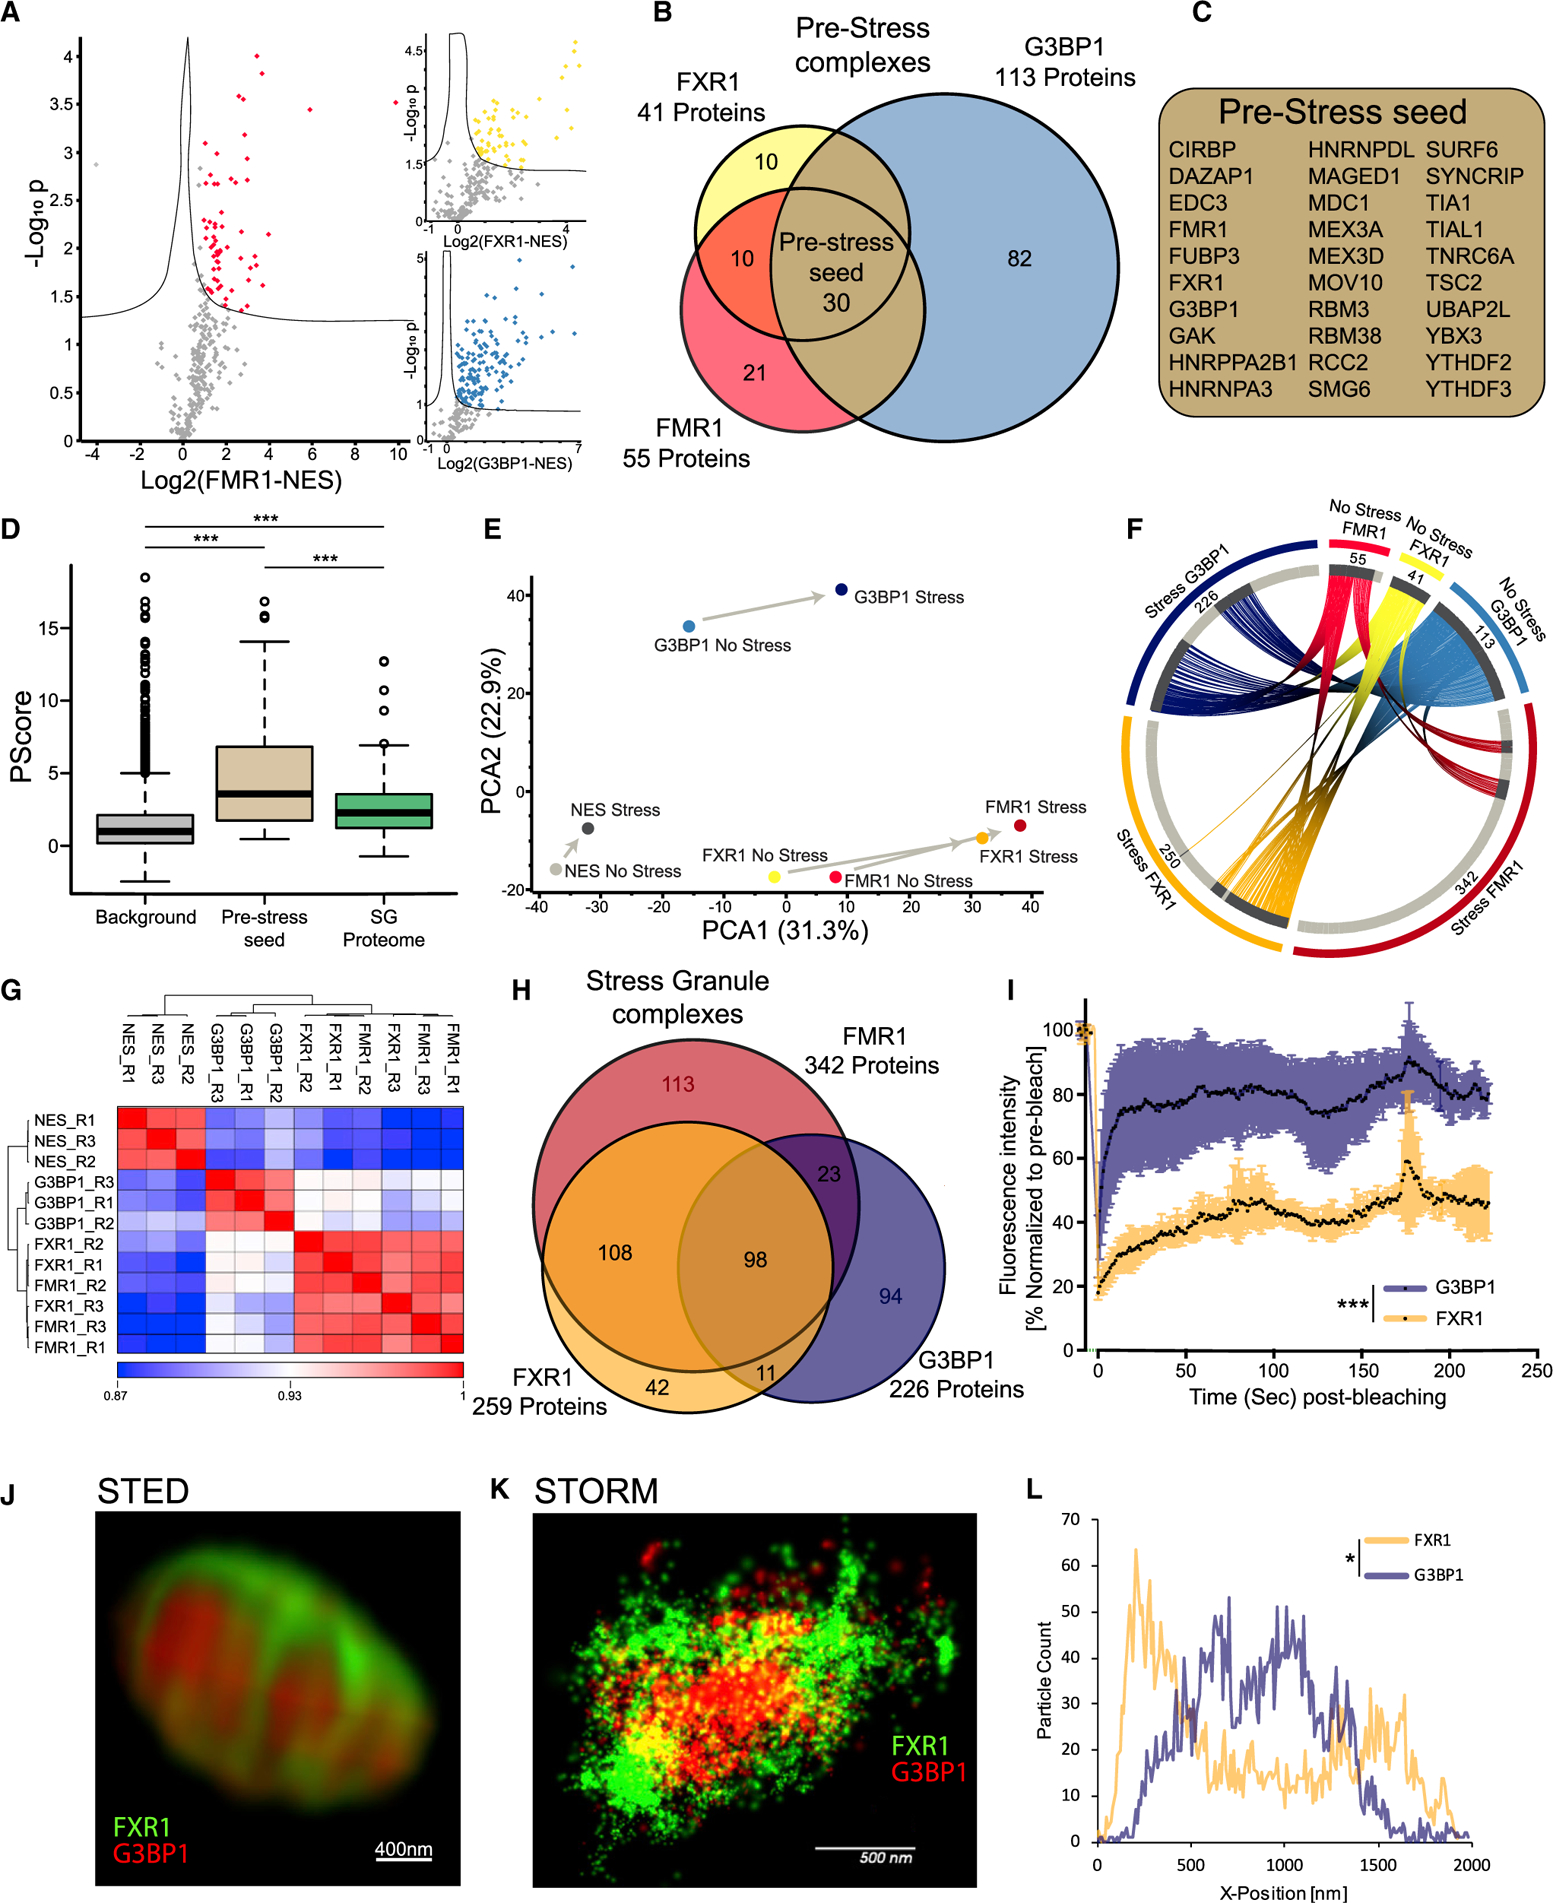
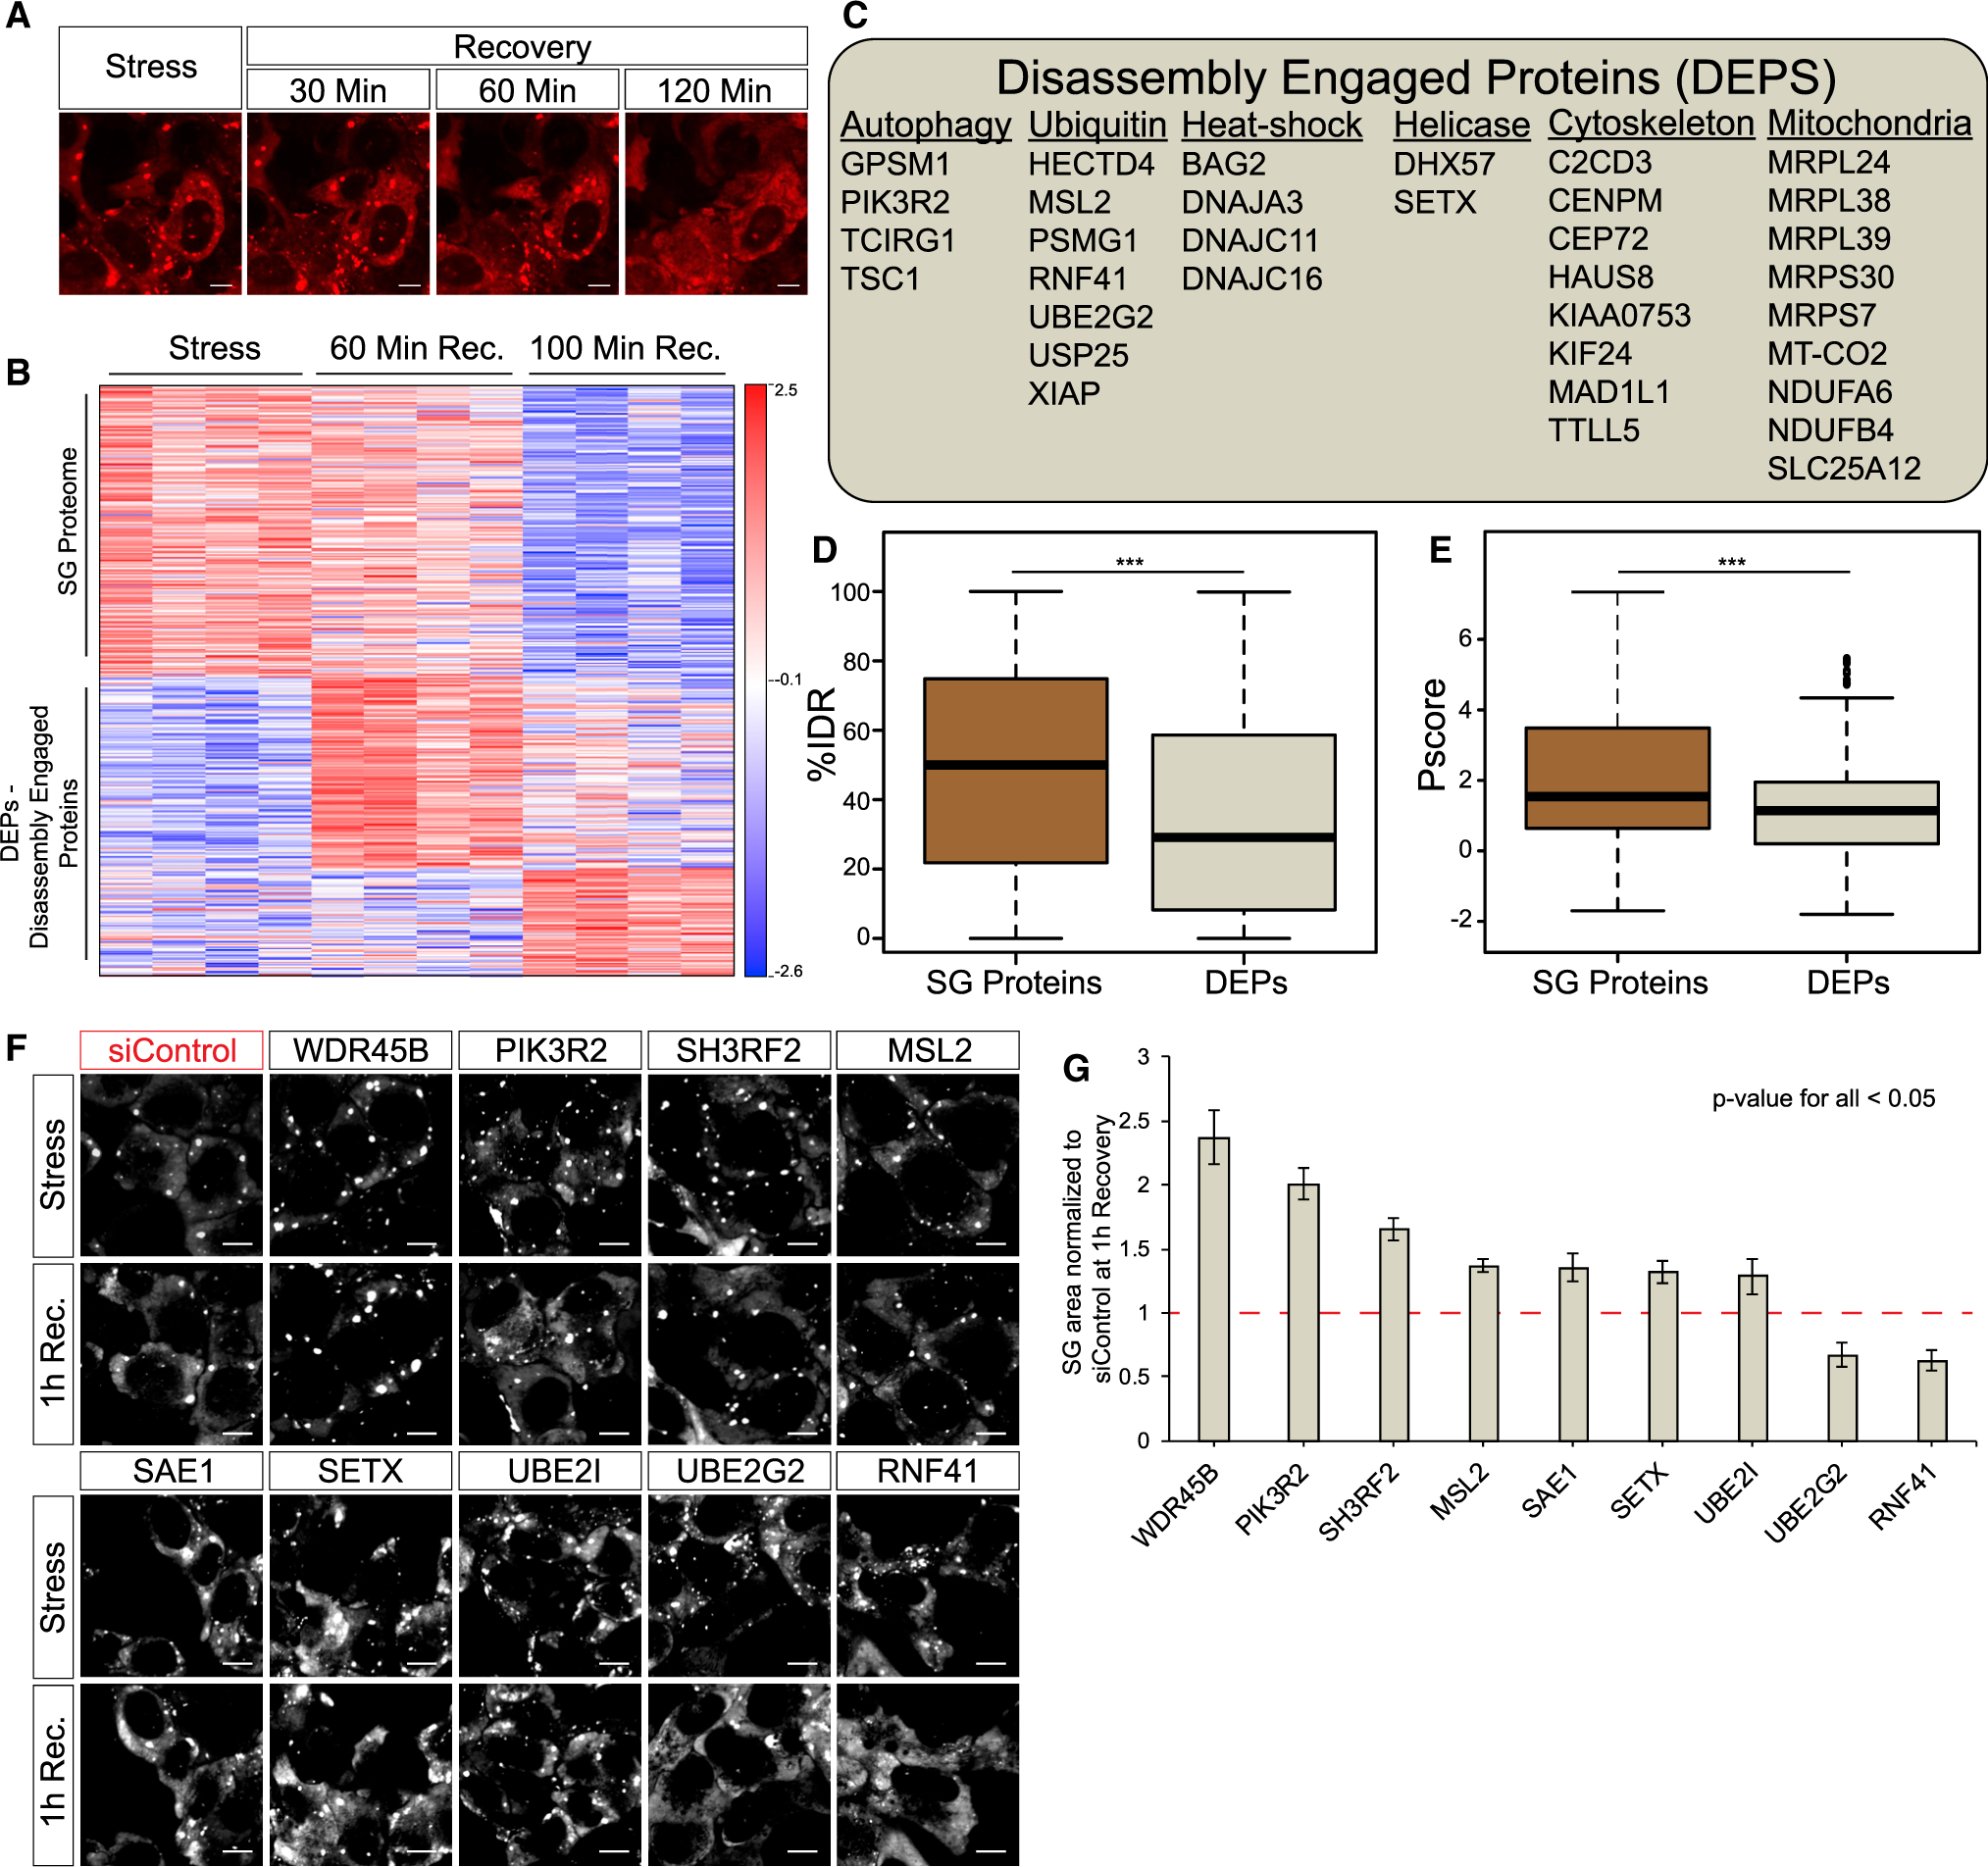
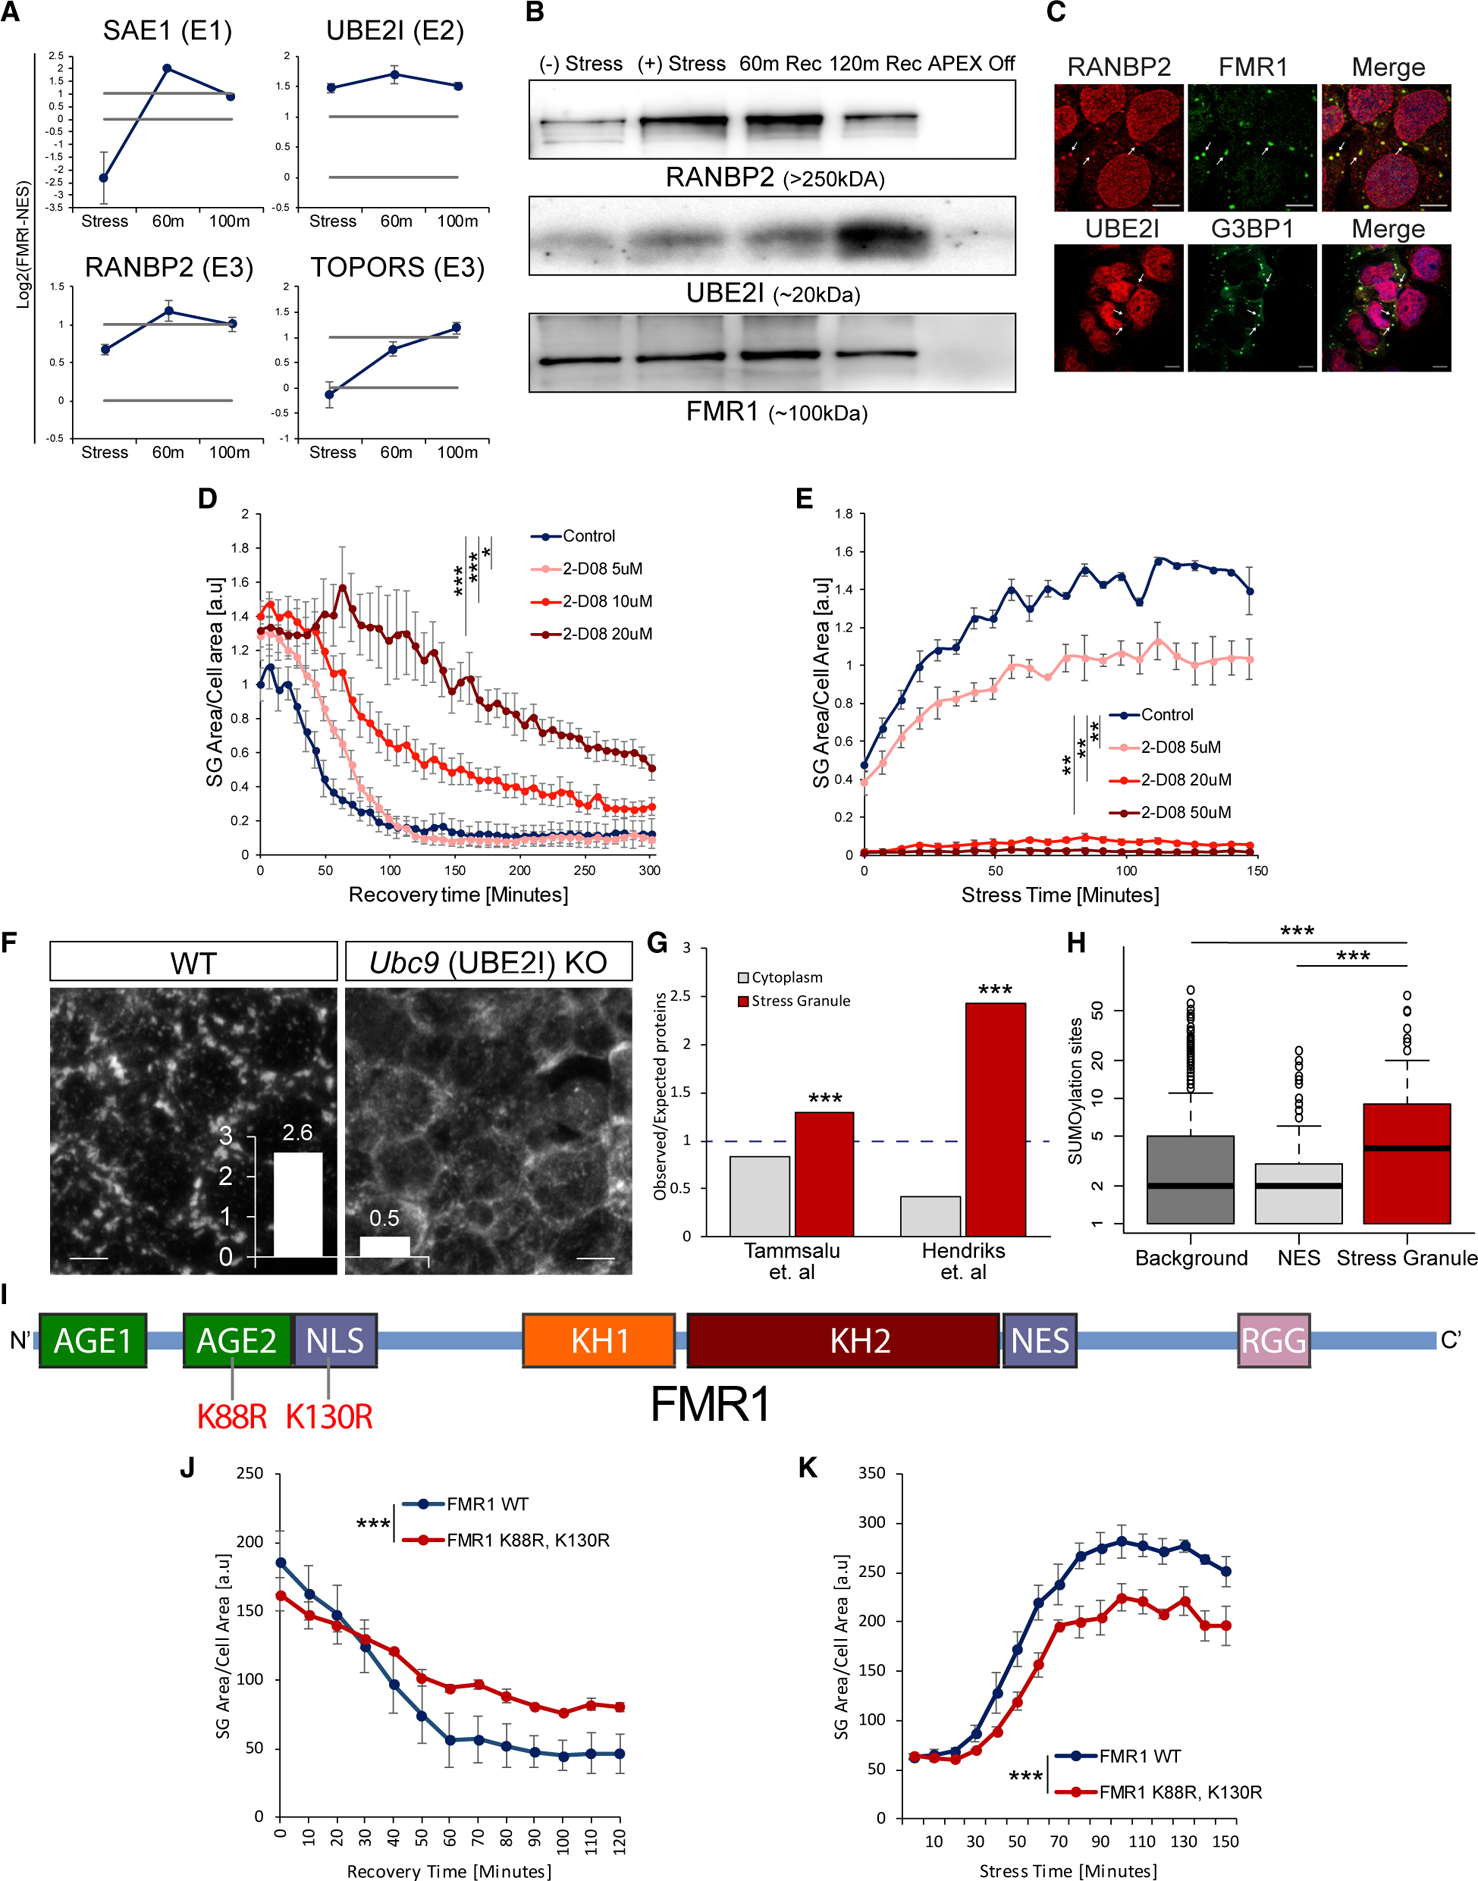
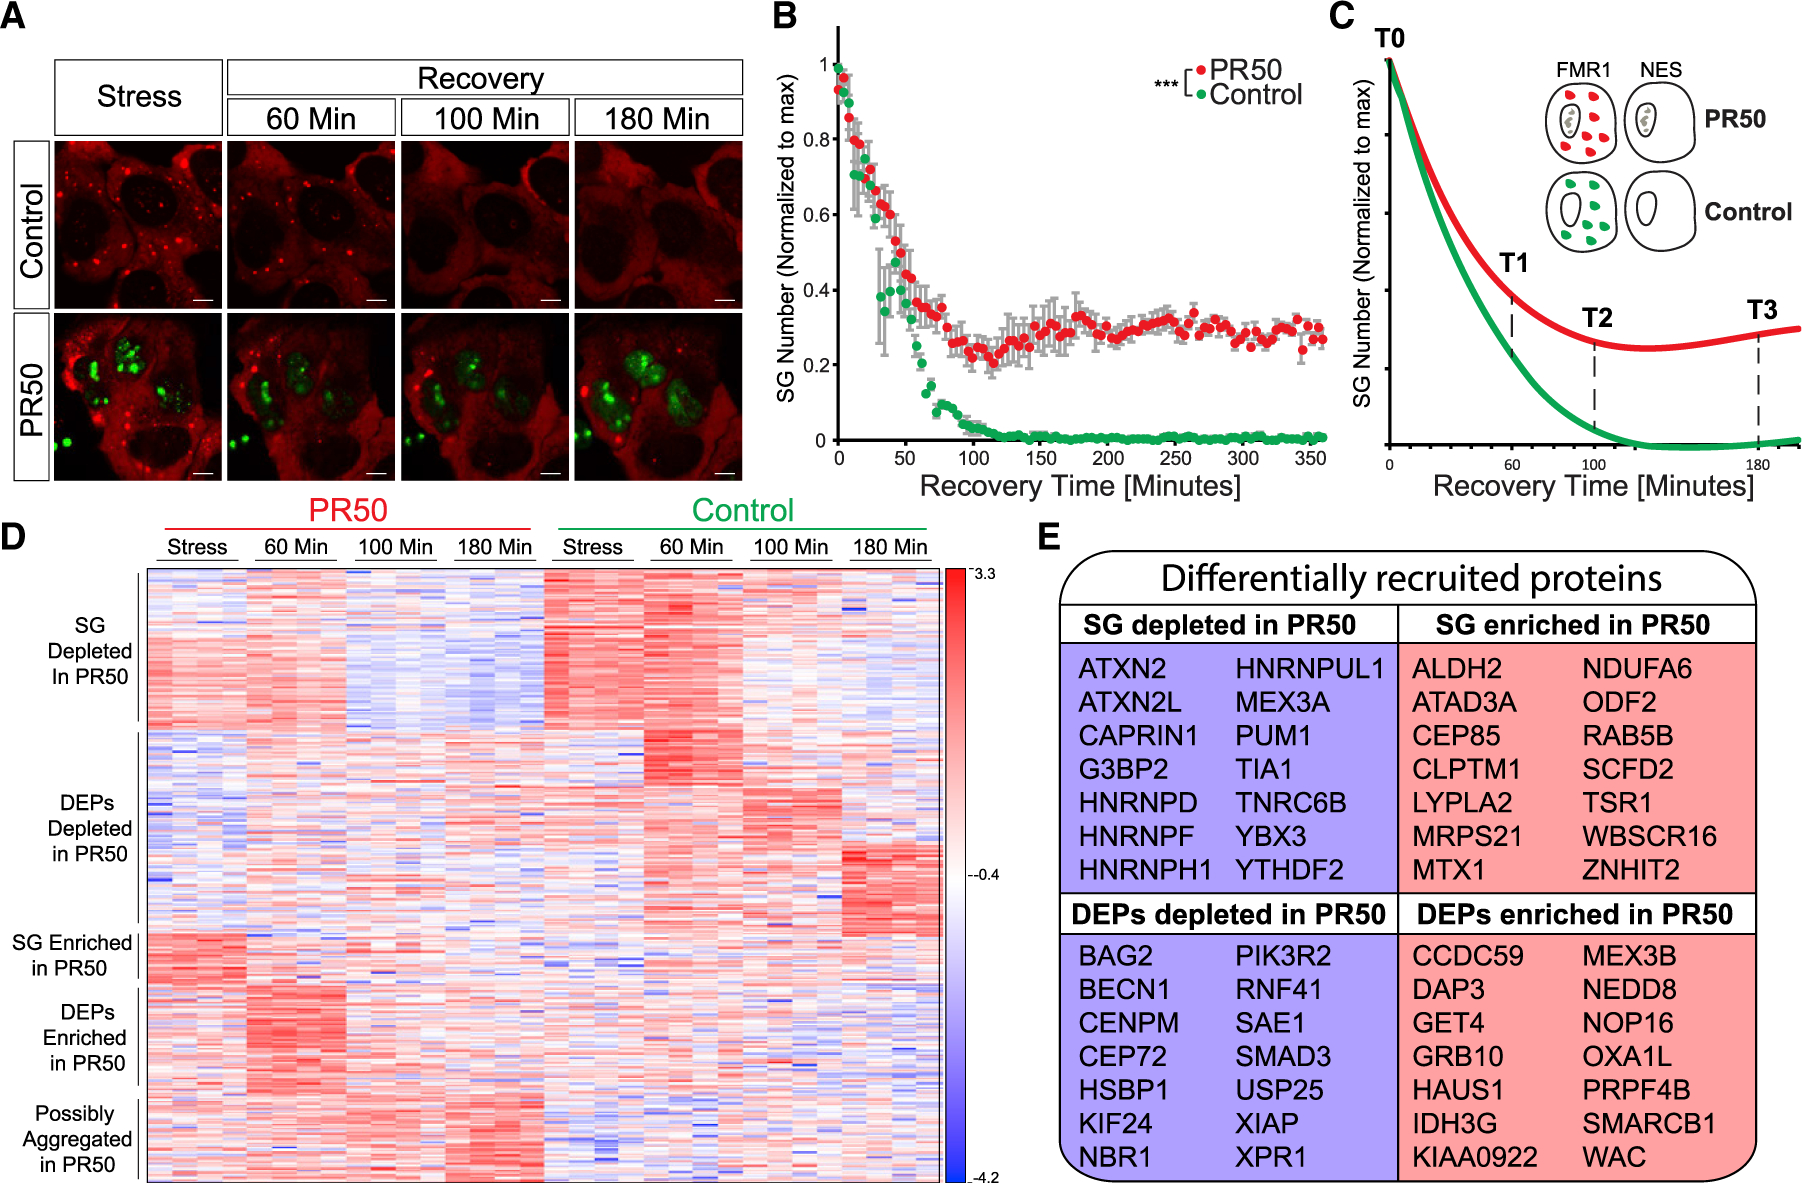
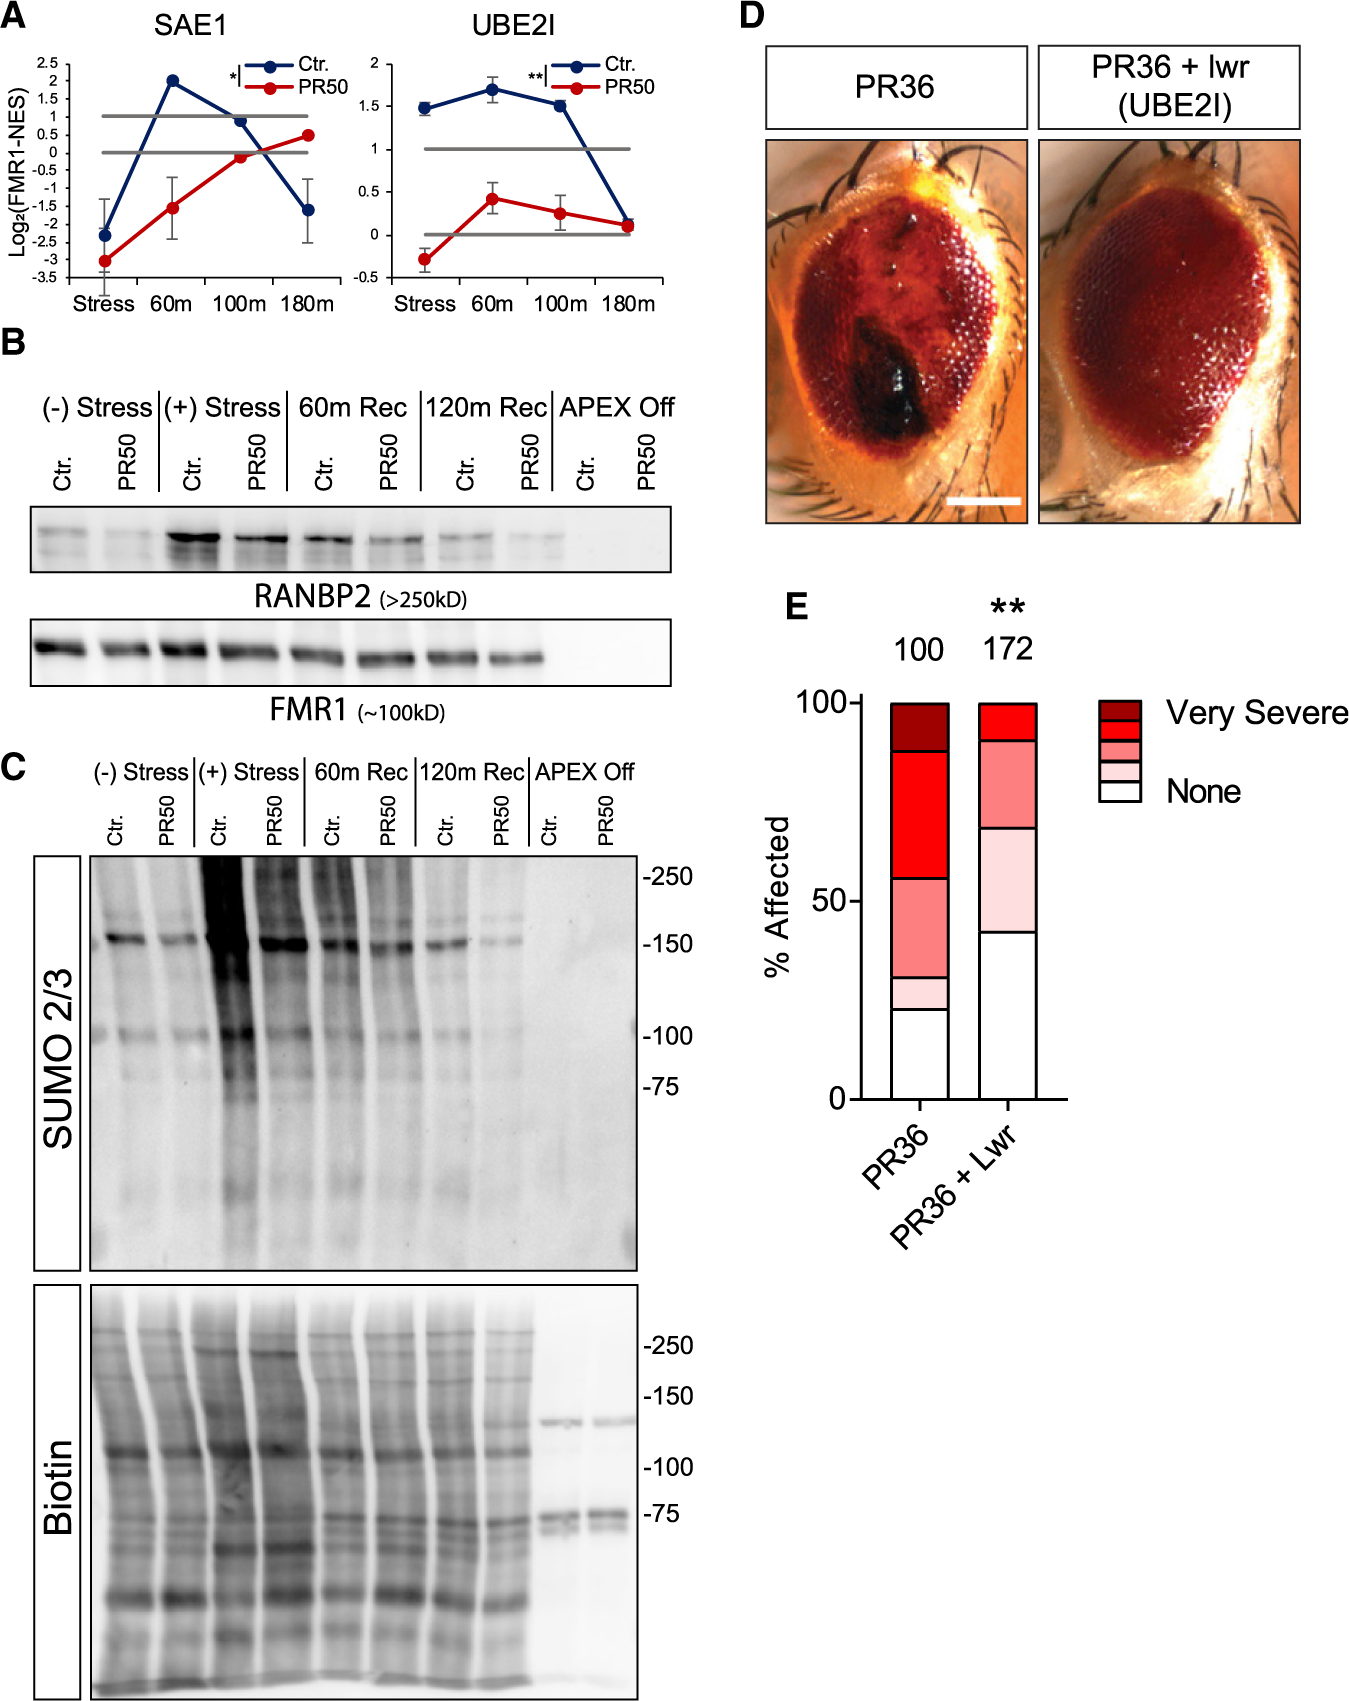
Stress granules (SGs) are cytoplasmic assemblies of proteins and non-translating mRNAs. Whereas much has been learned about SG formation, a major gap remains in understanding the compositional changes SGs undergo during normal disassembly and under disease conditions. Here, we address this gap by proteomic dissection of the SG temporal disassembly sequence using multi-bait APEX proximity proteomics. We discover 109 novel SG proteins and characterize distinct SG substructures. We reveal dozens of disassembly-engaged proteins (DEPs), some of which play functional roles in SG disassembly, including small ubiquitin-like modifier (SUMO) conjugating enzymes. We further demonstrate that SUMOylation regulates SG disassembly and SG formation. Parallel proteomics with amyotrophic lateral sclerosis (ALS)-associated C9ORF72 dipeptides uncovered attenuated DEP recruitment during SG disassembly and impaired SUMOylation. Accordingly, SUMO activity ameliorated C9ORF72-ALS-related neurodegeneration in Drosophila. By dissecting the SG spatiotemporal proteomic landscape, we provide an in-depth resource for future work on SG function and reveal basic and disease-relevant mechanisms of SG disassembly.

Keywords: ALS; APEX; RNA binding proteins; amyotrophic lateral sclerosis; condensates; membraneless organelles; neurodegeneration; phase separation; stress granules; sumoylation.


Conflict of interest statement

Declaration of Interests The authors declare no competing interests.

Figures

Figure 1.
Figure 1.. The Proteome of SGs Revealed by Multi-bait Proximity Labeling
(A) Confocal micrographs depicting FXR1-APEX, FMR1-APEX, or G3BP1-APEX activity in U2OS cells, with or without sodium arsenite stress (NaAsO2 400 μM, 30 min). Immunofluorescence depiction of TIA1, neutravidin-Texas-red staining of biotinylated proteins at the proximity of the APEX bait, and merged signal demonstrating the precise localization of the APEX activity in stress granules (SGs). Lens, ×63; scale bar, 10 μm. (B) Diagram of experimental design. Study with U2OS cells that stably express FXR1-APEX, FMR1-APEX, G3BP1-APEX, or cytoplasmic NES-APEX. SG baits are diffusible in the cytoplasm without stress. NES-APEX remains diffusively cytoplasmic under stress conditions (NaAsO2 400 μM, 30 min.), while FXR1-APEX, FMR1-APEX, and G3BP1-APEX are recruited to SGs. APEX on: APEX peroxidase activity, induced by H2O2, causes BP radical formation that tags biomolecules in the bait vicinity with a biotin moiety. APEX off: control for nonspecific activity without BP. Experiments were performed in triplicates. (C) Volcano plots of relative protein levels in SG APEX relative to NES-APEX samples under stress conditions (x axis log2 scale), analyzed by MS. y axis depicts the differential expression p values (−log10 scale). Black, novel SG proteins above specific marker cutoff (FMR1 = 0.96, FXR1 = 0.89, and G3BP1 = 0.88), relative to NES. Student’s t test with correction to multiple hypothesis by FDR adjusted p < 0.05; red/blue, previously known SG proteins/cytoplasmic organellar proteins. (D) Venn diagram of multi-bait SG analysis and embedded results, revealing proteins identified by at least a single SG bait (associated with FXR1 and/or FMR1 and/or G3BP1), at least two baits, or all three baits together. (E) Circos plot of proteome depicted by at least two baits in our multi-bait APEX study (green), single bait G3BP1-APEX (Markmiller et al., 2018), biochemical fractionation (Jain et al., 2016), or indirect (pray) analysis of data from BioID studies (Youn et al., 2018). Substantial overlap with previously known SG proteome is accompanied by the discovery of 109 novel and internally cross-validated proteins. (F) Boxplot of intrinsically disordered region (IDR) enrichment (%IDR, by IUPred; Mészáros et al., 2018) in the data of the current study and others (Jain et al., 2016; Markmiller et al., 2018; Youn et al., 2018). Background shows all proteins identified in our MS analyses. Upper and lower quartiles and extreme points are shown. Wilcoxon signed-rank test p < 0.005. (G) Boxplot of SG proteome propensity to phase separate (Pscore; Vernon et al., 2018) in the data of the current study and others as in (F). Upper and lower quartiles and extreme points are shown. ANOVA with Tukey post hoc test p < 0.05. (H) Confocal micrographs of immune-fluorescent detection of novel SG proteins in U2OS cells under stress conditions, and co-localization with the G3BP1 SG marker. Scale bar, 10 μm. (I) Bar graph depicting the significance of enrichment in the top 20 Gene Ontology (GO) terms for the SG proteome (−log p value) by Metascape (Zhou et al., 2019).
Figure 2.
Figure 2.. APEX Study of Proteome Composition Reveals the Emergence of Distinct SG Substructures
(A) Volcano plots of protein levels in FMR1, FXR1, or G3BP1 APEX samples relative to NES-APEX samples (x axis log2 scale) under non-stress conditions. y axis depicts the differential expression p values (−log10 scale). Red/yellow/blue features: proteins associated with APEX markers with at least 2-fold enrichment above values in NES. Student t test with correction to multiple hypothesis by FDR adjusted p < 0.05. (B) Venn diagram of FMR1, FXR1, and G3BP1 proteomes under basal conditions, with the number of proteins demarcated. (C) List of 30 pre-stress seed proteins identified by three markers in basal, pre-stress conditions. (D) Boxplot analysis of propensity to phase separate (calculated by Pscore; Vernon et al., 2018) in the background (all proteins identified in our MS analysis, pre-stress seed [30 proteins]) and 240 proteins internally validated in mature SGs. Upper and lower quartiles and extreme points are shown. ANOVA with Tukey post hoc test p < 0.0005. (E) Principal-component analysis (PCA) of FMR1, FXR1, G3BP1, and NES proteomes with or without stress. Minimal compositional changes in the NES proteome influenced by stress (depicted as short principal component vector), in contrast to more substantial compositional changes in the FMR1, FXR1, and G3BP1 proteomes, are shown. FMR1 and FXR1 proteomes collide. (F) Circos plot of proteins identified in basal and stress conditions, per each SG-APEX bait. Approximately 52% of the proteins associated with G3BP1 under stress are already residents of the pre-stress G3BP1 complexes, whereas most of the proteins (84%) associated with FMR1/FXR1 assemble de novo with stress. (G) Unsupervised clustering of Pearson correlation values for proteomes captured by SG APEX baits during stress. High similarity was found between FMR1 and FXR1 proteomes, which are distinct from the G3BP1 and NES proteomes. R1–3 are the three experimental replicates for each APEX bait. (H) Venn diagram of FMR1, FXR1, and G3BP1 proteomes in stress conditions, with the number of proteins demarcated. (I) Fluorescence recovery of SGs after photobleaching in U2OS cells that co-express G3BP1-RFP and FXR1-YFP. Laser bleaching was defined as time 0, and snapshots were taken every 1 s. The recovery of G3BP1-RFP was monitored at ~5 s, whereas FXR1-GFP did not completely recover, even after 200 s. Mean intensity presented as the percent of the average pre-bleach signal normalized to unbleached SGs and corrected for background fluorescence. Unpaired t test with Welch’s correction *** p<0.0001. See also Video S1. (J) Dual-color stimulated emission depletion microscopy (STED) of FXR1 (green) and G3BP1 (red) in U2OS cells. 93× lens. Scale bar, 400 nm. (K) Dual-color stochastic optical reconstruction microscopy (STORM) of FXR1 (green) and G3BP1 (red) in U2OS cells, captured at 4,000 frames/channel. 60× lens. Scale bar, 500 nm. (L) Representative particle count per normalized SG position (x axis) from the STORM study. Total counts are shown on the y axis, normalized between the FXR1 (green) and G3BP1 (red) channels. Distribution of particles between channels is statistically different by ANOVA of 15 SGs (Figure S3C). p < 0.05. See also Video S2.
Figure 3.
Figure 3.. Temporal Resolution of SG Disassembly Reveals a Network of DEPs
(A) Representative micrographs depicting RFP-G3BP1 in stressed U2OS cells and 30, 60, and 120 min during recovery, after the stressor was washed out; scale bar, 10 μm. (B) Heatmap of unsupervised clustering of proteins associated with SG disassembly. Proteins specifically enriched in SG relative to the cytoplasm, if exceeding a 2-fold enrichment in FMR1-APEX/NES-APEX and p < 0.05 by Student’s t test with correction to multiple hypothesis by FDR. 224 proteins are enriched in SGs, while 202 proteins are enriched in SGs once stress is removed and disassembly dynamics ensue. (C) A list of representative disassembly-engaged proteins (DEPs) associated with different cellular pathways. (D) Boxplot analysis of IDR enrichment (%IDR; Mészáros et al., 2018) in 224 SG resident proteins or 202 DEPs. Upper and lower quartiles and extreme points are shown. Wilcoxon signed-rank test p < 0.0005. (E) Propensity to phase separate (Vernon et al., 2018) in 224 SG resident proteins or 202 DEPs. Upper and lower quartiles and extreme points are shown. Two-sided Student’s t test p < 0.0005. (F) Representative micrographs depicting GFP-G3BP1 in stressed U2OS cells and during recovery after the stressor was washed out. Cells were transfected with non-targeting siControl or specific siRNAs for the knockdown of DEPs; scale bar, 10 μm. (G) Graph quantification of SG disassembly dynamics by live GFP-G3BP1 imaging. SG area, normalized to siControl area (y axis) at 1 h after stress washout. Three experimental repeats for measurement with four different areas per well. Representative experiment from two independent live-imaging studies tested by ANOVA repeated-measurement, p < 0.05. siRNA tested that failed statistical significance were Topors, Becn1, Bag2, Kif24, Mex3c, Ranbp2, Nbr1, Hsbp1, Dst, Cep72, Xiap, Usp25, and Traf5.
Figure 4.
Figure 4.. SUMOylation Controls SG Formation and Disassembly
(A) Graphs of MS quantification of UBE2I, SAE1, TOPORS, and RANBP2 in U2OS SGs. Log2 fold change of label-free quantification (LFQ) intensity in FMR1 minus NES in stress conditions and two time points after washout. Lower bar shows levels in the cytoplasm; higher bar shows 2-fold enrichment. Data are presented as mean ± SEM. (B) Western blot analysis after FMR1-APEX activity and streptavidin pull-down of biotinylated SG proteins for detection of RANBP2, UBE2I, and FMR1-APEX as loading reference. RANBP2 and UBE2I are present in SGs in response to stress and during recovery. (C) Immunofluorescence analysis of RANBP2 and UBE2I localization in SGs. FMR1 or G3BP1 as SG markers. Merge includes demarcated nucleus (blue, DAPI). Lens ×63. Scale bar, 10 μm. (D and E) Graph quantification of SG dynamics by live GFP-G3BP1 imaging with increasing concentrations of 2D08, a SUMOylation inhibitor. Stress induced with sodium arsenite (300 μm, for 30 min), washed out, and 2D08 was introduced (D), or 2D08 was introduced 4 h prior to induction of stress with sodium arsenite (200 μm, for 30 min) (E). SG area, normalized to cellular area (y axis), as a function of time (x axis). Repeated-measures ANOVA, * p < 0.05. ** p < 0.005, *** p<0.0005. Three experimental repeats for measurement with four different areas per well. Representative experiment from more than three independent live-imaging studies. See also Video S3. (F) Representative images of anti-G3BP1 immunofluorescence in mouse embryonic stem cells, in which Ubc9 is conditionally nullified. Stress by sodium arsenite (300 μm, for 30 min) and quantification of SG/cell; scale bar, 10 μm. (G) Bar graph of SUMO enrichment (expected/observed) in the SG proteome or the cytoplasm, based on SUMO moieties, characterized by Tammasalu et al. (a list of 539 proteins; Tammsalu et al., 2014) or Hendriks et al. (a list of 3,872 proteins; Hendriks et al., 2017). Hypergeometric test p < 0.0001 for both datasets. (H) Boxplot of typical number of SUMOylated sites in total proteins identified by MS (background), cytoplasm (NES), and SG proteomes (based on Hendriks et al., 2017). p < 0.0005, Wilcoxon signed-rank test. (I) Diagram of the FMR1 protein with main functional domains based on Prieto et al. (2020). Lysine 88 (K88) in the second N-terminal Agenet domain (AGE2) and lysine 130 (K130) of the nuclear localization signal (NLS) are known to be SUMOylated and were substituted for arginines. (J and K) Graph quantification of SG dynamics by live GFP-FMR1 imaging with wild-type, K88R, and the K130R form of FMR1. Disassembly kinetics after washing out sodium arsenite (300 μm, for 30 min) (J), or SG formation kinetics after adding sodium arsenite (200 μm) (K). SG area, normalized to cellular area (y axis), as a function of time (x axis). Repeated-measures ANOVA, p < 0.0005. Three experimental repeats for measurement with four different areas per well. Representative experiment from more than three independent live-imaging studies.
Figure 5.
Figure 5.. Temporal Resolution of SG Disassembly with C9-ALS-Associated Dipeptides
(A) Representative micrographs depicting RFP-G3BP1 in stressed U2OS cells that express GFP-poly(PR)50 and during recovery, after the stressor was washed out. Scale bar, 10 μm. See also Video S4. (B) Graph quantification of SG disassembly dynamics by live Cherry-G3BP1 imaging after stressor washout with inducible GFP (control) or GFP-poly(PR)50 expression (PR50). SG number, normalized to maximal SG numbers per field (y axis) as a function of time after stress washout (x axis). Three experimental repeats for measurement with four different areas per well. Representative experiment from more than three independent live-imaging studies. ANOVA repeated-measurement p < 0.0005. (C) Diagram of study design. Inducible FMR1-APEX or NES-APEX baits, with inducible GFP (control) or GFP-poly(PR)50 expression (PR50). APEX proximity labeling activity was induced at T0 (during stress) or at three time points after washout. (D) Heatmap of unsupervised clustering of proteins that were differentially associated with SGs under normal conditions and with expression of GFP-poly(PR)50 during the course of disassembly. SG relative to cytoplasm (FMR1-APEX/NES-APEX 2-fold change) and GFP-poly(PR)50/GFP (control) by two-way ANOVA with FDR p < 0.05. (E) A subset from the 425 proteins that were differentially associated (176 enriched/249 depleted) with SG during disassembly, with expression of GFP-poly(PR)50, relative to control conditions.
Figure 6.
Figure 6.. SG SUMOylation Is Dysregulated by Poly(PR)50 and Ameliorates ALS Phenotype in Flies
(A) Graphs of MS quantification of UBE2I, SAE1 in U2OS SGs. Log2 fold change of LFQ intensity in FMR1 minus NES in stress conditions and three time points after washout. Red, GFP-poly(PR)50. Lower bar shows levels in the cytoplasm; higher bar shows 2-fold enrichment. Data are presented as mean ± SEM. Two-way ANOVA * p <0.05; **p <0.005. (B) Western blot analysis after FMR1-APEX activity and streptavidin pull-down of biotinylated SG proteins for detection of RANBP2 and FMR1-APEX as loading reference. RANBP2 are present in SGs in response to stress and during recovery. GFP-poly(PR)50 conditions inhibit RANBP2 recruitment. (C) Western blot analysis after FMR1-APEX activation and streptavidin pull-down of biotinylated SG proteins for detection of SUMO2/3 -conjugated proteins (upper blot) and loading control developed with streptavidin for detection of biotinylated proteins. Extensive SUMOylation of SG proteins seen as smear at 100–250 kDa and gradual decrease associated with disassembly. GFP-poly(PR)50 expression inhibit SUMOylation. Representative blot from more than three studies. (D) Poly(PR)36 (PR36) expression in the Drosophila melanogaster eye leads to the formation of necrotic tissue (“rough eye”). Overexpression of lesswright (Lwr) leads to a rescue of the necrosis in PR36 expressing flies (PR36 + Lwr). Scale bar, 100 μM. (E) Quantification of percentage of flies affected with either no necrosis (none), mild, moderate, severe, or very severe necrosis. The number of flies assessed in each condition is given above the bar graph. Two-tailed Fisher’s exact test comparing the number of flies with necrosis versus no necrosis (**p = 0.0015).

Similar articles

Cited by

References

    1. Alberti S, and Dormann D (2019). Liquid-liquid phase separation in disease. Annu. Rev. Genet 53, 171–194. - PubMed
    1. Anders M, Chelysheva I, Goebel I, Trenkner T, Zhou J, Mao Y, Verzini S, Qian SB, and Ignatova Z (2018). Dynamic m6A methylation facilitates mRNA triaging to stress granules. Life Sci. Alliance 1, e201800113. - PMC - PubMed
    1. Anderson P, and Kedersha N (2008). Stress granules: the Tao of RNA triage. Trends Biochem. Sci 33, 141–150. - PubMed
    1. Aulas A, Caron G, Gkogkas CG, Mohamed NV, Destroismaisons L, Sonenberg N, Leclerc N, Parker JA, and Vande Velde C (2015). G3BP1 promotes stress-induced RNA granule interactions to preserve polyadenylated mRNA. J. Cell Biol 209, 73–84. - PMC - PubMed
    1. Babu MM, Kriwacki RW, and Pappu RV (2012). Structural biology. Versatility from protein disorder. Science 337, 1460–1461. - PubMed

Publication types

MeSH terms

LinkOut - more resources