Decreased blood vessel density and endothelial cell subset dynamics during ageing of the endocrine system
- PMID: 33215738
- PMCID: PMC7780152
- DOI: 10.15252/embj.2020105242
Decreased blood vessel density and endothelial cell subset dynamics during ageing of the endocrine system
Abstract
Age-associated alterations of the hormone-secreting endocrine system cause organ dysfunction and disease states. However, the cell biology of endocrine tissue ageing remains poorly understood. Here, we perform comparative 3D imaging to understand age-related perturbations of the endothelial cell (EC) compartment in endocrine glands. Datasets of a wide range of markers highlight a decline in capillary and artery numbers, but not of perivascular cells in pancreas, testis and thyroid gland, with age in mice and humans. Further, angiogenesis and β-cell expansion in the pancreas are coupled by a distinct age-dependent subset of ECs. While this EC subpopulation supports pancreatic β cells, it declines during ageing concomitant with increased expression of the gap junction protein Gja1. EC-specific ablation of Gja1 restores β-cell expansion in the aged pancreas. These results provide a proof of concept for understanding age-related vascular changes and imply that therapeutic targeting of blood vessels may restore aged endocrine tissue function. This comprehensive data atlas offers over > 1,000 multicolour volumes for exploration and research in endocrinology, ageing, matrix and vascular biology.
Keywords: 3D imaging; ageing; endocrine system; pancreas; vasculature.
© 2020 The Authors. Published under the terms of the CC BY 4.0 license.
Conflict of interest statement
The authors declare that they have no conflict of interest.
Figures

Representative 3D tile scan images of young adrenal gland, ovary, pituitary gland, testis, pancreas and thyroid gland stained with the antibodies indicated in the panel. Scale bars are 200 µm. The white and dashed lines represent the outlines of each organ.
Representative 3D images at single‐cell resolution level of adrenal gland, ovary, pituitary gland, testis, pancreas and thyroid gland. Insets (*) indicate higher magnification images of regions with single‐cell resolution and surface rendering for all markers. Scale bars for tile scan 3D images are 200 µm; for single‐cell resolution, insets are 5 µm. The dashed lines represent the outlines of each organ.
Exemplar image illustrates the cell–cell interactome analysis with the distance estimates of CD68+ macrophages to blood vessels (Endoglin) in cortex, medulla and the transition zone (TZ) of an aged adrenal gland. The colour code indicates the distance which is very close in violet and very far in red. The scale bar is 50 µm. The white and dashed lines represent the outline of the transition zone.
Illustration of the EC interactome in adrenal glands and changes in the interactome with ageing. Cells ≤ 18 μm of distance from the blood vessels were considered to be within the interactome of blood vessels. Analysis of endothelium in the different region showed that they have distinct marker expressions. CD102pos/VCAM‐1lo/Vimentinneg, CD102neg/VCAM‐1hi/Vimentinneg and CD102neg/VCAM‐1hi/Vimentinpos ECs were located in cortex, transition and medulla regions, respectively, in young and aged adrenal glands. Their interactions in young and aged adrenal glands with PDGFRβ+ and NG2+ pericytes, PDGFRα+ mesenchymal cells, α‐SMA+ pericytes, Desmin+ stromal cells, Decorin+ stromal cells, CXCR4+ stromal cells, FSP1+ fibroblasts, CD34+ hematopoietic cells, F4/80+ macrophages and CD68+ macrophages are shown. Interaction with Decorin expressing stromal cells is only observed in ageing.
Schematic illustration of the study design with 3D spatial proteomic data and cell–cell interactome database strategy, analysis of age‐dependent changes and validation of protein expression followed by functional analysis.
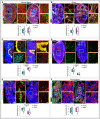
Young and aged adrenal gland immunolabelled with HSPG2, NG2 and Podocalyxin. Higher magnification insets show cortex (Co) and medulla (Me). Combined box and whiskers, and scatter plot with quantification of vessel density in young and aged adrenal glands.
Young and aged ovary immunolabelled with Sca‐1, PDGFRβ and Emcn. Higher magnification insets show cortex and medulla. Combo plot with quantification of vessel density in young and aged ovary.
Young (10 weeks old) and aged pituitary gland immunolabelled with ESM‐1, collagen IV and Emcn. Insets with higher magnifications of pars distalis and pars nervosa regions. Combo plot shows quantification of vessel density.
Young and aged testis immunolabelled with Tie‐2 and HSPG2. Higher magnifications of cortex and medulla. Combo plot shows quantification of vessel density.
Young and aged pancreas immunolabelled with SM22α and Endoglin. Insets representative of higher magnifications of regions in young and aged pancreas. Combo plot shows quantification of vessel density.
Young and aged thyroid gland immunolabelled with CXCR4, laminin and Emcn. Combo plot shows quantification of vessel density in young and aged thyroid glands. Insets: periphery and centre of the thyroid gland.
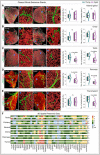
Whole‐endocrine gland imaging of young and aged adrenal glands immunolabelled with α‐SMA and Emcn acquired on a light‐sheet microscope. Asterisks indicate higher magnifications of regions in adrenal glands from young and aged mice. Combined box and whiskers, and scatter plots with quantifications of vessel density and numbers of arteries.
Whole‐endocrine gland light‐sheet imaging‐based 3D images of young and aged ovaries stained with α‐SMA and Emcn. Asterisks represent higher magnifications of regions in ovaries from young and aged mice. Combo plots show quantifications of vessel density and numbers of arteries in young and aged ovary.
3D images of whole cleared young and aged testes stained with α‐SMA and Emcn. Asterisks indicate higher magnifications of indicated regions. Combo plots show quantifications of vessel density and numbers of arteries.
Light‐sheet imaging of whole cleared young and aged pancreases immunolabelled with α‐SMA and Emcn. Asterisks indicate higher magnifications of regions. Combo plots with quantifications of vessel density and numbers of arteries in young and aged pancreas.
3D images acquired on a light‐sheet microscope of whole cleared young and aged thyroid glands stained with α‐SMA and Emcn. Asterisks indicate higher magnifications of regions. Combo plots show quantifications of vessel density and numbers of arteries in young and aged thyroid glands.
Heatmap of 3D spatial proteomic data showing qualitative analysis of differences in cell type markers and matrix expressions between young and aged murine endocrine glands. The colour code based on immunolabelling intensities indicates very high expression in red, high expression in yellow, medium in light green, low in dark green and no expression in grey.
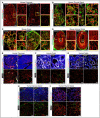
Representative 3D images with PDGFRβ and Emcn expressions in young and aged pancreas. In the inset are represented with higher magnification positive cells for PDGFRβ located in the proximity of blood vessels in periphery and centre regions of the pancreas.
3D tile scan images of young and aged thyroid gland stained with PDGFRβ and Emcn in periphery and centre regions of the thyroid gland.
3D images of young and aged ovary staining with PDGFRβ and HSPG2 in cortex and medulla regions.
Tile scan 3D images show PDGFRβ and Emcn in young and aged adrenal gland. Insets with higher magnification areas of cortex and medulla regions of the adrenal gland.
Representative 3D images with immunostaining for α‐SMA, PDGFRβ and Endoglin in young and aged human pancreas.
3D images of young and aged human ovary staining with α‐SMA, PDGFRβ and CD31.
3D images of young and aged human testis after α‐SMA, PDGFRβ and Endoglin immunostaining.
3D images of young and aged human adrenal gland after α‐SMA, PDGFRβ and CD31 immunostaining.
Representative 3D images with α‐SMA, PDGFRβ and CD31 immunostaining in young and aged human thyroid gland.
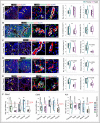
3D images (left) with α‐SMA and CD31 immunostaining in young and aged human adrenal gland. Middle panel images surface rendered for α‐SMA, Vimentin and CD31. Arrowheads indicate arteries. Combo plots with quantifications of the number of arteries and vessel density.
3D images of young and aged human ovary immunolabelled with α‐SMA, Vimentin and CD31. Images in the middle panel with a surface rendered for all the channels. Arrowheads indicate arteries. Combo plots with quantifications of the number of arteries and vessel density.
Representative 3D images (left) of young and aged human testis with SM22α and Endoglin immunostaining. Middle panel images surface rendered for all the channels. Arrowheads indicate arteries. Combo plots show quantifications of the number of arteries and vessel density.
3D images from young and aged human pancreas staining with α‐SMA, Vimentin and Endoglin. 3D images (middle) with a surface rendering for all the channels. Arrowheads indicate arteries. Combined box and whiskers, and scatter plots with the quantifications of the number of arteries and vessel density.
Representative 3D images (left) show α‐SMA and CD31 immunostaining in young and aged human thyroid gland. Middle panel images surface rendered for α‐SMA, Vimentin and CD31. Arrowheads indicate arteries. Combo plots with quantifications of the number of arteries and vessel density.
qPCR analysis of Efnb2, Cdh5 and Kdr expression (normalized to Actb) in aged human endocrine glands compared to young glands.
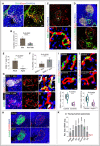
Representative 3D images show CD31 and Emcn immunostaining in young pancreatic islet. Arrowheads represent the connected capillaries at the interface of the pancreatic islet and exocrine tissue.
Bar graph with the quantification of capillary diameter inside the pancreatic islets and in the non‐islet region of the young pancreas. Data represent mean ± s.d. (n = 5), P‐value and two‐tailed unpaired t‐test.
3D images of young pancreas staining with ESM‐1 and Emcn. Inset (*) shows higher magnifications with a surface rendering for ESM‐1 and Emcn immunostaining.
Images with insulin, α‐SMA and Emcn in the adult pancreas.
Bar graph with the percentage of ESM‐1+ pancreatic islets in adult (17‐week‐old) and aged mice. Data represent mean ± s.d. (n = 4), P‐value and two‐tailed unpaired t‐test.
Bar graph with the quantification of the percentage of VEGFA per islet (f.u) in ESM‐1+ and ESM‐1‐ pancreatic islets from adult mice. Data represent mean ± s.d. (n = 5), P‐value and two‐tailed unpaired t‐test.
Representative 3D images with the VEGFA expression in the ESM‐1+ and ESM‐1‐ pancreatic islets from 17‐week‐old mice. Insets (* and #) show higher magnifications with surface rendering for ESM‐1, VEGFA and Emcn immunostaining. Nuclei stained with TO‐PRO‐3.
Representative 3D images of young and aged pancreatic islets stained with insulin and PLVAP.
Representative high magnification 3D images with a surface rendering for ESM‐1 and Emcn in sunitinib‐treated and control pancreatic islets. Combo plot shows the quantification of ESM‐1+ cell numbers per islet (f.u) counted on thick murine pancreatic sections. (n = 5), P‐values and two‐tailed unpaired t‐tests.
High magnification images with a surface rendering for ESM‐1 and Emcn immunostaining in Vegfr2 iΔEC mutant and control pancreatic islets. Combo plot shows the quantification of ESM‐1+ cell numbers per islet (f.u). (n = 5), P‐values and two‐tailed unpaired t‐tests.
qPCR analysis of Pdgfa, Pdgfb, Igf1, Igf2, Cxcl12, Hgf and Kitl expression (normalized to Actb) in young human pancreas compared to the aged human pancreas. Data represent mean ± s.d. (n = 4), P‐values and two‐tailed unpaired t‐tests.

Representative 3D images with insulin and Caveolin‐1 immunostaining in pancreatic islets from young mice. Combined box and whiskers, and scatter plots shows the vessel density analysis in the pancreatic islets and non‐islet areas from young and aged mice.
Representative 3D images with adult pancreatic islets immunolabelled with Ki67 and VE‐Cadherin. Inset (*) shows single‐cell resolution and surface rendering for all the channels.
Representative tile scan 3D image with insulin, ESM‐1 and Emcn immunostaining in 19‐week‐old mouse pancreas. Higher magnification at the top of the right panel shows the ESM‐1+ pancreatic islets. Inset (*) shows single‐cell resolution and surface rendering for ESM‐1 and Emcn. The white and dashed line in the tile scan image represents the outline of one lobe of the pancreas, and the dashed lines in the inset represent the pancreatic islet.
Representative 3D images show CD31 and Emcn expressions in young pancreas. Insets (* and #) show higher magnifications of capillaries in the pancreatic islets and non‐islet areas.
Representative flow cytometry dot plots showing CD31+ Emcnhi and CD31+ Emcnlo EC populations in young and aged pancreas. Combo plot shows the population of CD31+ Emcnhi ECs in young and aged pancreas.
Representative 3D images (left) with insulin, Ki67 and VE‐Cadherin immunostaining on young and aged pancreas. 3D images (middle) show CXCR4, Ki67 and VE‐Cadherin in young and aged pancreatic islet. Insets (yellow asterisks) show single‐cell resolution and surface rendering for Ki67 and CXCR4. Arrowheads represent Ki67+ β‐cell.
Combo plot shows the quantification of Ki67+ β cells normalized to the total number of β cells per islet in juvenile (3 weeks old), adult (12 weeks old) and aged (55 weeks old) pancreatic islets.
Representative 3D images with insulin, CD31 and Emcn immunostaining in young and aged pancreas. Combo plot shows the CD31+ Emcnhi vessel density in juvenile, adult and aged pancreatic islets.
Representative 3D images of adult (10 weeks old) and aged pancreas (55 weeks old) with insulin and VEGFA immunostaining. Combo plot (middle) shows the VEGFA as determined by ELISA in isolated islets from 10‐week‐old adult and 55‐week‐old aged mice. Combo plot (right) shows the percentage of VEGFA per islet (f.u).
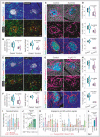
Representative 3D images of pancreas from adult (18 weeks old) sunitinib‐treated and control mice with insulin, CD31 and Emcn immunostaining.
Combined box and whiskers, and scatter plot (left) shows the quantification of CD31+ Emcnhi vessel density in sunitinib‐treated and control pancreatic islets. Combo plot (right) shows ELISA‐based analysis of insulin.
Representative 3D images (upper panel) show CXCR4, Ki67 and VE‐Cadherin in sunitinib‐treated and control pancreatic islet. 3D images (bottom) show sunitinib‐treated and control pancreatic islets immunolabelled with insulin and VE‐Cadherin.
Combo plot (top) shows the percentage of CXCR4+ β cells per islet in sunitinib‐treated and control pancreatic islet. Combo plot (middle) shows the quantification of Ki67+ β cells normalized to the total number of β‐cell numbers. Combo plot (bottom) shows the percentage of insulin+ β cells per islet.
Representative 3D images of pancreas from adult Vegfr2 iΔEC mutant and control mice with insulin, CD31 and Emcn immunostainings.
Combo plot (left) with quantification of CD31+ Emcnhi vessel density in Vegfr2 iΔEC and control pancreatic islet. Right combo plot with insulin estimation in pancreas by ELISA.
Representative 3D images in the upper panel show CXCR4, Ki67 and VE‐Cadherin in islets from Vegfr2 iΔEC mutant and control mice. 3D images (lower panel) show Vegfr2 iΔEC mutant and control islets immunolabelled with insulin and VE‐Cadherin.
Combo plot (top) shows the percentage of CXCR4+ β cells per islet in Vegfr2 iΔEC mutant and control pancreatic islet. Combo plot (middle) shows the quantification of Ki67+ β cells normalized to the number of β cells. Combo plot (bottom) shows the percentage of insulin+ β cells per islet.
Graph shows qPCR analysis of Pdgfa, Pdgfb, Igf1, Igf2, Cxcl12, Hgf and Kitl expression (normalized to Actb) in purified CD31+ Emcnhi ECs compared to CD31+ Emcnlo ECs.
Bar graph with the quantification of Ki67+ β‐cell numbers per islet (f.u) and Ki67+ EC numbers per islet (f.u). Forty‐five pancreatic islets were analysed and quantified from 9 young mice.
Bar graphs show qPCR analysis of Dll4, Emcn, Kdr, Flt4, Sele, Mmp9, Plxnd1, Robo4, Unc5b, Cdh5, Cldn5, Gja1, Gja4, Icam1, Icam2, Jam3, Ntn1, Ngf, Ocln, Pecam1, Tjp1, Tjp2, Tjp3 and Vcam1 expression (normalized to Actb) in purified CD31+ Emcnhi ECs compared to CD31+ Emcnlo ECs from murine pancreas.
Graph shows qPCR analysis of Gja1 expression (normalized to Actb) in purified CD31+ Emcnhi ECs from juvenile, adult and aged murine pancreas.

Representative tile scan 3D images with α‐SMA, Isolectin, FABP4 and Emcn in the pancreas from 17‐week‐old Gja1 iΔEC mutant and control mice. Insets show higher magnifications of regions.
Box whiskers, and scatter plot (left) shows the quantification of CD31+ Emcnhi vessel density in Gja1 iΔEC mutant and control pancreatic islets. (n = 7), P‐value and two‐tailed unpaired t‐test. Combo plot (right) shows the quantification of P‐Histone H3+ EC numbers per islet (f.u) counted on thick murine pancreatic sections. (n = 5), P‐value and two‐tailed unpaired t‐test.
3D images show CD31 and Emcn immunostaining in the Gja1 iΔEC mutant and control pancreas. The scale bars are 50 µm.
Combined violin, scatter and sample distribution plot shows the quantification of β‐cell mass (%) in pancreatic islets from Gja1 iΔEC and control mice. Data represent mean ± s.d. (n = 140 islets from seven pancreas), P‐value and two‐tailed unpaired t‐test.
Representative 3D images with immunostaining of α‐SMA, insulin and VE‐Cadherin in the pancreatic islets from Gja1 iΔEC and control mice. The scale bars are 50 µm.
Combo plot (left) shows insulin measurement in lysate of pancreas by ELISA. Combo plot (right) shows the percentage of insulin+ β cells per islet in Gja1 iΔEC mutant and control mice. (n = 5), P‐values and two‐tailed unpaired t‐tests.
Representative 3D images of ESM‐1 and Caveolin‐1 in pancreatic islets from Gja1 iΔEC and control mice. Insets (* and #) show higher magnifications with surface rendering for ESM‐1 and Caveolin‐1 immunostaining. Combo plot with the quantification of ESM‐1+ cell numbers per islet (f.u). (n = 5), P‐value and two‐tailed unpaired t‐test. The scale bars for the 3D images are 50 µm, and 5 µm for the higher magnifications with single‐cell resolution images.
3D images with CXCR4 and Emcn immunostaining in Gja1 iΔEC and control pancreas. The scale bars are 50 µm.
Representative 3D images show CXCR4, Ki67 and VE‐Cadherin immunostaining in Gja1 iΔEC and control pancreas. The scale bars are 50 µm.
Combo plots show the percentage of CXCR4+ β cells per islet and Ki67+ β cells normalized to the total number of β cells per islet in Gja1 iΔEC mutant versus the littermate control mice. (n = 5), P‐values and two‐tailed unpaired t‐tests.
Box whiskers, and scatter plot (top) shows the quantification of CD31+ Emcnhi vessel density in aged Gja1 iΔEC mutant and control pancreatic islets. Data represent mean ± s.d. (n = 4), P‐value and two‐tailed unpaired t‐test. Combo plot (below) shows the quantification of β cells on thick murine pancreatic sections. Data represent mean ± s.d. (n = 4), P‐value and two‐tailed unpaired t‐test.
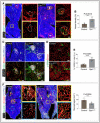
Representative tile scan 3D images with insulin, ESM‐1 and VE‐Cadherin immunostaining on Gja1 iΔEC and control murine pancreas. Insets show higher magnifications of ESM‐1+ and ESM‐1‐ pancreatic islets. The white and dashed lines in the tile scan images represent the outlines of one lobe of the pancreas, and the dashed lines in the insets represent the pancreatic islets.
Bar graph with the quantification of vessel density in Gja1 iΔEC mutant and control pancreas. Data represent mean ± s.d. (n = 5), P‐value and two‐tailed unpaired t‐test.
3D images with VEGFA, CD31 and Emcn staining in Gja1 iΔEC and control pancreas. The scale bars are 50 µm. The dashed lines represent the pancreatic islets.
Images with α‐SMA and Emcn in pancreas from Gja1 iΔEC and littermate control mice. The scale bars are 50 µm.
Bar graph with the quantification of the percentage of VEGFA per islet (f.u) in pancreas from Gja1 iΔEC and littermate control mice. Data represent mean ± s.d. (n = 5), P‐values and two‐tailed unpaired t‐tests.
Representative tile scan 3D images with staining of CD68, Caveolin‐1 and Endoglin in pancreas from Gja1 iΔEC and littermate control mice. Bar graph with the quantification of macrophage numbers in pancreas from Gja1 iΔEC and control mice. Data represent mean ± s.d. (n = 5), P‐value and two‐tailed unpaired t‐test. The white and dashed lines represent the outlines of the pancreas.
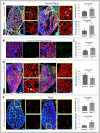
Representative tile scan 3D images with staining for α‐SMA, Isolectin, Decorin and Emcn in adult (16 weeks old) thyroid gland from Gja1 iΔEC and littermate control mice. Bar graph (top right panel) with the quantification of vessel density in Gja1 iΔEC mutant and control thyroid gland. Bar graph (bottom right panel) with the level of thyroxine in the lysate of thyroid glands from Gja1 iΔEC and control mice determined by ELISA. Data represent mean ± s.d. (n = 5), P‐values and two‐tailed unpaired t‐tests.
3D images with P‐Histone H3 and Emcn staining in Gja1 iΔEC and control thyroid gland. The scale bars are 50 µm.
Bar graph with the quantification of P‐Histone H3+ EC numbers per 1mm2 sample areas in thyroid glands from Gja1 iΔEC and littermate control mice. Data represent mean ± s.d. (n = 5), P‐value and two‐tailed unpaired t‐test.
Representative tile scan 3D images with staining of CD68, Caveolin‐1 and Endoglin in thyroid gland from Gja1 iΔEC and littermate control mice. Bar graph with the quantification of macrophage numbers in Gja1 iΔEC and control thyroid gland. Data represent mean ± s.d. (n = 5), P‐value and two‐tailed unpaired t‐test.
Representative tile scan 3D images with staining of HSPG2, Isolectin and Endoglin in testis from Gja1 iΔEC and littermate control mice. Bar graph (top right panel) with the quantification of vessel density in Gja1 iΔEC mutant and control testis. Data represent mean ± s.d. (n = 5), P‐value and two‐tailed unpaired t‐test. Bar graph (bottom right panel) with the levels of testosterone in the lysate of testes from Gja1 iΔEC and control mice determined by ELISA. Data represent mean ± s.d. (n = 4), P‐value and two‐tailed unpaired t‐test.
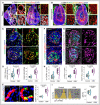
Representative tile scan 3D images with staining of α‐SMA, Isolectin, Decorin and Emcn in the ovary from Gja1 iΔEC and littermate control mice.
Representative 3D images of adrenal gland from Gja1 iΔEC mutant and control mice with α‐SMA, Isolectin, FABP4 and Emcn immunostaining.
Representative 3D images of pancreas from aged carbenoxolone (CBX)‐treated and control mice with CD31 and Emcn immunostaining.
Combined box and whiskers, and scatter plot (left) shows the quantification of CD31+ Emcnhi vessel density in aged CBX‐treated and control pancreatic islets. Combo plot (right) shows the quantification of insulin in lysates of pancreases determined by ELISA. (n = 5), P‐values and two‐tailed unpaired t‐tests.
Representative high magnification 3D images with surface rendering for ESM‐1 and Emcn immunostaining in aged CBX‐treated and control pancreatic islets. Combo plot demonstrates the quantification of ESM‐1+ cell numbers per islet (f.u) in aged CBX‐treated and control mice. (n = 5), P‐value and two‐tailed unpaired t‐test.
Representative 3D images illustrate CXCR4 and VE‐Cadherin immunostaining on pancreas sections from aged CBX‐treated and control mice.
Representative 3D images show CXCR4, Ki67 and VE‐Cadherin in aged CBX‐treated and control pancreatic islet.
Combo plots illustrate the quantifications of the percentage of CXCR4+ β cells per islet, Ki67+ β cells normalized to the total number of β cells per islet and Ki67+ EC numbers per islet (f.u) in pancreas from aged CBX‐treated and control mice. (n = 5), P‐values and two‐tailed unpaired t‐tests.
Representative flow cytometry plot (left) shows the population of p27 in ECs from aged CBX‐treated and control pancreas. Combo plot shows the quantification of p27 (%) in ECs from aged CBX‐treated and control pancreas. (n = 5), P‐value and two‐tailed unpaired t‐test.
Similar articles
-
Age and the endocrine system.Clin Geriatr Med. 1985 Feb;1(1):223-50. Clin Geriatr Med. 1985. PMID: 3913501 Review.
-
Endocrinology in older people.Acta Obstet Gynecol Scand Suppl. 1987;140:19-22. doi: 10.3109/00016348709156473. Acta Obstet Gynecol Scand Suppl. 1987. PMID: 3475932 No abstract available.
-
General principles of endocrine function after the sixth decade.Curr Ther Endocrinol Metab. 1994;5:579-84. Curr Ther Endocrinol Metab. 1994. PMID: 7704797 No abstract available.
-
Development of a 3D atlas of the embryonic pancreas for topological and quantitative analysis of heterologous cell interactions.Development. 2022 Feb 1;149(3):dev199655. doi: 10.1242/dev.199655. Epub 2022 Feb 4. Development. 2022. PMID: 35037942 Free PMC article.
-
The endocrine system and ageing.J Pathol. 2007 Jan;211(2):173-80. doi: 10.1002/path.2110. J Pathol. 2007. PMID: 17200939 Review.
Cited by
-
Recent advances of the mammalian target of rapamycin signaling in mesenchymal stem cells.Front Genet. 2022 Aug 30;13:970699. doi: 10.3389/fgene.2022.970699. eCollection 2022. Front Genet. 2022. PMID: 36110206 Free PMC article. Review.
-
Emerging Roles of Circular RNAs in Vascular Smooth Muscle Cell Dysfunction.Front Genet. 2022 Jan 19;12:749296. doi: 10.3389/fgene.2021.749296. eCollection 2021. Front Genet. 2022. PMID: 35126447 Free PMC article. Review.
-
Heterogeneity and Dynamics of Vasculature in the Endocrine System During Aging and Disease.Front Physiol. 2021 Mar 9;12:624928. doi: 10.3389/fphys.2021.624928. eCollection 2021. Front Physiol. 2021. PMID: 33767633 Free PMC article. Review.
-
Recombinant Human Arresten and Canstatin Inhibit Angiogenic Behaviors of HUVECs via Inhibiting the PI3K/Akt Signaling Pathway.Int J Mol Sci. 2022 Aug 12;23(16):8995. doi: 10.3390/ijms23168995. Int J Mol Sci. 2022. PMID: 36012259 Free PMC article.
-
Effects of different preservation schemes on isolated rat artery.J Cell Mol Med. 2023 Aug;27(16):2362-2371. doi: 10.1111/jcmm.17822. Epub 2023 Jun 25. J Cell Mol Med. 2023. PMID: 37357501 Free PMC article.
References
-
- Adams RH, Alitalo K (2007) Molecular regulation of angiogenesis and lymphangiogenesis. Nat Rev Mol Cell Biol 8: 464–478 - PubMed
-
- Alagpulinsa DA, Cao JJ, Sobell D, Poznansky MC (2019) Harnessing CXCL12 signaling to protect and preserve functional β‐cell mass and for cell replacement in type 1 diabetes. Pharmacol Ther 193: 63–74 - PubMed
Publication types
MeSH terms
Grants and funding
LinkOut - more resources
Full Text Sources
Medical
Molecular Biology Databases
Miscellaneous

