. 2020 Nov 17;12(11):3407.
doi: 10.3390/cancers12113407.

Integrity of the Antiviral STING-mediated DNA Sensing in Tumor Cells Is Required to Sustain the Immunotherapeutic Efficacy of Herpes Simplex Oncolytic Virus

Affiliations

Integrity of the Antiviral STING-mediated DNA Sensing in Tumor Cells Is Required to Sustain the Immunotherapeutic Efficacy of Herpes Simplex Oncolytic Virus

Guendalina Froechlich et al. Cancers (Basel). .

Abstract

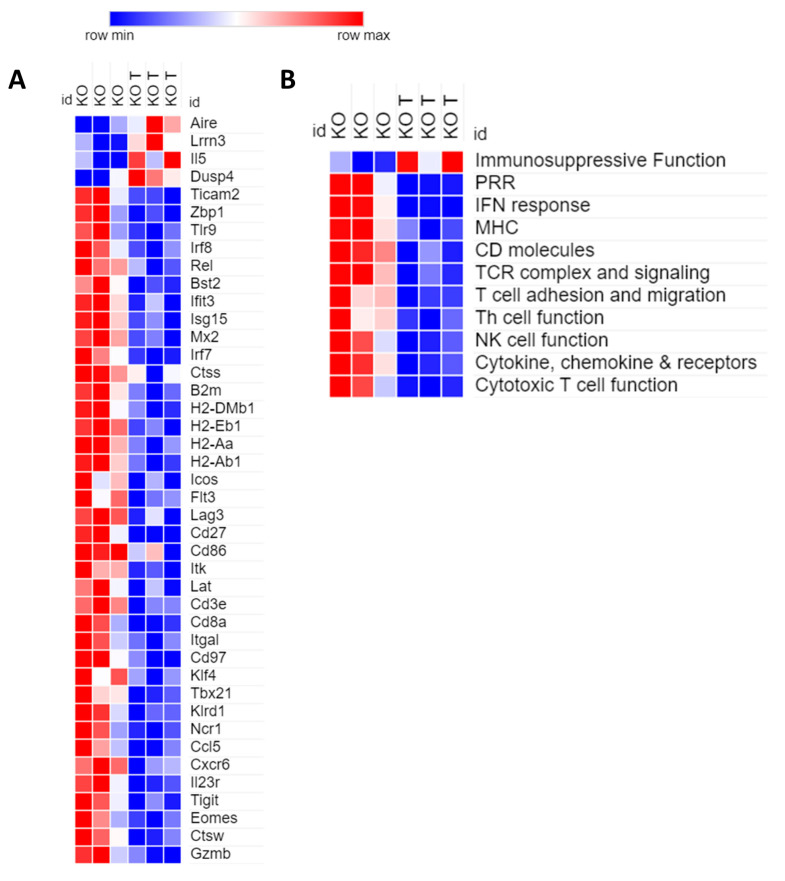
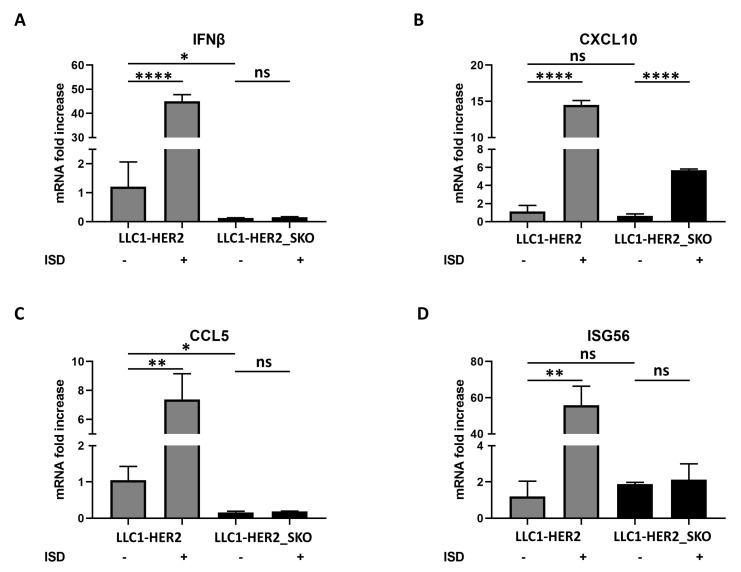
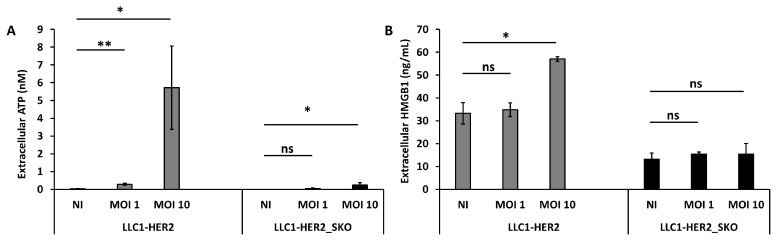
The dichotomic contribution of cancer cell lysis and tumor immunogenicity is considered essential for effective oncovirotherapy, suggesting that the innate antiviral immune response is a hurdle for efficacy of oncolytic viruses. However, emerging evidence is resizing this view. By sensing cytosolic DNA, the cyclic GMP-AMP synthase (cGAS) and stimulator of interferon genes (STING) axis can both counteract viral spread and contribute to the elicitation of adaptive immunity via type I interferon responses. In this paper, we analyzed the tumor-resident function of Sting-mediated DNA sensing in a combined approach of oncovirotherapy and PD-1 immune checkpoint blockade, in an immunocompetent murine model. While supporting increased lytic potential by oncolytic HER2-retargeted HSV-1 in vitro and in vivo, Sting-knockout tumors showed molecular signatures of an immunosuppressive tumor microenvironment. These signatures were correspondingly associated with ineffectiveness of the combination therapy in a model of established tumors. Results suggest that the impairment in antiviral response of Sting-knockout tumors, while favoring viral replication, is not able to elicit an adequate immunotherapeutic effect, due to lack of immunogenic cell death and the inability of Sting-knockout cancer cells to promote anti-tumor adaptive immune responses. Accordingly, we propose that antiviral, tumor-resident Sting provides fundamental contributions to immunotherapeutic efficacy of oncolytic viruses.

Keywords: HSV-1; Herpes simplex; MB21D; RNA profiling; STING knockout; TMEM173; immunogenic cell death; oncolytic virus.


Conflict of interest statement

The Authors, Alfredo Nicosia and Elisa Scarselli are Founders and shareholders of Nouscom S.R.L. Emanuele Sasso, Gabriella Cotugno, Anna Morena D’Alise, Guido Leoni, Maria De Lucia, Francesca Langone are employees of Nouscom S.R.L. All the other Authors declare no competing interests.

Figures

Figure 1
Figure 1
Molecular characterization of Sting knockout cancer cell lines. (A) Analysis of human HER2 display on cell surface of LLC1-HER2 (left) and CT26_HER2 (right) by FACS analysis; an unrelated antibody was used as negative control. (B) The graphic shows Tmem173 (transcript ID ENSMUST00000115728.4) gene organization. Full and empty boxes represent, respectively, coding and untranslated exons. The positions of guide RNAs used for CRISPR/Cas9 genome editing to generate Sting knockout cancer cell lines are indicated by arrows. (C) Western blot analysis of Sting protein in CT26-HER2, LLC1_HER2 and their Sting knockout cell lines counterparts. Gamma tubulin was used as standard. (D) PCR screening of CT26-HER2_SKO and LLC1_HER2_SKO cell lines to assess the absence of eGFP and Cas9 residues in genomic DNA. Cas9/eGFP-encoding vector was used as positive control (C+). Genomic DNA from parental CT26-HER2 and LLC-HER2 cell lines was used as negative control (C−). (E) Cell doubling per day were assessed for Sting wild-type (grey lines) and Sting knockout (black lines) LLC1 (left) and CT26 (right) cell lines. The differences in cell doubling were calculated by Student’s t-test and were not statistically significant (Ns) to each passage.
Figure 2
Figure 2
Comparison of viral effectiveness in Sting knockout vs. parental wild-type cancer cell lines. (A,B) Spread of eGFP-encoding R-LM113 was evaluated by fluorescence microscopy in STING wild-type and knockout LLC1 (5×) (A) and CT26 (10×) (B) cell lines. (C) The lytic activity of R-LM113 was evaluated by extracellular LDH (lactate dehydrogenase) release in cell supernatants over the time course of infection (72, 96 and 120 h) in LLC1-HER2 (grey lines) and LLC1-HER2_SKO (black lines) at two different concentrations of viral particles (1 multiplicity of infection (MOI) continuous lines and 0.5 MOI dashed lines). (D) The same experiments performed in panel C were recapitulated in CT26-HER2 and CT26-HER2_SKO. All the infections were performed as biological replicates. The statistical significances for experiments described in panel c and d were calculated by Student’s t-test comparing MOI-matched Sting wild-type vs. knockout cell lines. The p-values were 0.00115 and 0.000219, respectively, for 1 and 0.5 MOI in panel C; 0.01583, 0.008543, respectively, for 1 and 0.5 MOI in panel D. (E,F) Evaluation of viral replication of R-LM113 in Sting wild-type and knockout LLC1 (E) and CT26 (F) infected with 0.3 PFU/cell. The qPCR-TaqMan analysis revealed the genome copies per mL (gc/mL) produced by the virus over time (24, 48, 72 h for LLC1 and 72, 96, 20 h for CT26). The statistical significances for experiments described in panel e and f were calculated by Student’s t-test comparing Sting wild-type vs. knockout cell lines. The p-values calculated on biological replicates were 0.0013 for LLC1 cell line and 0.0005 for CT26 cell line. (G,H) Analysis of the R-LM113 viral titers obtained in Sting wild-type and knockout LLC1 (G) and CT26 (H) cells infected with 0.3 PFU/cell. Plaque assay was performed as biological replicate. The statistical significance for experiments described in panel g and h was calculated by Student’s t-test comparing Sting wild-type vs. knockout cell lines. The p-values were 0.038 for LLC1 cell line and 0.02 for CT26 cell line. p < 0.05 *; p < 0.005 **; p < 0.0005 ***.
Figure 3
Figure 3
Tumor-resident STING influences oncolytic R-LM113 activity in vivo. (A) Evaluation of in vivo intratumoral viral replication in Sting wild-type and knockout LLC1 cell lines at 48 and 72 h after administration of R-LM113 (1E+08 viral PFU). Viral genome copies were quantified by TaqMan PCR and were normalized to total ng of extracted DNA. The statistical significance was calculated by two-way ANOVA (0.0148). (B) Schematic representation of the in vivo experimental setting. LLC1-HER2 wild-type and knockout cells were implanted subcutaneously into hHER2-transgenic/tolerant mice. When tumors became established (mean 110 mm3), mice were randomized according to tumor size. Mice received 5 intratumoral injections of R-LM113 (1E+08 PFU/inj) at 0, 2, 4, 7, 10 days and six systemic administrations of PD-1 blocking antibody at days 0, 3, 7,10, 14, 17. (C) LLC-HER2 tumor growth in corresponding untreated (empty rhombuses) and combination treatment (red rhombuses). Dashed lines indicate complete responder mice. R-LM113 and PD-1 blockade monotherapy does not have in vivo efficacy [32,33,34] (D) LLC-HER2_SKO tumor growth for the three experimental groups: untreated (empty square), α-mPD-1 (blue) and combination (red square). For c and d, each line represents the tumor growth for individual mouse. The statistical significance for experiments described in panel c was calculated by Fisher’s and was 0.03. (E) Median tumor volume with SEM for mice presented in panel d.
Figure 4
Figure 4
Sting loss affects immunogenic tumor remodeling according to NanoString RNA profiling. (A) The panel reports the heat map for representative differentially regulated genes between Sting knockout untreated (KO) and treated (KO T) tumors. Values were normalized by nSolver software and filtered according to p-value (<0.05) and fold (±1.5). (B) The genes were grouped in 11 immune-relevant categories to obtain an overview of the gained trend from NanoString analysis.
Figure 5
Figure 5
Induction of IFN-I cascade by DNA sensing in Sting knockout and parental cancer cell lines. LLC1-HER2 cells and Sting knockout counterparts were stimulated in vitro by interferon stimulatory DNA (ISD). Ten hours post treatment, Ifnb (A), Cxcl10 (B), Ccl5 (C) and Isg56 (D) transcripts were assessed by real-time PCR. The relative abundance of target RNAs was evaluated in relation to Actinb transcript. The statistical significances for experiments described in Figure 5 were calculated by Student’s t-test. Panel A, the p-values were 1.2E-5 comparing untreated and treated LLC1-HER2 and 0.01 comparing Sting wild-type vs. knockout cell lines. Panel B, the p-values were 1.2E-5 comparing untreated and treated LLC1-HER2 and 3E-6 comparing untreated and treated LLC1-HER2_SKO. Panel C, 0.003 comparing untreated and treated LLC1-HER2; 0.015 comparing Sting wild-type vs. knockout cell lines. Panel D, 0.0008 comparing untreated and treated LLC1-HER2. Ns indicates statistically not significant differences calculated by Student’s t-test. p <0.05 *; p <0.005 **; p <0.00005 ****.
Figure 6
Figure 6
Sting expression in tumor cells is essential to induce oncolytic virus-mediated immunogenic cell death. Evaluation of extracellular ATP (A) and HMGB1 (B) released in supernatant of mock or OV (oncolytic virus)-infected LLC1-HER2 and Sting knockout cells. Viral doses are indicated in each panel (1 and 10 PFU/cell). Infections were performed as biological replicates. The statistical significances for experiments described in Figure 6 were calculated by Student’s t-test. Panel A, the p-values were: 0.0008 comparing untreated and 1 MOI LLC1-HER2; 0.01 comparing untreated and 10 MOI LLC1-HER2_SKO. Panel B, the p-value was 0.0199 comparing untreated and 10 MOI LLC1-HER2. Ns indicates statistically not significant differences calculated by Student’s t-test. p < 0.05 *; p < 0.005 **.

Similar articles

Cited by

References

    1. Kaufman H.L., Kohlhapp F.J., Zloza A. Oncolytic Viruses: A New Class of Immunotherapy Drugs. Nat. Rev. Drug Discov. 2015;14:642–662. doi: 10.1038/nrd4663. Erratum in 2016, 15, 660. - DOI - PMC - PubMed
    1. Ribas A., Dummer R., Puzanov I., Vander Walde A., Andtbacka R.H.I., Michielin O., Olszanksi A.J., Malvehy J., Cebon J., Fernandez E., et al. Oncolytic Virotherapy Promotes Intratumoral T Cell Infiltration and Improves Anti-PD-1 Immunotherapy. Cell. 2017;170:1109–1119. doi: 10.1016/j.cell.2017.08.027. - DOI - PMC - PubMed
    1. Sivanandam V., LaRocca C.J., Chen N.G., Fong Y., Warner S.G. Oncolytic Viruses and Immune Checkpoint Inhibition: The Best of Both Worlds. Mol. Ther. Oncolytics. 2019;13:93–106. doi: 10.1016/j.omto.2019.04.003. - DOI - PMC - PubMed
    1. Russell L., Peng K.W., Russell S.J., Diaz R.M. Oncolytic Viruses: Priming Time for Cancer Immunotherapy. BioDrugs. 2019;33:485–501. doi: 10.1007/s40259-019-00367-0. - DOI - PMC - PubMed
    1. Twumasi-Boateng K., Pettigrew J.L., Kwok Y.Y.E., Bell J.C., Nelson B.H. Oncolytic Viruses as Engineering Platforms for Combination Immunotherapy. Nat. Rev. Cancer. 2018;18:419–432. doi: 10.1038/s41568-018-0009-4. - DOI - PubMed