. 2020 Nov 25;183(5):1312-1324.e10.
doi: 10.1016/j.cell.2020.10.047. Epub 2020 Nov 18.

Commensal Microbiota Modulation of Natural Resistance to Virus Infection

Affiliations

Commensal Microbiota Modulation of Natural Resistance to Virus Infection

Kailyn L Stefan et al. Cell. .

Abstract

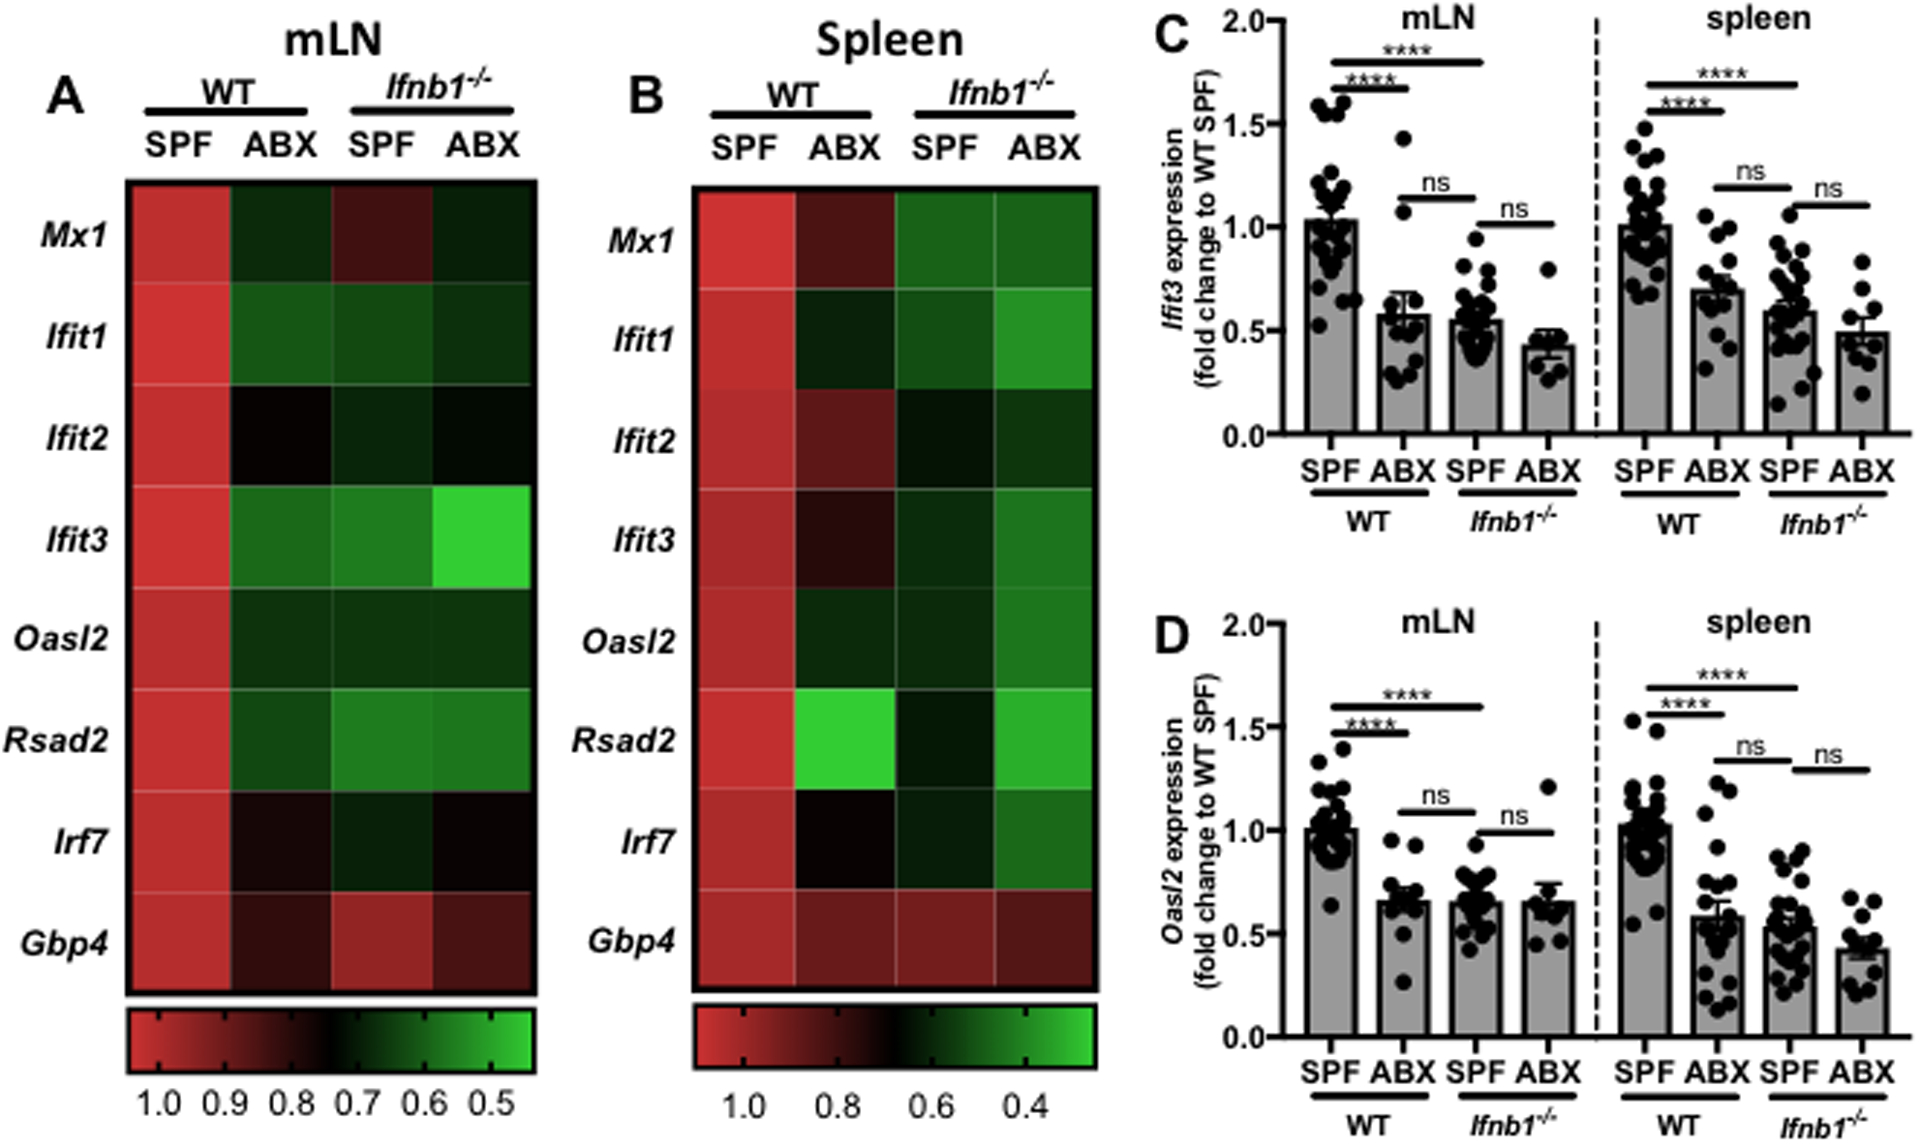
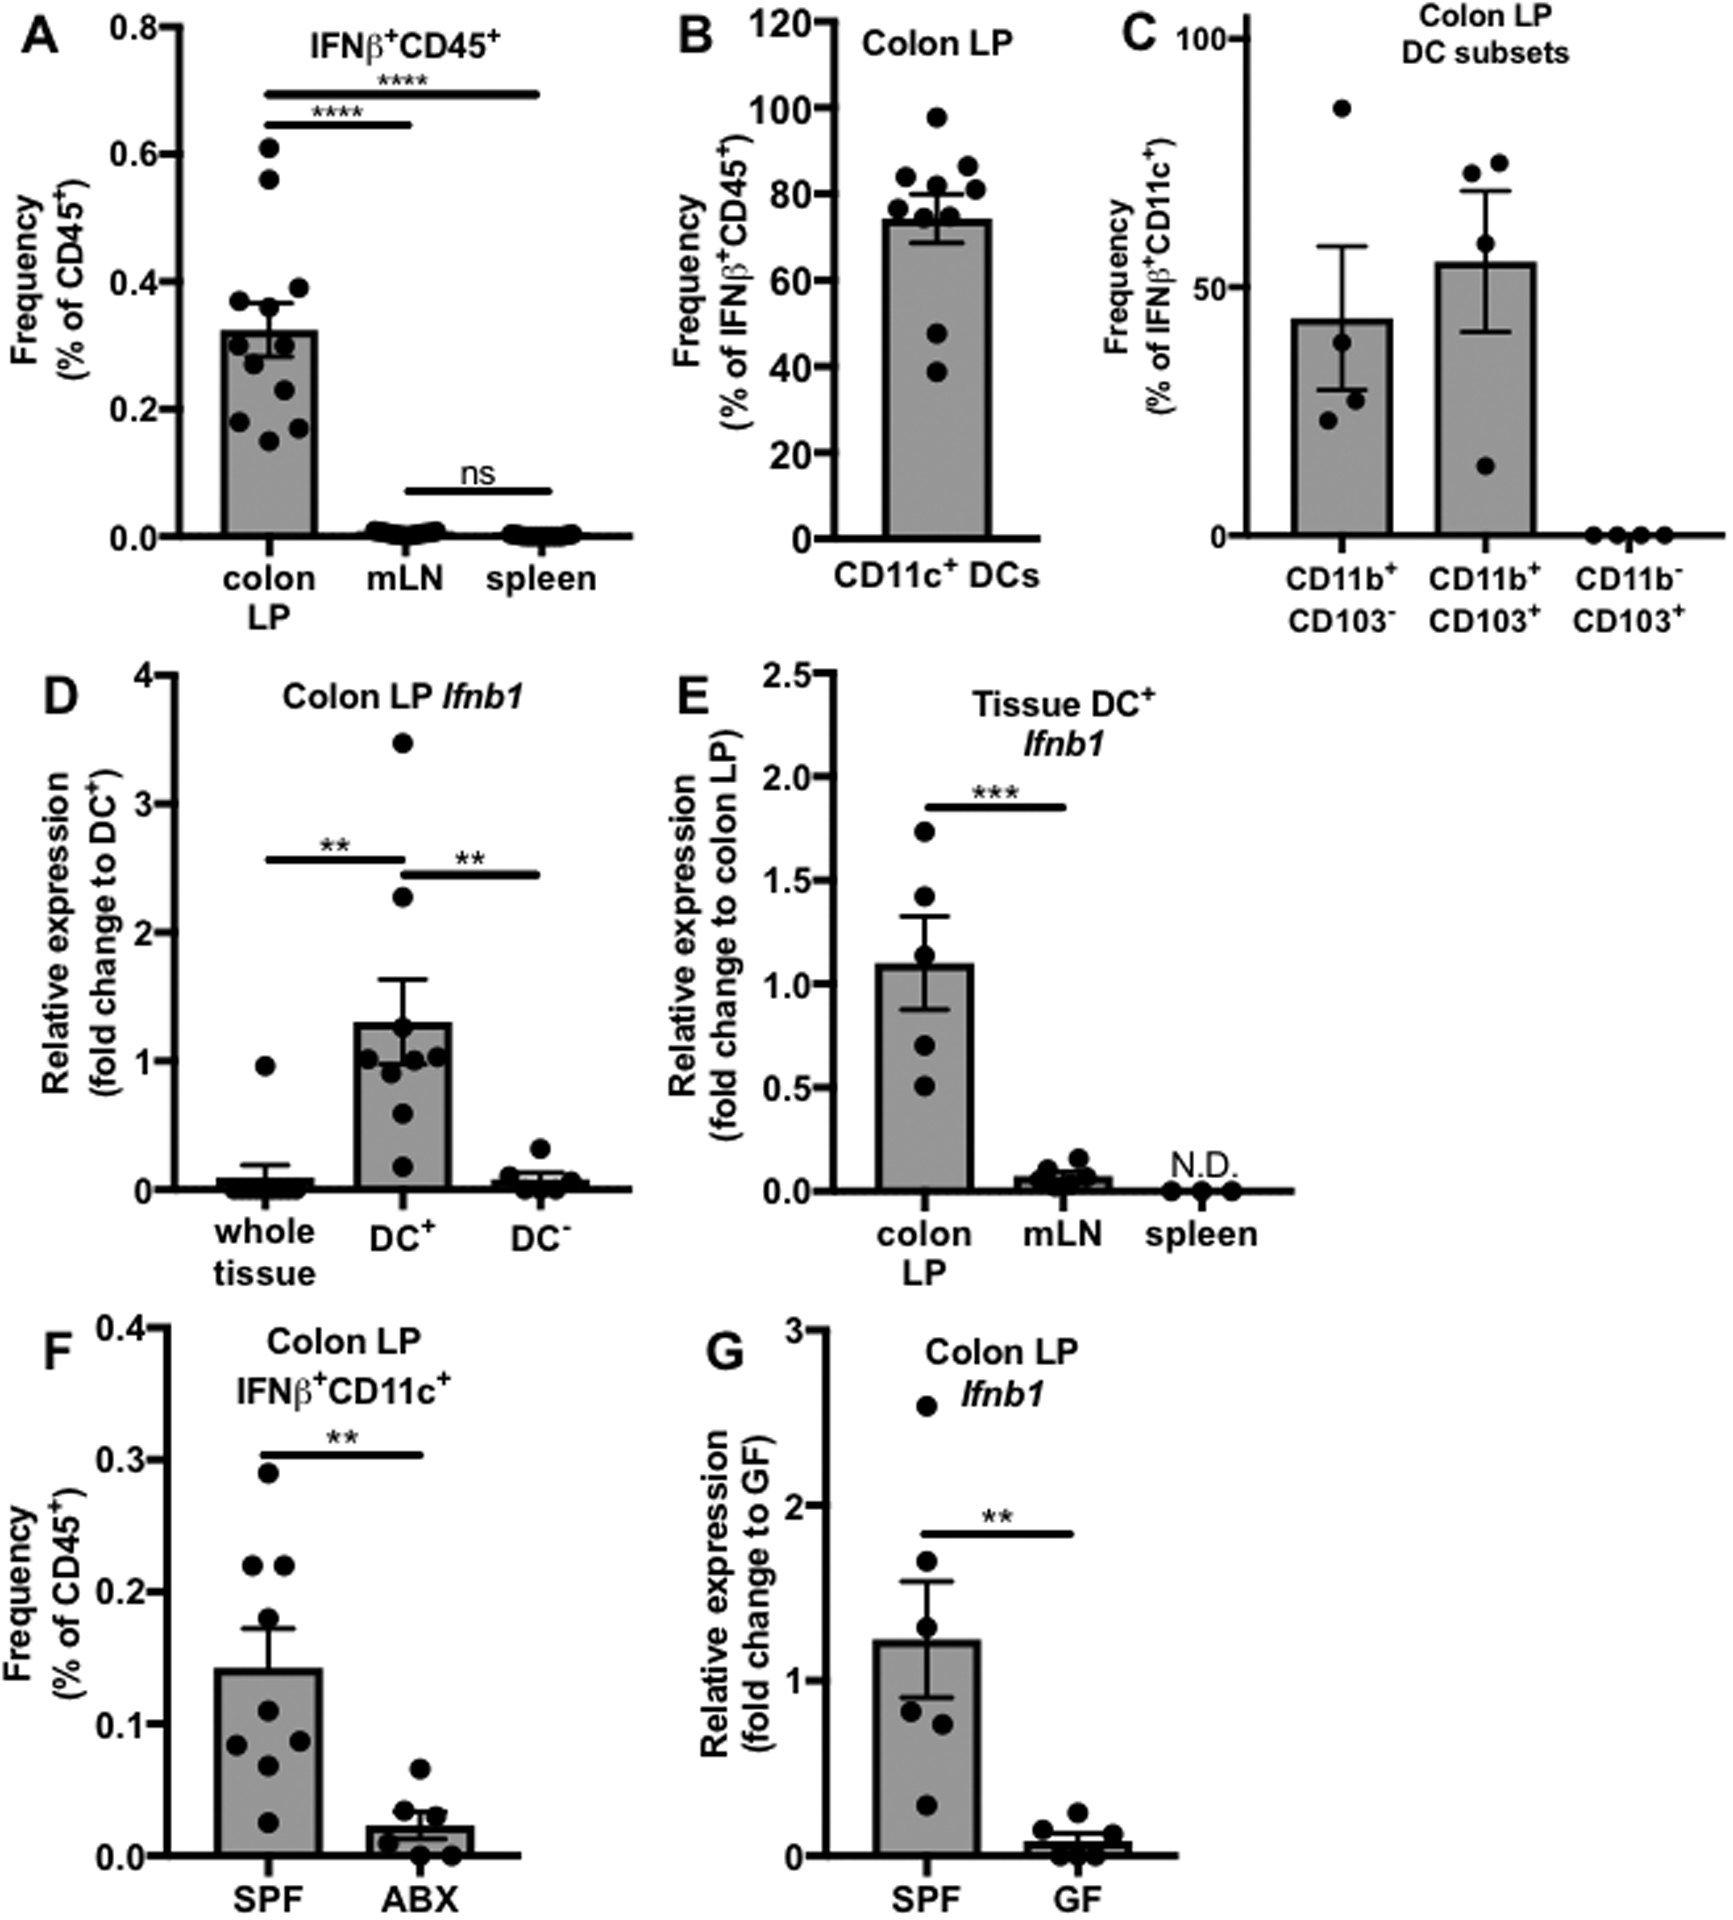
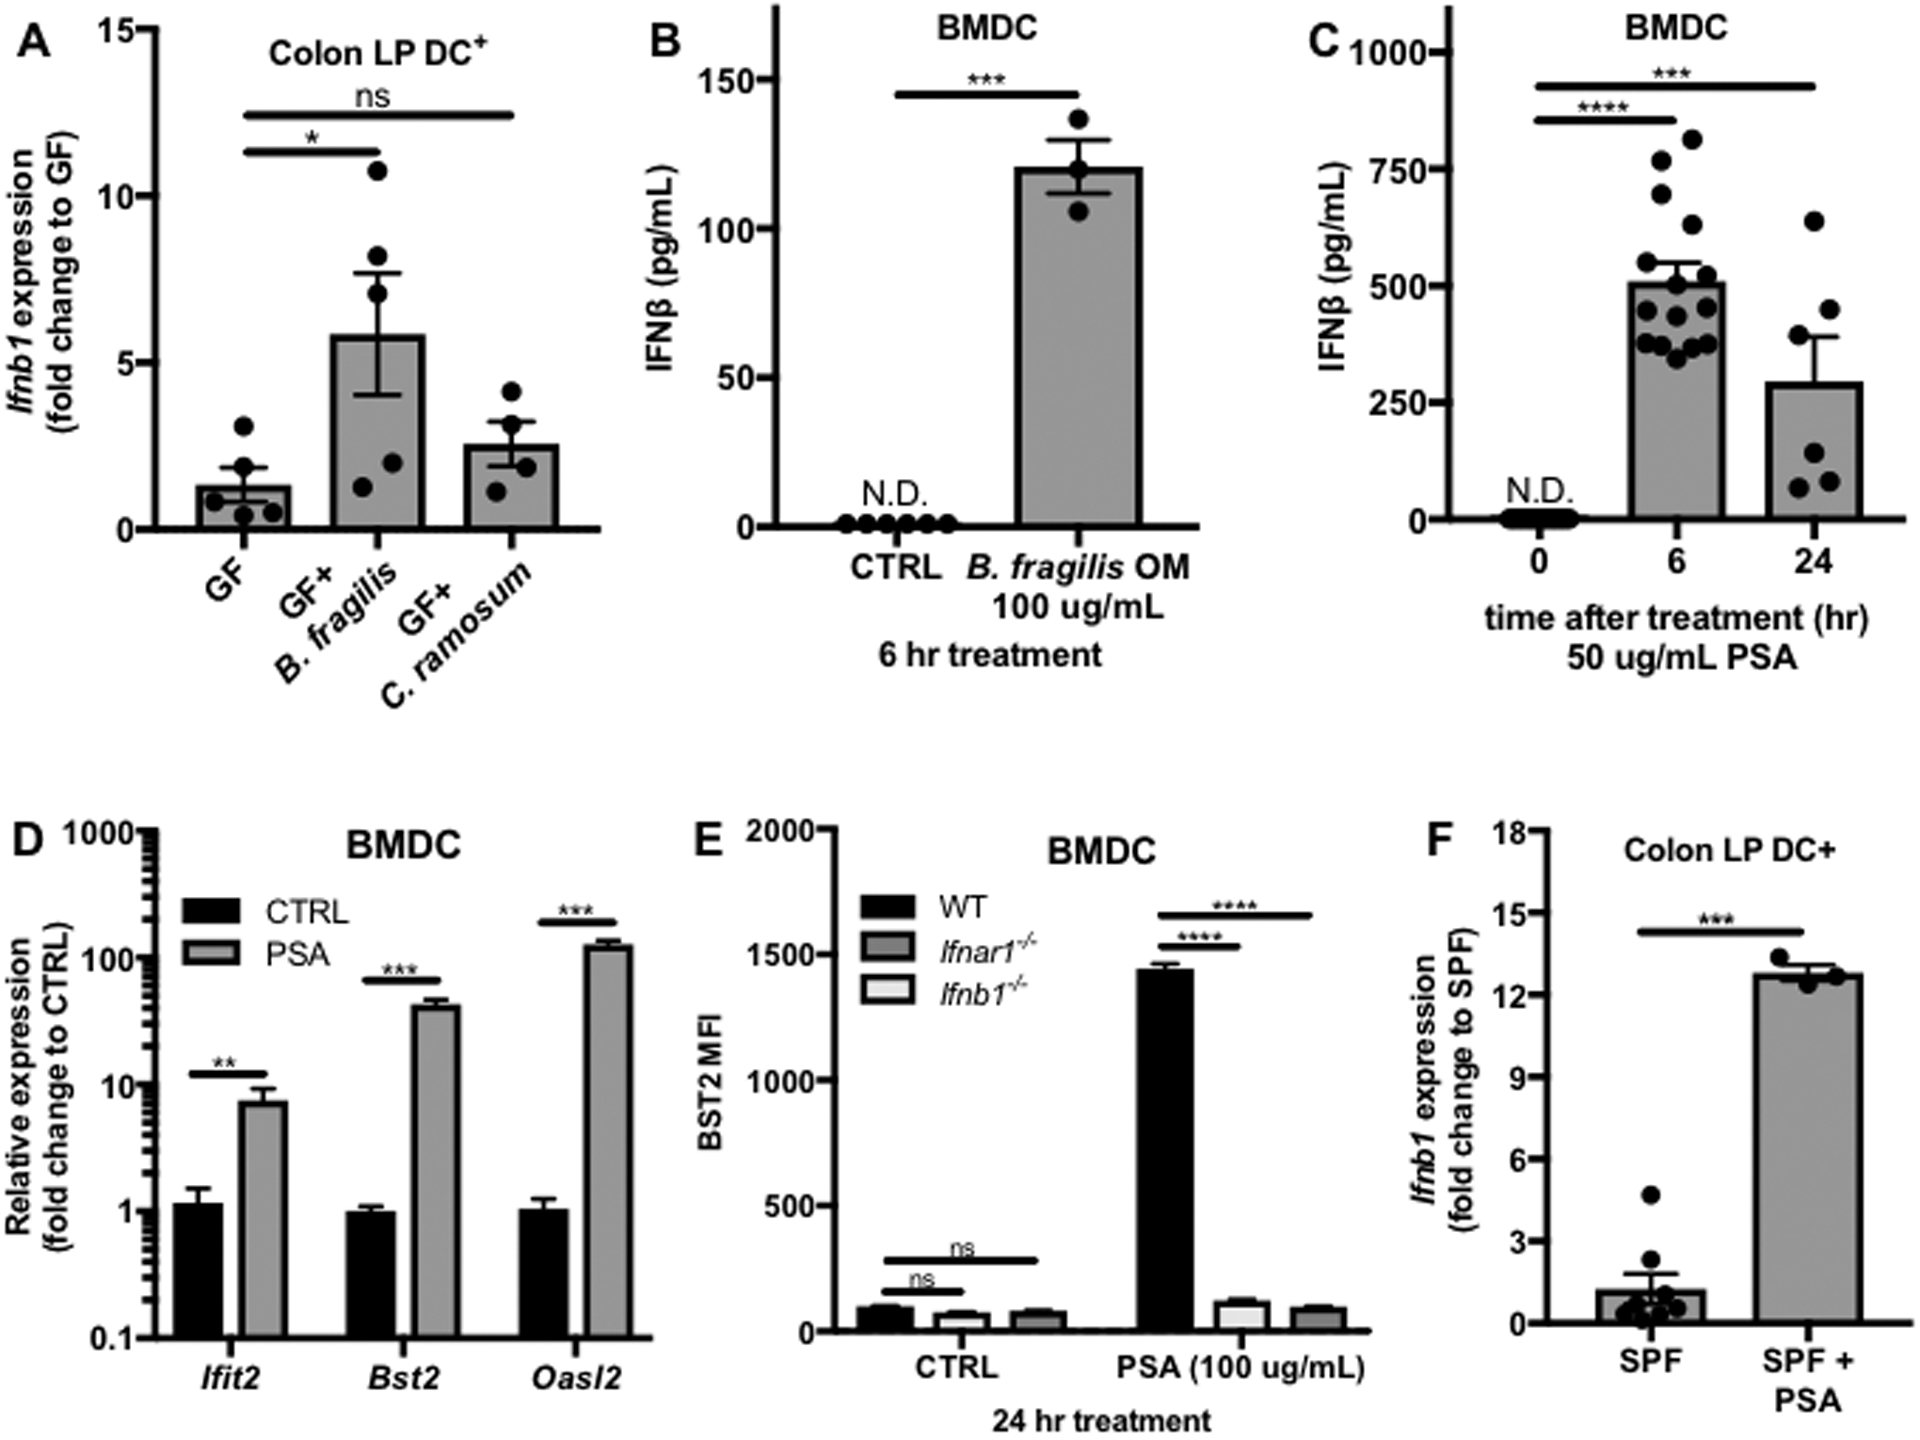
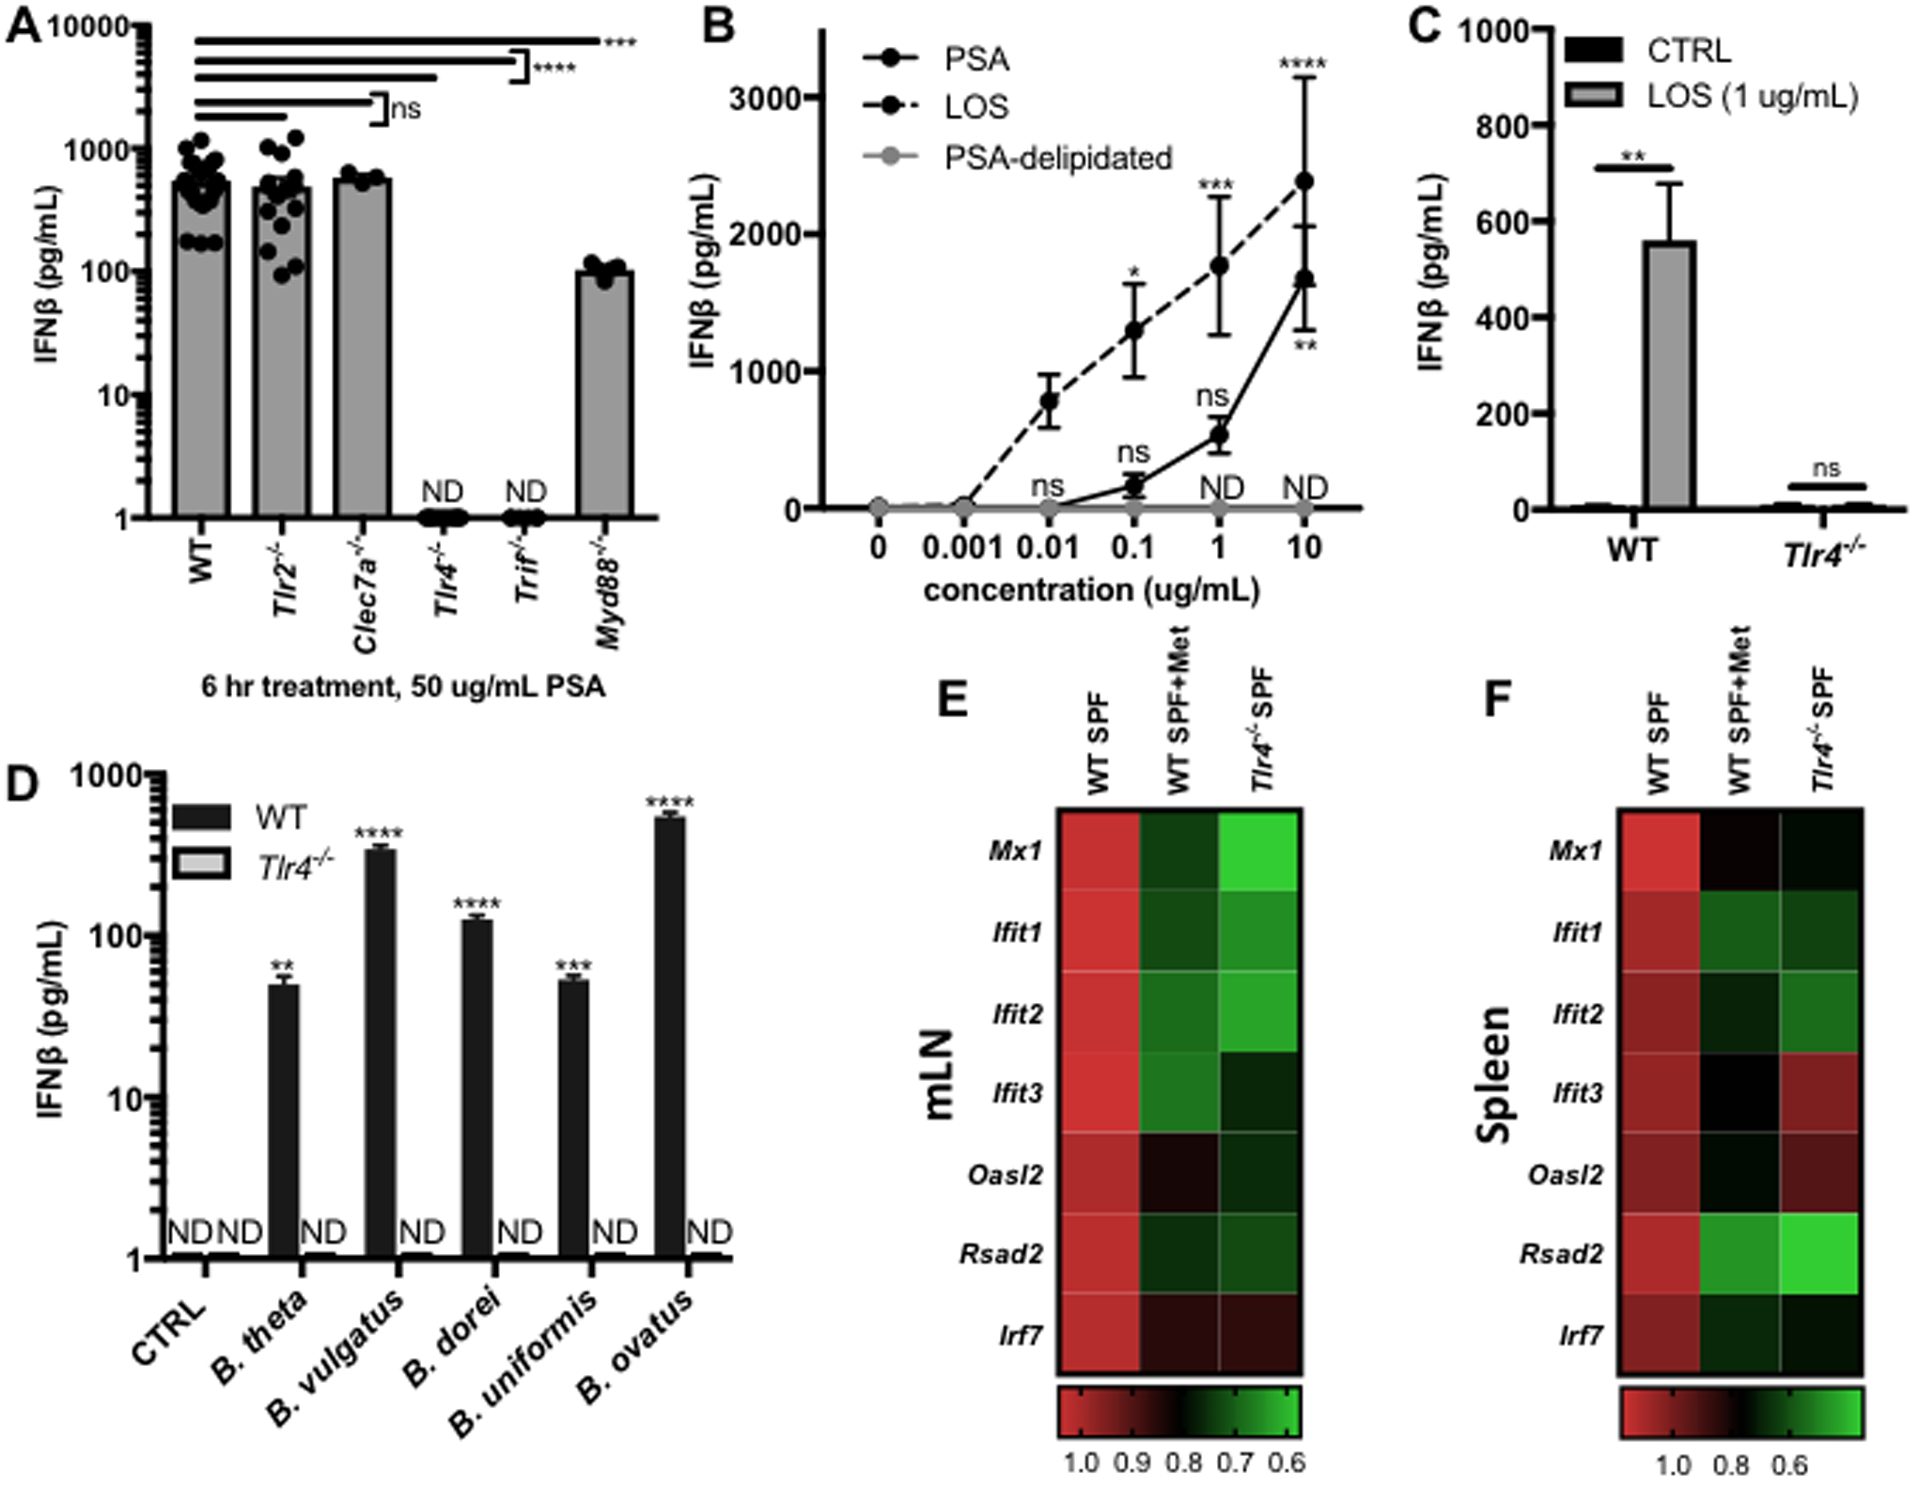
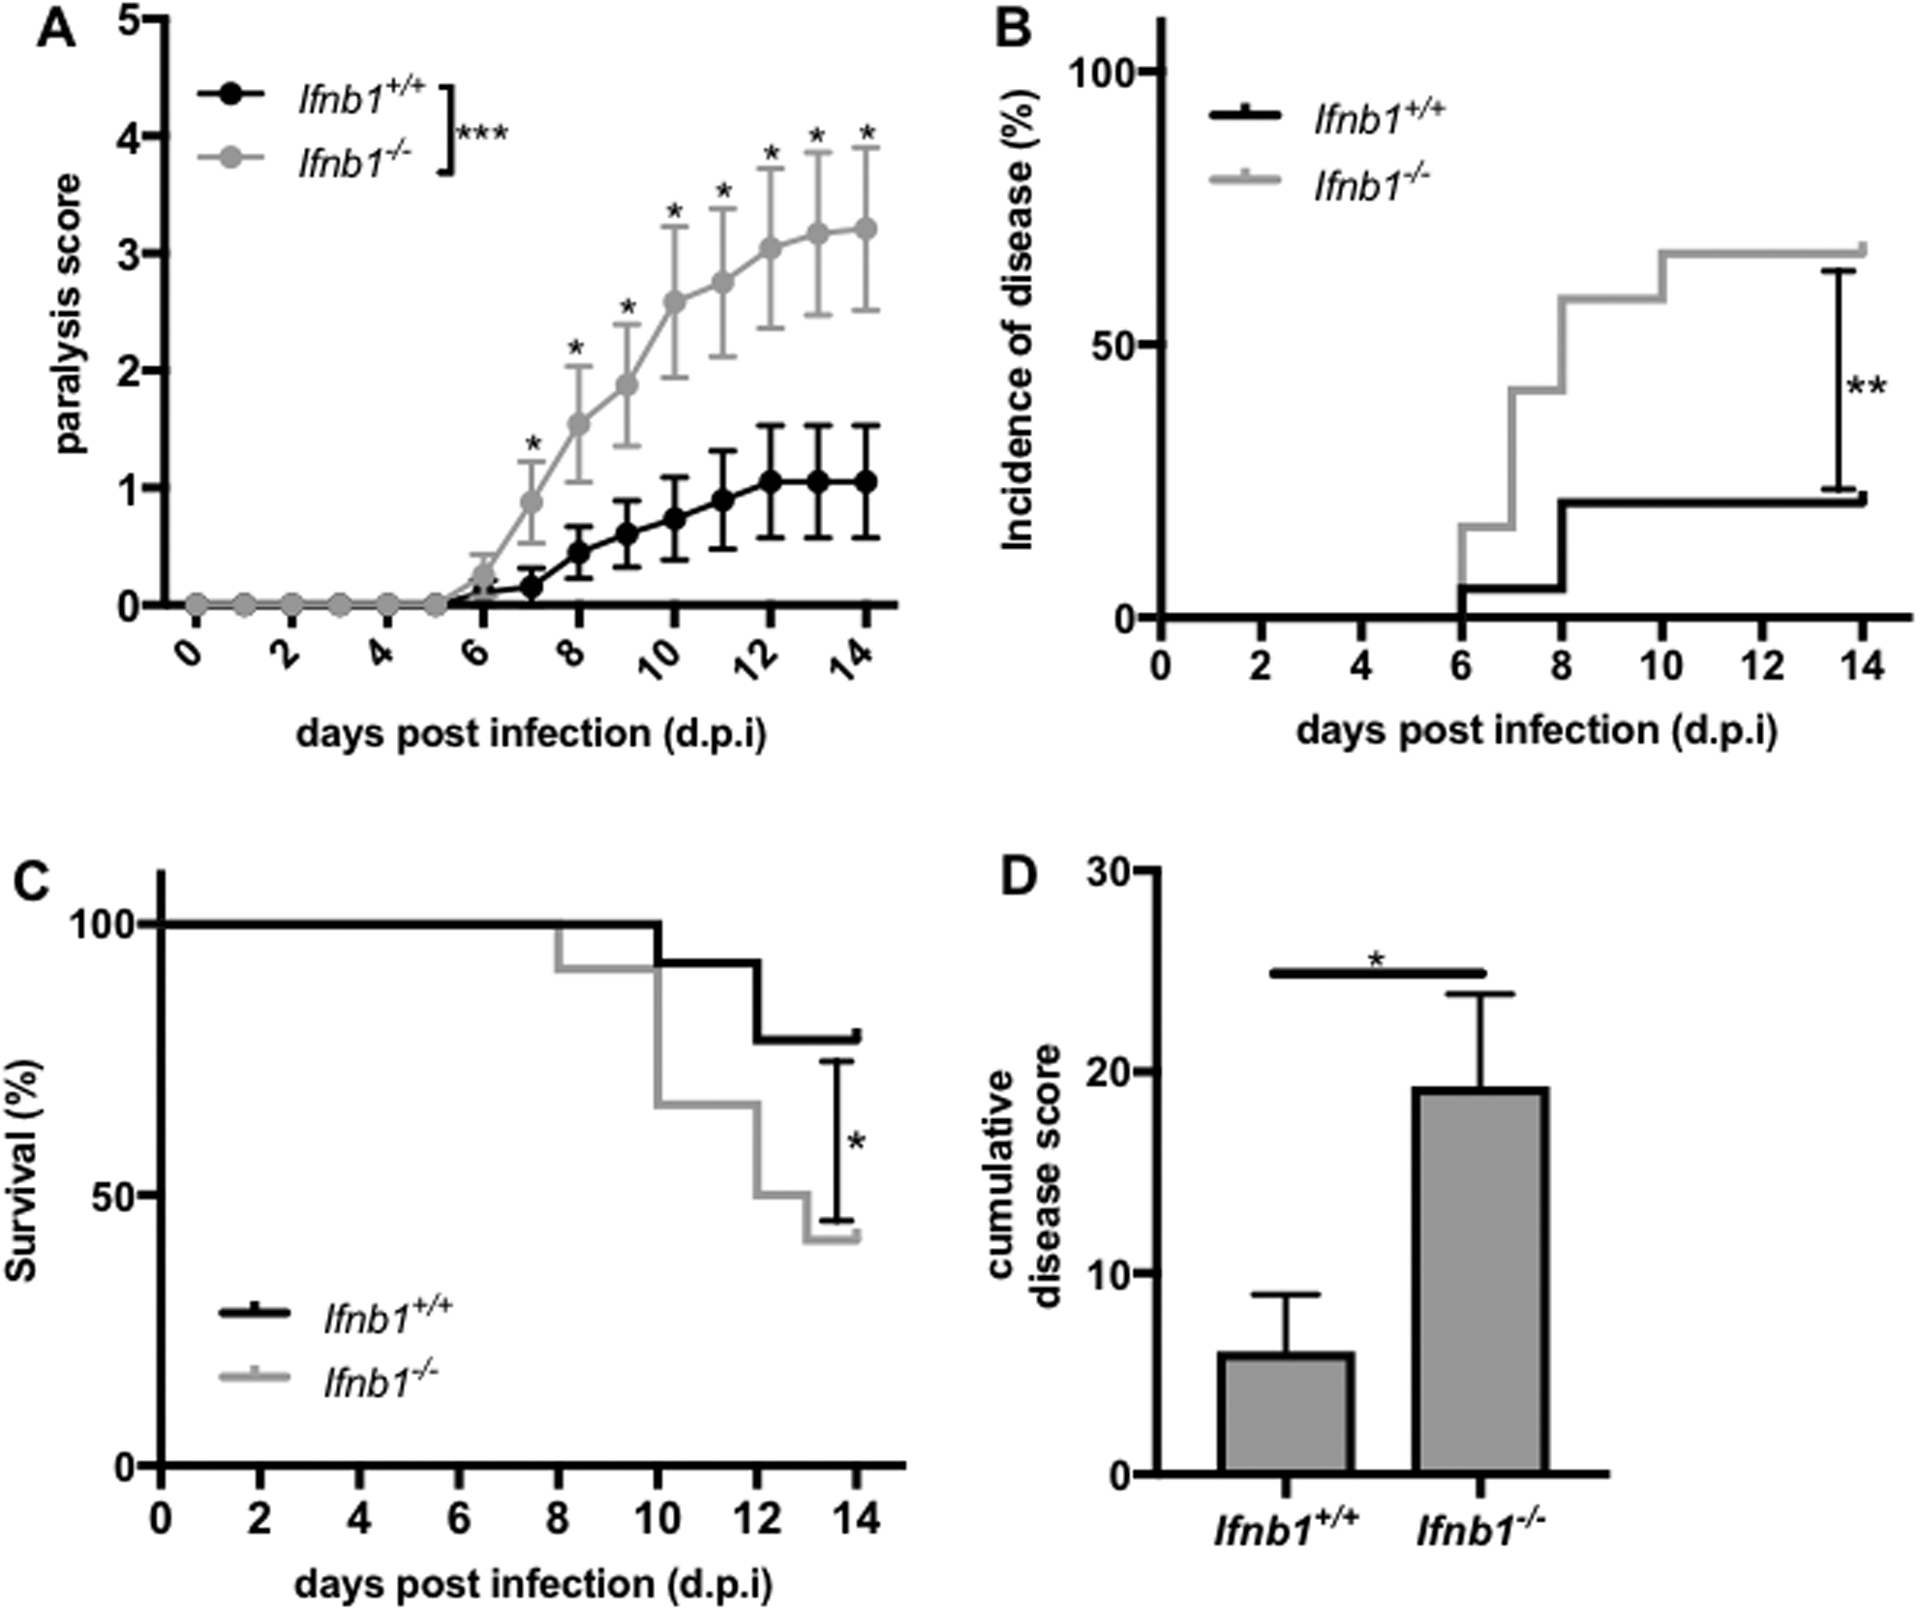
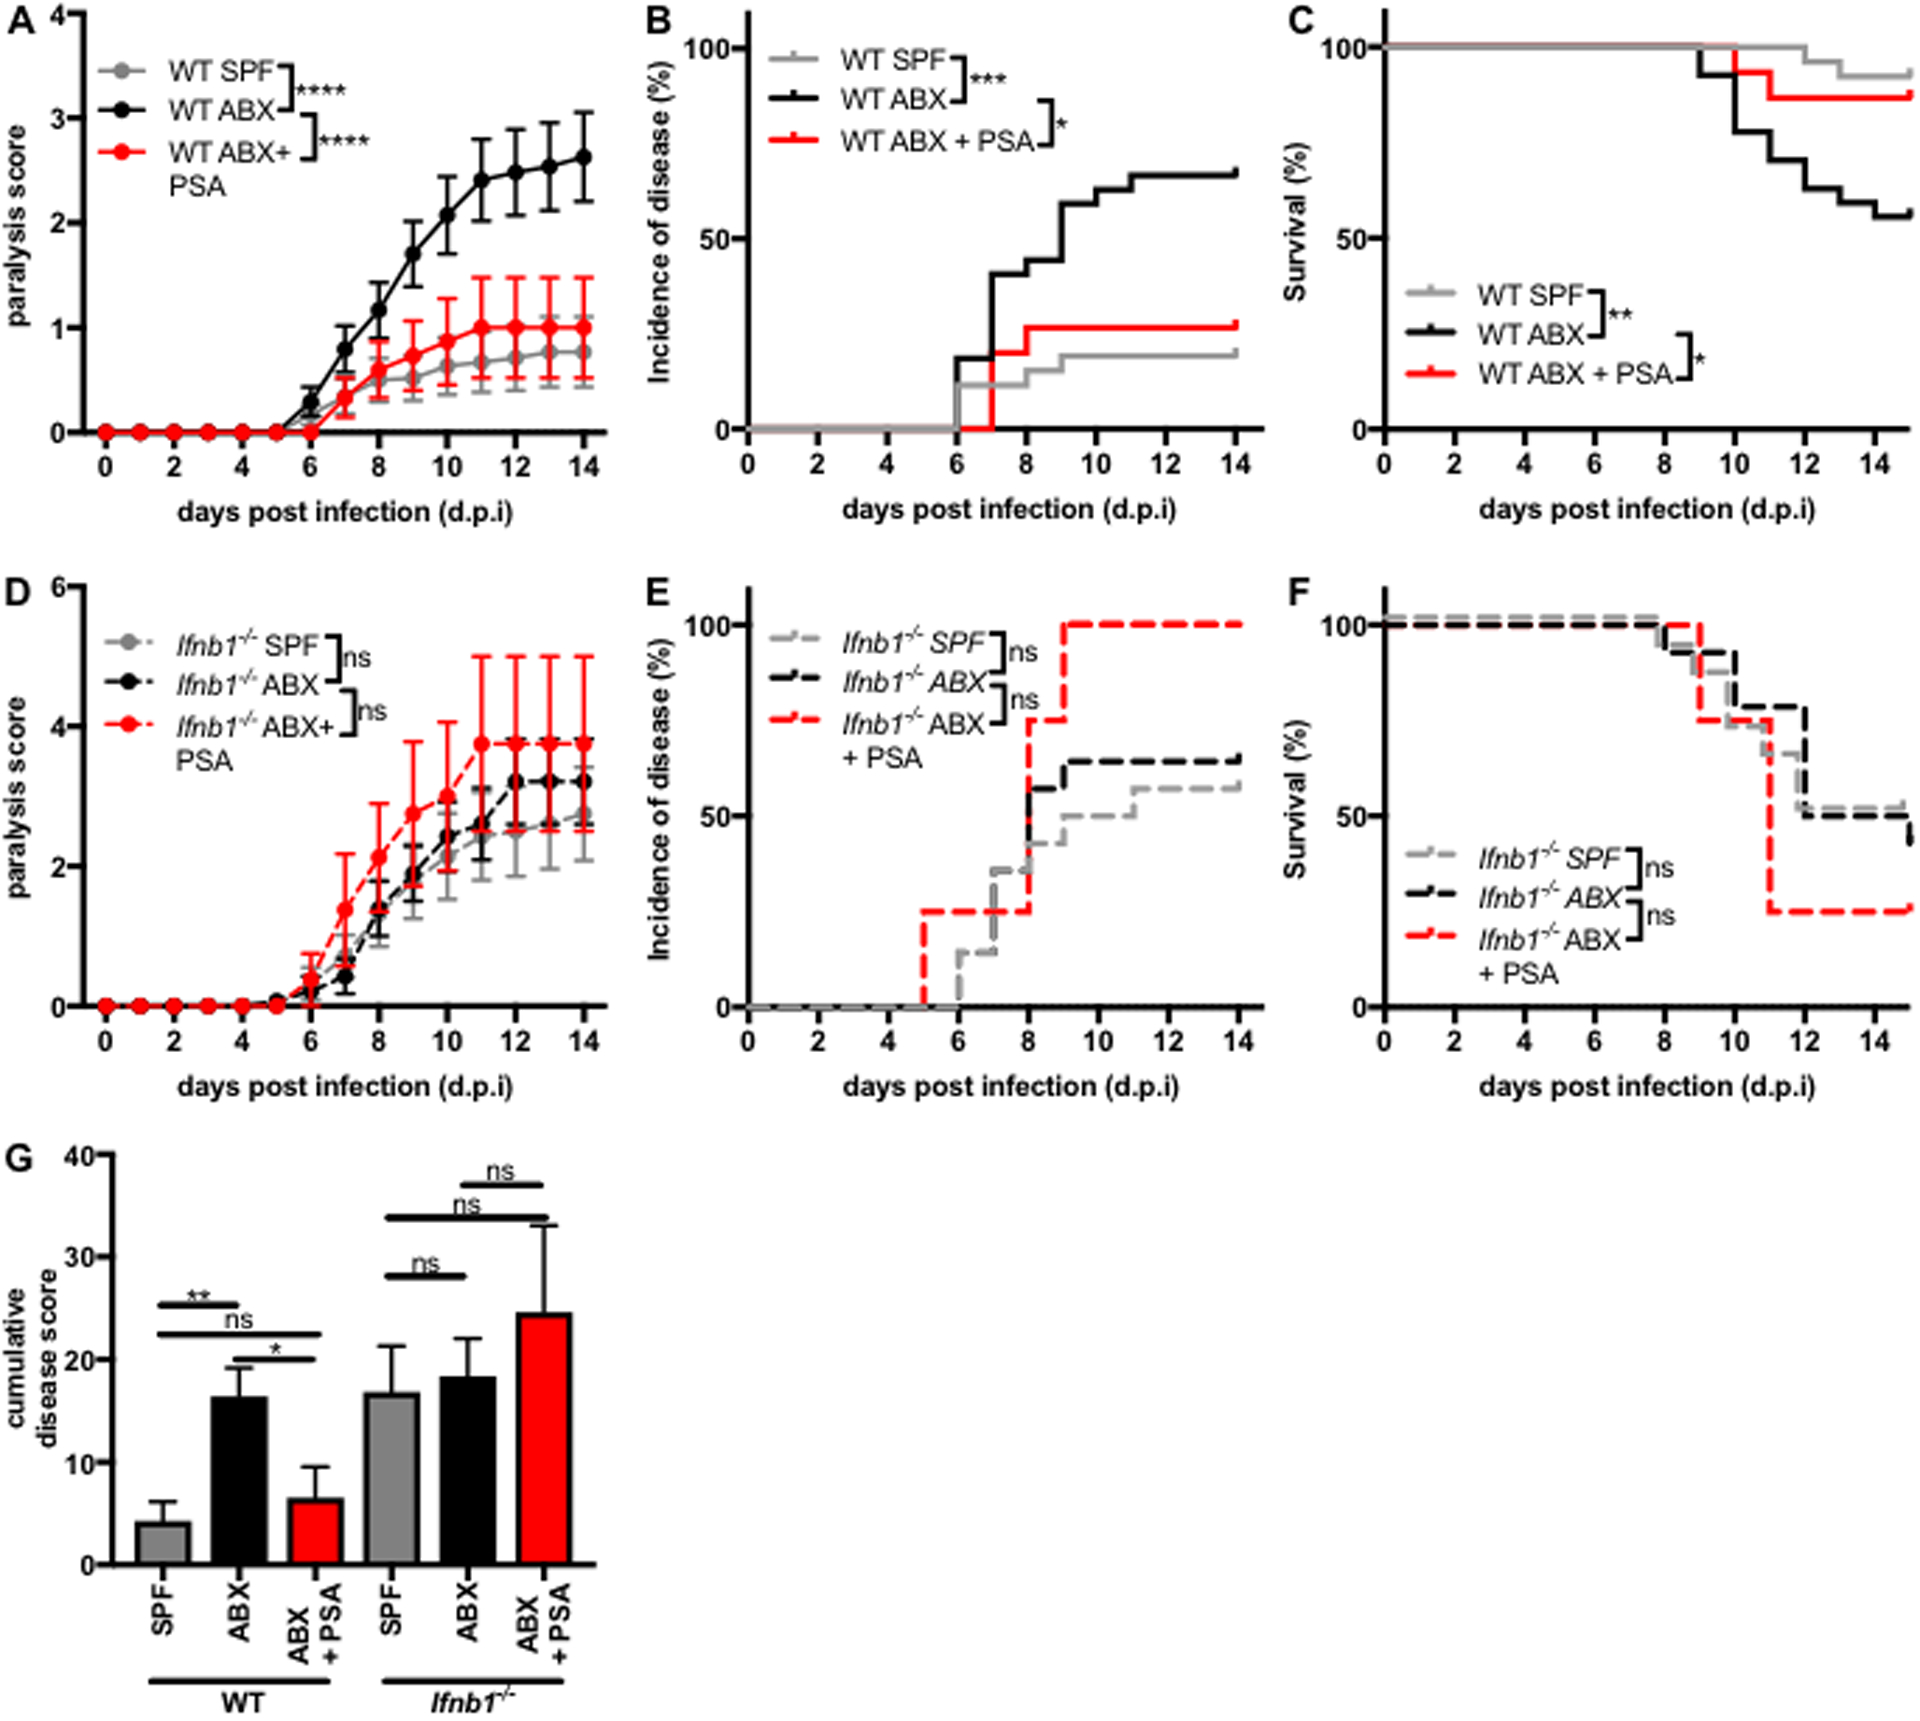
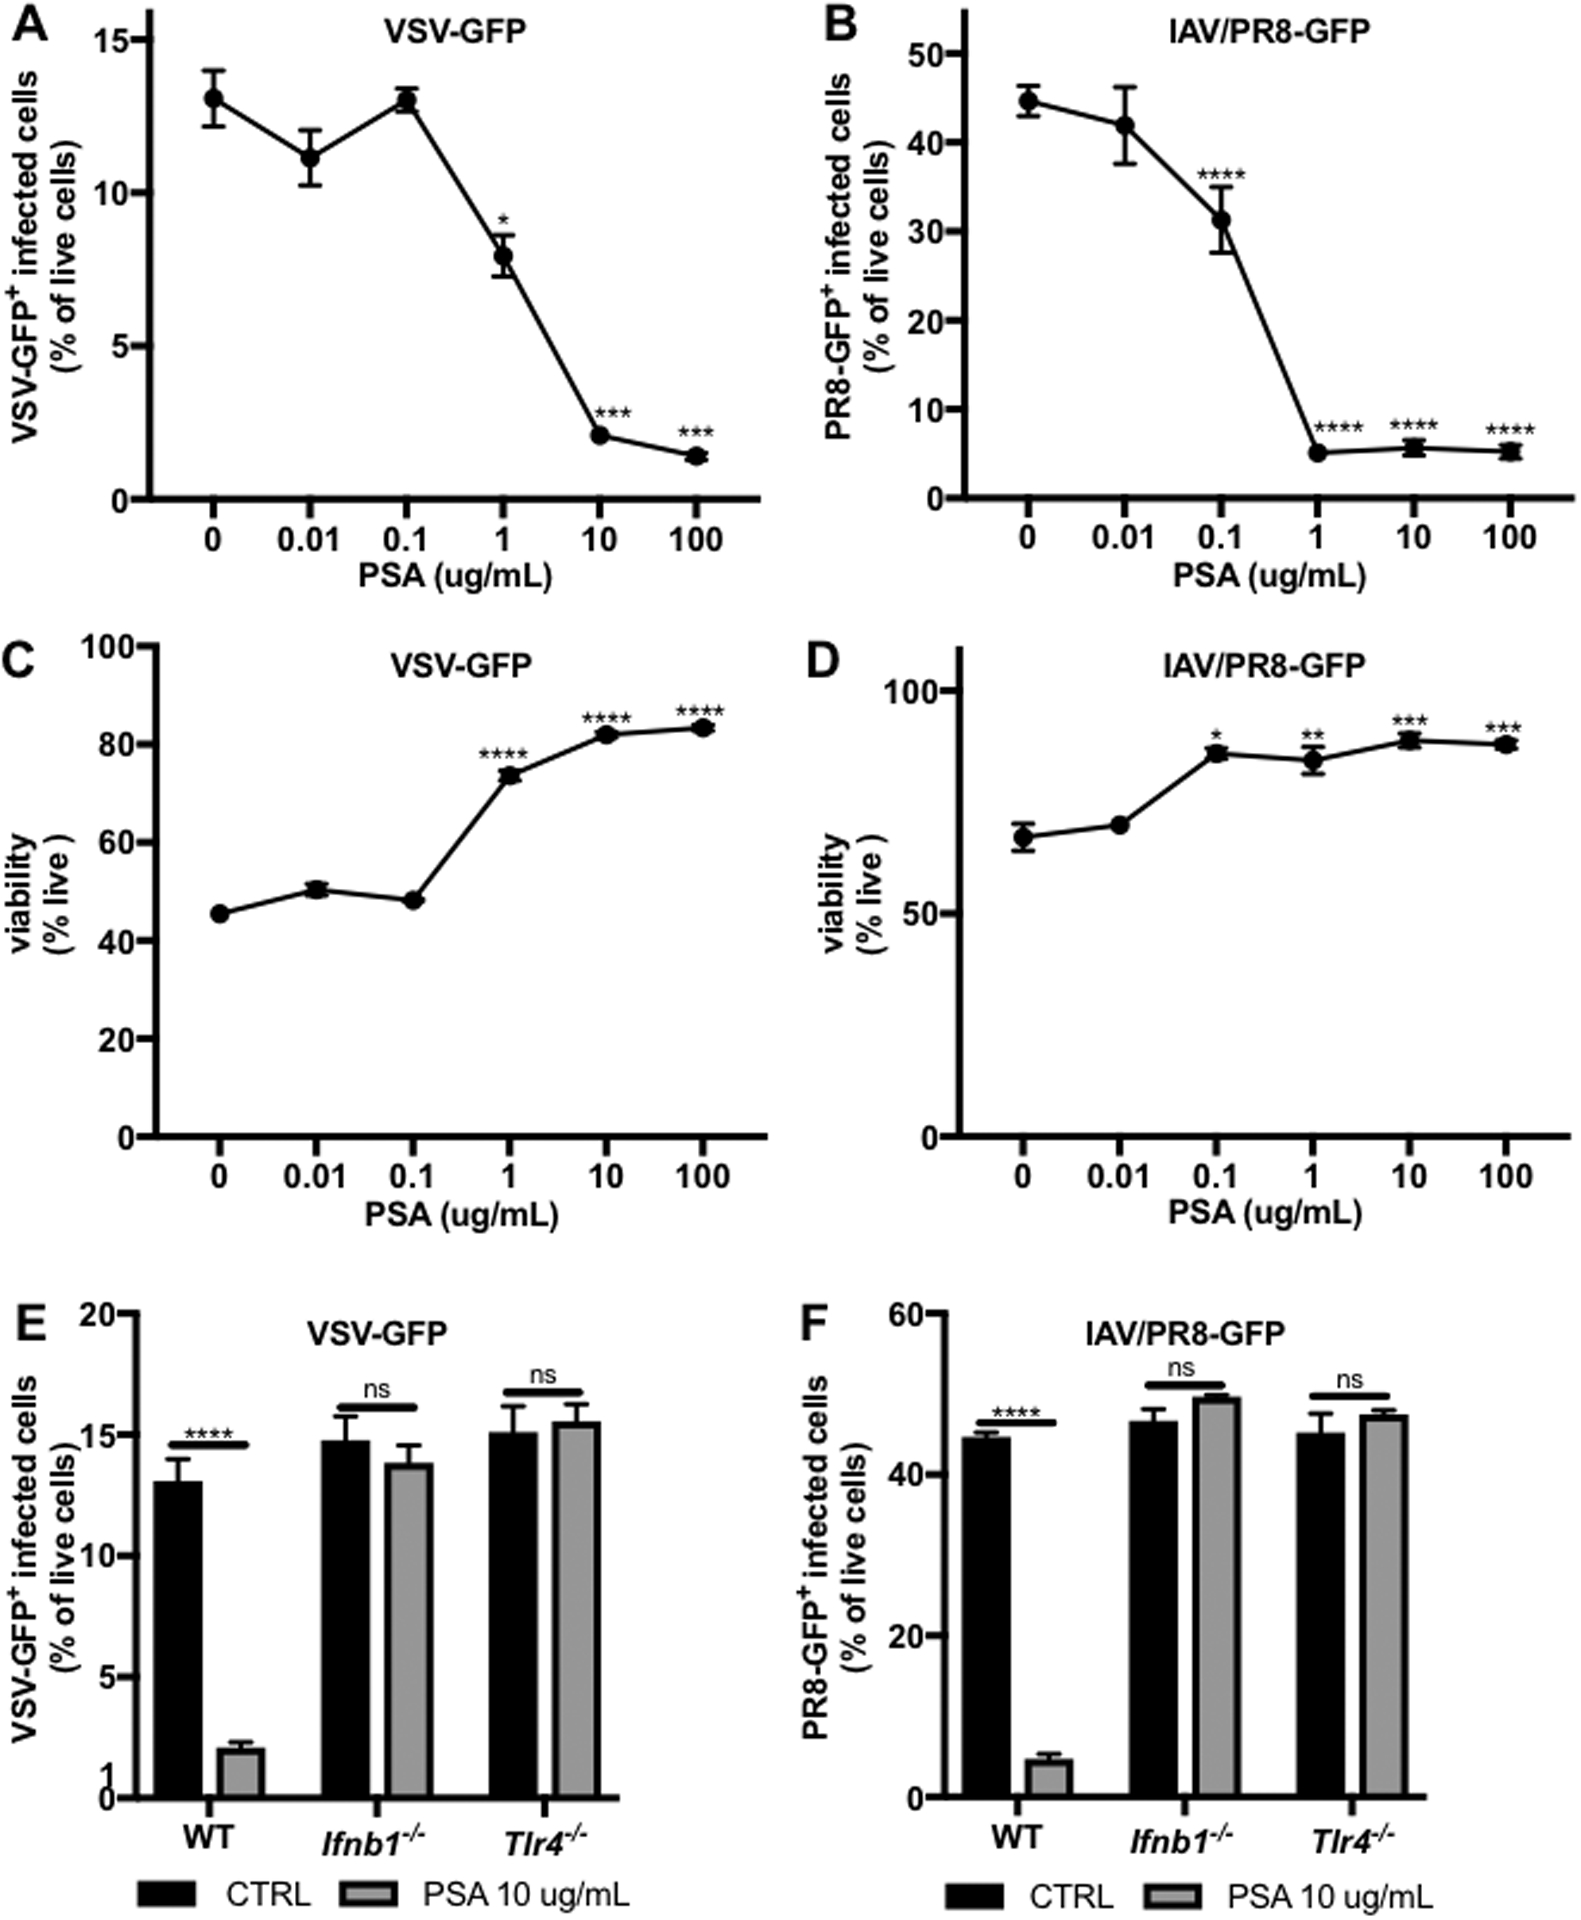
Interferon (IFN)-Is are crucial mediators of antiviral immunity and homeostatic immune system regulation. However, the source of IFN-I signaling under homeostatic conditions is unclear. We discovered that commensal microbes regulate the IFN-I response through induction of IFN-β by colonic DCs. Moreover, the mechanism by which a specific commensal microbe induces IFN-β was identified. Outer membrane (OM)-associated glycolipids of gut commensal microbes belonging to the Bacteroidetes phylum induce expression of IFN-β. Using Bacteroides fragilis and its OM-associated polysaccharide A, we determined that IFN-β expression was induced via TLR4-TRIF signaling. Antiviral activity of this purified microbial molecule against infection with either vesicular stomatitis virus (VSV) or influenza was demonstrated to be dependent on the induction of IFN-β. In a murine VSV infection model, commensal-induced IFN-β regulated natural resistance to virus infection. Due to the physiological importance of IFN-Is, discovery of an IFN-β-inducing microbial molecule represents a potential approach for the treatment of some human diseases.

Keywords: Bacteroides; dendritic cell; immune modulation; microbiome; type I interferon; virus infection.


Conflict of interest statement

Declaration of Interests Two patent applications have been filed by Harvard University with relation to this work. D.L.K. and K.L.S. are listed as inventors on both.

Figures

Figure 1
Figure 1. Microbiota depletion reduces local and systemic ISG expression.
mLNs and spleens were harvested from WT or Ifnb1−/− SPF mice with and without broad-spectrum antibiotics (ABX) treatment. RNA was isolated from whole tissue samples followed by qRT-PCR to analyze ISG expression levels. Fold change gene expression in the mLN (A,C-D) or spleen (B,C-D) was calculated compared to WT SPF mice using the ΔΔCT method, with ActB as the reference gene and depicted as (A,B) a heat map of all ISGs tested or representative bar graphs of mean +/− SEM with each point representing one mouse for (C) Ifit3 and (D) Oasl2. One-way ANOVA statistical analysis followed by Tukey’s multiple comparisons test. Details of statistical analyses can be found in Tables S1–2. ns=not significant, ****p<0.0001.
Figure 2
Figure 2. The commensal microbiota regulates IFNβ expression by dendritic cells in the colon LP.
(A-C) Single cell suspensions were prepared from spleens, mLNs, and colon LP of SPF IFNβ-YFP reporter mice and analyzed by flow cytometry. (A) Frequency of IFNβ-YFP+ cells out of CD45+ cells (colon LP N=12, mLN N=13, spleen N=13). (B) Frequency of CD11c+ DCs out of total IFNβ-YFP+CD45+ cells in the colon LP (N=10). (C) Frequency of CD11b+CD103, CD11b+CD103+, and CD11bCD103+ DC subsets out of IFNβ-YFP+CD11c+ colonic LP dendritic cells. (D-E) DCs were isolated from single cell suspensions of different tissues from WT GF and WT SPF mice, yielding DC+ and DC fractions, and Ifnb1 expression was analyzed by qRT-PCR. Relative expression of Ifnb1 in (D) the whole tissue (N=10), DC+ (N=9), and DC (N=6) fractions of the colon LP or (E) the DC+ fraction of the colon LP (N=5), mLN (N=6), or spleen (N=3). (F) Flow cytometric analysis of frequency of colon LP IFNβ-YFP+CD11c+ cells out of CD45+ cells (ABX N=7, SPF N=10) in SPF or ABX treated IFNβ-YFP reporter mice. (G) qRT-PCR analysis of Ifnb1 expression in colon LP DC+ cells from WT SPF (N=6) or WT GF mice (N=6). (D-E,G) Fold change gene expression was calculated using the ΔΔCT method, with Actb as the reference gene, compared to the (D) DC+, (E) colon LP, or (G) SPF samples. Bars represent mean +/− SEM. Statistical analysis with (A,D,E) one-way ANOVA followed by Tukey’s multiple comparisons test and (F,G) unpaired t-test. N= number of mice, N.D.=not detected, *p<0.05, **p<0.01, ***p<0.001, ****p<0.0001, ns=not significant.
Figure 3.
Figure 3.. B. fragilis PSA induces IFNβ in vitro and in vivo.
(A) WT GF mice were gavaged with vehicle (GF, N=5) or colonized at 4 weeks of age with B. fragilis (N=5) or C. ramosum (N=4). Two weeks post colonization, DCs were isolated from colon LP single cell suspensions, RNA was isolated, and Ifnb1 expression was analyzed by qRT-PCR. Fold change gene expression to GF was calculated using the ΔΔCT method with ActB as a reference gene. (B-E) BMDCs were cultured from WT, Ifnb1−/−, or Ifnar1−/− mice. (B) IFNβ levels in the supernatants of WT BMDCs treated with vehicle control (CTRL, N=6) or 100 ug/mL B. fragilis OM extract (N=3). (C) ELISA analysis of IFNβ levels in the supernatants of WT BMDCs treated with 50 ug/mL PSA for 0 (N=15), 6 (N=15), or 24 hrs (N=6). (D) RNA was isolated from WT BMDCs 24 hrs post treatment with vehicle control (CTRL, N=4) or 50 ug/mL PSA (N=3) and ISG expression was analyzed by qRT-PCR. Fold change gene expression to CTRL was calculated using the ΔΔCT method with Actb as the reference gene. (E) After 24 hrs of treatment with 100 ug/mL PSA, BST2 mean fluorescence intensity (MFI) gated on live CD11c+ cells was measured by flow cytometry (N=4 for each condition). (F) WT SPF mice were gavaged with 150 ug PSA and after 1.5 hrs Ifnb1 expression by colon LP DCs was analyzed by qRT-PCR (SPF, N=8; SPF+PSA, N=3). Fold change gene expression to SPF was calculated using the ΔΔCT method with Actb as the reference gene. Data represents average +/− SEM. Statistical analysis with (A,C) one-way ANOVA followed by Dunnett’s multiple comparisons test, (B,D,F) unpaired t-test and (E) Two-way ANOVA followed by Sidak’s multiple comparisons test to WT. N.D.= not detected, ns=not significant, *p<0.05, **p<0.01, ***p<0.001, ****p<0.0001.
Figure 4
Figure 4. Bacteroides OM glycolipids signal through TLR4 to induce IFNβ.
(A) BMDCs were differentiated from WT (N=27), Tlr2−/− (N=15), Clec7a−/− (N=3), Tlr4−/− (N=12), Trif−/− (N=6), or Myd88−/− (N=5) mice and treated with 50 ug/mL B. fragilis PSA for 6 hrs. IFNβ in the supernatants was measured by ELISA and normalized by subtracting vehicle control. (B) ELISA analysis of IFNβ in the supernatants of WT BMDCs treated for 6 hrs with a dose response of PSA (N=9), the LOS lipid domain of PSA (LOS, N=14), or delipidated PSA (PSA-delipidated, N=3, ND for all concentrations). ELISA analysis of IFNβ in the supernatants of WT or Tlr4−/− BMDCs treated for 6 hrs with (C) vehicle control (CTRL, N=8), 1 ug/mL LOS (N=8) or (D) 100 ug/mL Bacteroides OM extracts (N=3 per condition). (A-D) Data represents average +/− SEM. (E,F) RNA isolation and qRT-PCR analysis of ISG expression was performed on mLNs and spleens harvested from WT SPF mice, WT SPF mice after 1 week of metronidazole (Met) treatment, or from Tlr4−/− SPF mice. Fold change gene expression in the mLN (E) or spleen (F) was calculated compared to WT SPF mice using the ΔΔCT method, with ActB as the reference gene and depicted as a heat map. Statistical analysis with (A) one-way ANOVA followed by Dunnett’s multiple comparisons test to WT, (B,D) two-way ANOVA followed by Dunnett’s multiple comparisons test to 0 ug/mL CTRL, and (C) unpaired t-test. (E,F) Details of statistical analyses can be found in Tables S3–4. ND=not detected, ns=not significant, *p<0.05, **p<0.01, ***p<0.001, ****p<0.0001.
Figure 5
Figure 5. IFNβ is required for protection from murine VSV infection.
Littermate Ifnb1+/+ (N=19) or Ifnb1−/− (N=12) mice were infected with 106 PFU of VSV strain Indiana by subcutaneous injection into the footpad. Mice were monitored daily for (A) paralysis score, (B) percentage of mice with paralysis (incidence of disease), and (C) survival. (D) The sum of the daily disease scores for each mouse for the duration of the experiment (cumulative disease score) was calculated 14 d.p.i. Statistical analysis with (A) linear regression analysis and unpaired t-test (for each day), (B,C) log-rank test, and (D) unpaired t-test. *p<0.05, **p<0.01, ***p<0.001.
Figure 6
Figure 6. Microbiota-induced IFNβ enhances resistance to VSV infection.
WT or Ifnb1−/− SPF mice were treated with vehicle control or ABX for 7 days prior to infection as well as vehicle or 75 ug PSA daily starting 4 days before until the day of infection with 106 PFU VSV strain Indiana. Mice were monitored daily for (A,D) paralysis score, (B,E) percentage of mice with paralysis (incidence of disease), and (C,F) survival. (G) The sum of the daily disease scores for each mouse (cumulative disease score) was calculated 14 d.p.i. Statistical analysis with (A,D) linear regression analysis, (B,C,E,F) log-rank test, and (G) one-way ANOVA followed by Tukey’s multiple comparisons test. WT SPF N=26, WT ABX N=27, WT ABX+PSA N=15, Ifnb1−/− SPF N=14, Ifnb1−/− ABX N=14, Ifnb1−/− ABX+PSA N=4. ns=not significant, *p<0.05, **p<0.01, ***p<0.001, ****p<0.0001.
Figure 7
Figure 7. B. fragilis PSA reduces virus infection of BMDCs by signaling through TLR4 to induce IFNβ.
BMDCs were infected with (A,C,E) VSV-GFP or (B,D,F) IAV/PR8-GFP (both MOI=1). GFP+ virus-infected cells were analyzed by flow cytometry 24 h.p.i. in WT, Ifnb1−/−, or Tlr4−/− BMDCs primed for 24 hours prior to infection with (A-D) a dose response of PSA or (E-F) 10 ug/mL PSA. Data represents mean +/− SEM. Statistical analysis with unpaired t-test to 0 ug/mL CTRL. VSV-GFP N=3–6 samples per condition. IAV/PR8-GFP N=3–12 samples per condition. ns=not significant, *p<0.05. **p<0.01, ***p<0.001, ****p<0.0001.

Similar articles

Cited by

References

    1. Abt MC, Osborne LC, Monticelli LA, Doering TA, Alenghat T, Sonnenberg GF, Paley MA, Antenus M, Williams KL, Erikson J, et al. (2012). Commensal bacteria calibrate the activation threshold of innate antiviral immunity. Immunity 37, 158–170. - PMC - PubMed
    1. An D, Oh SF, Olszak T, Neves JF, Avci FY, Erturk-Hasdemir D, Lu X, Zeissig S, Blumberg RS, and Kasper DL (2014). Sphingolipids from a symbiotic microbe regulate homeostasis of host intestinal natural killer T cells. Cell 156, 123–133. - PMC - PubMed
    1. Bohannon JK, Hernandez A, Enkhbaatar P, Adams WL, and Sherwood ER (2013). The immunobiology of toll-like receptor 4 agonists: from endotoxin tolerance to immunoadjuvants. Shock 40, 451–462. - PMC - PubMed
    1. Cress BF, Englaender JA, He W, Kasper D, Linhardt RJ, and Koffas MA (2014). Masquerading microbial pathogens: capsular polysaccharides mimic host-tissue molecules. FEMS Microbiol Rev 38, 660–697. - PMC - PubMed
    1. Cullen TW, Schofield WB, Barry NA, Putnam EE, Rundell EA, Trent MS, Degnan PH, Booth CJ, Yu H, and Goodman AL (2015). Gut microbiota. Antimicrobial peptide resistance mediates resilience of prominent gut commensals during inflammation. Science 347, 170–175. - PMC - PubMed

Publication types

MeSH terms