

Expression of SARS-CoV-2 Entry Factors in the Pancreas of Normal Organ Donors and Individuals with COVID-19
- PMID: 33207244
- PMCID: PMC7664515
- DOI: 10.1016/j.cmet.2020.11.005
Expression of SARS-CoV-2 Entry Factors in the Pancreas of Normal Organ Donors and Individuals with COVID-19
Abstract
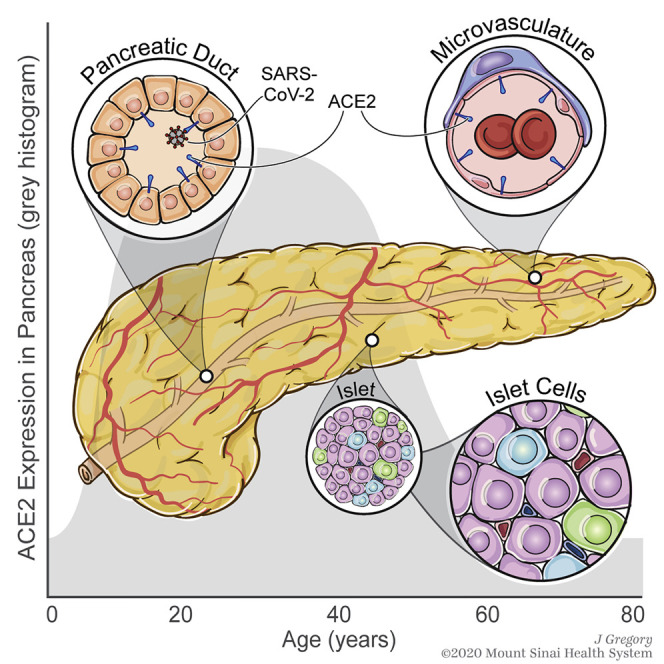
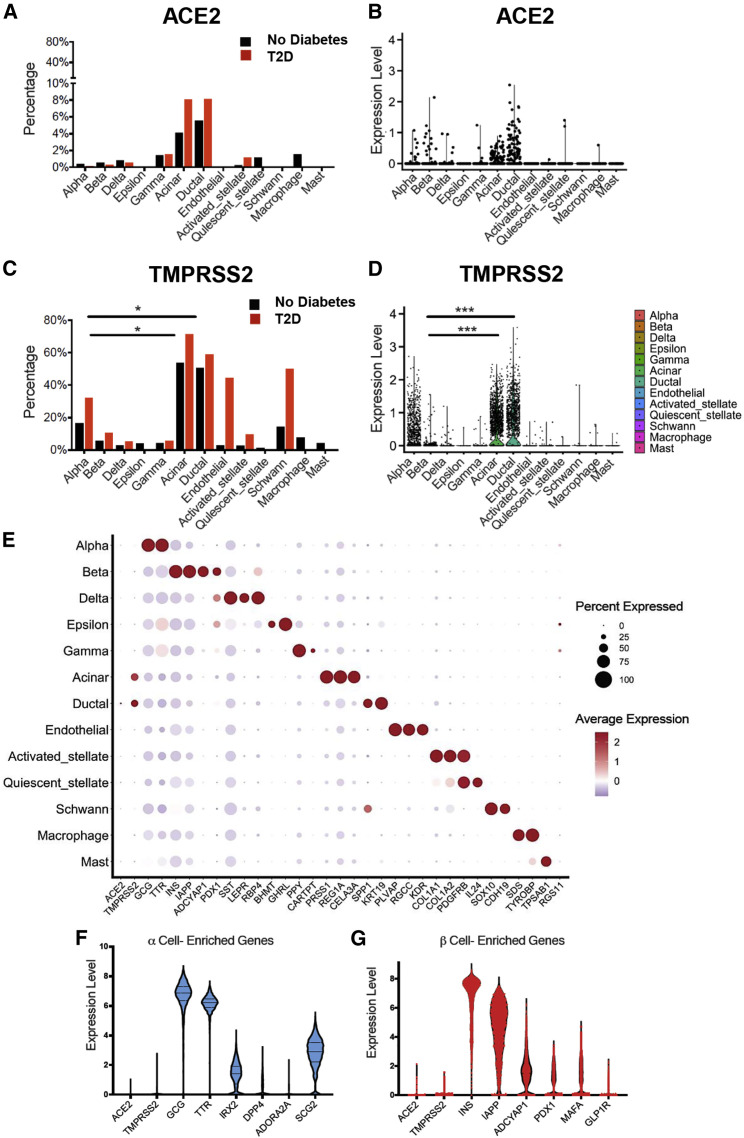
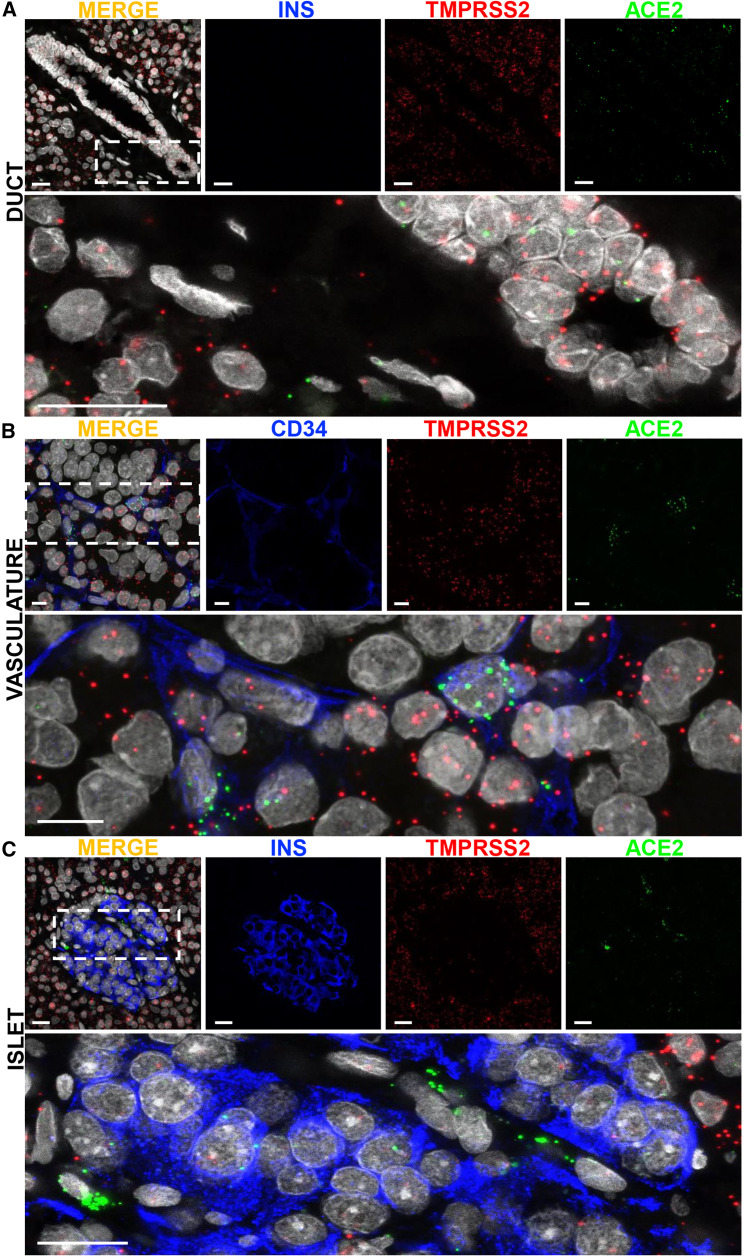
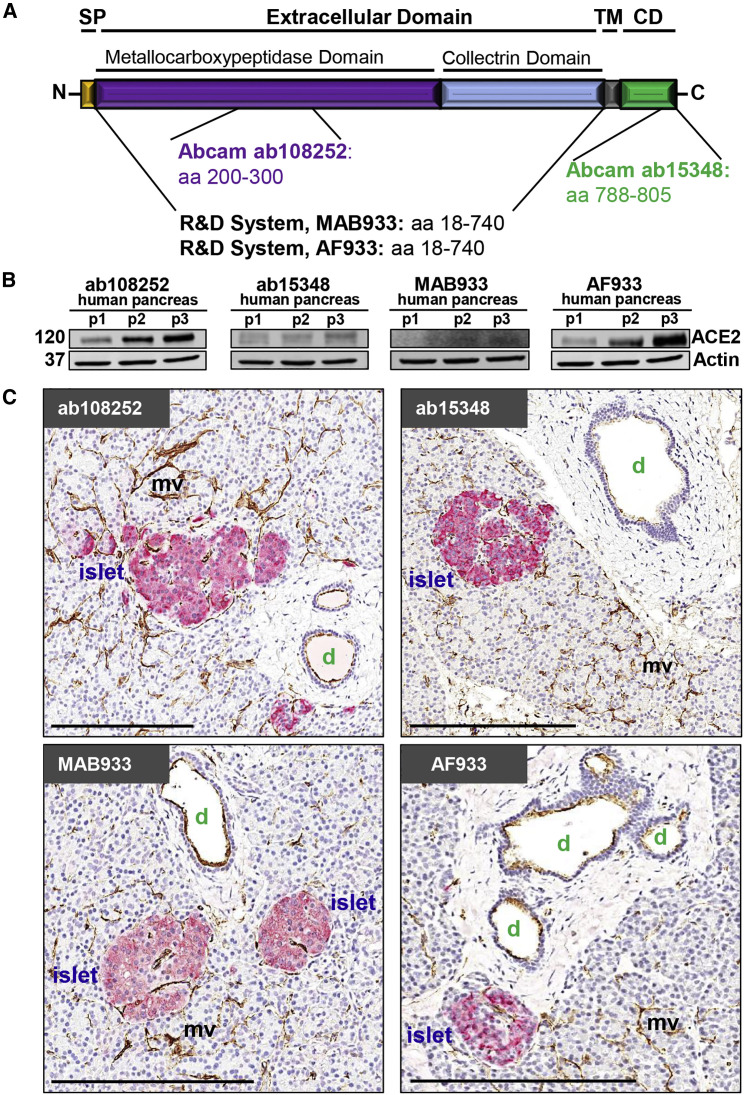
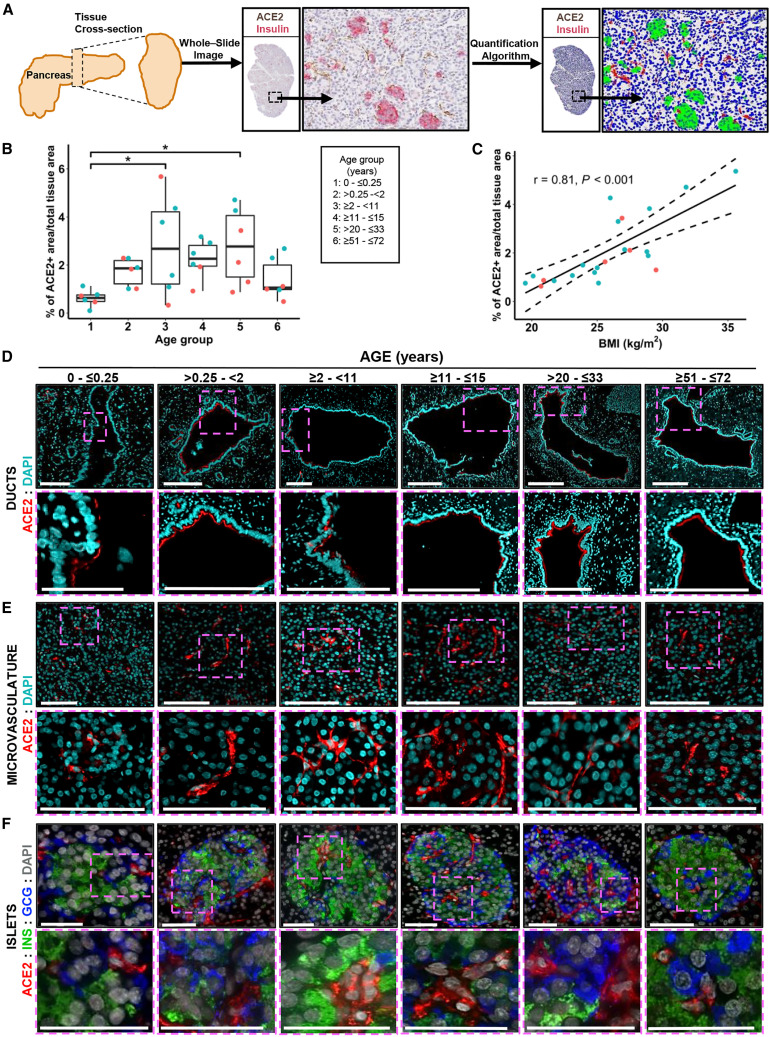
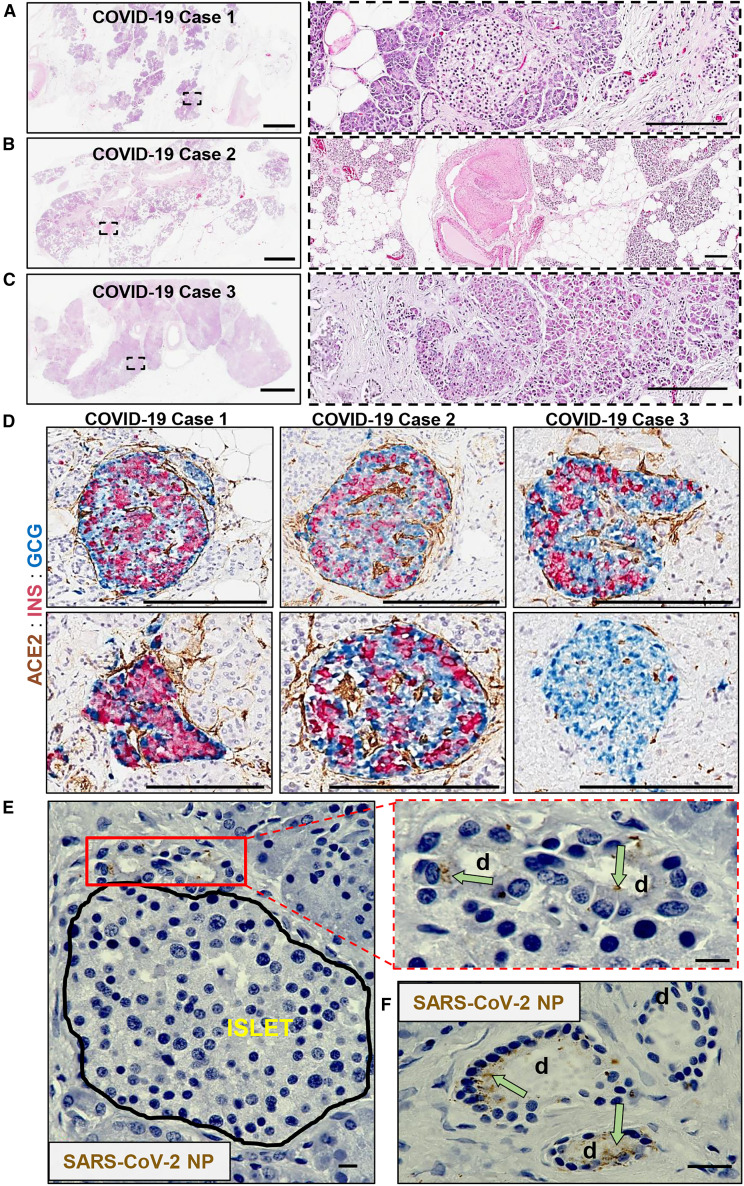
Diabetes is associated with increased mortality from severe acute respiratory syndrome coronavirus-2 (SARS-CoV-2). Given literature suggesting a potential association between SARS-CoV-2 infection and diabetes induction, we examined pancreatic expression of angiotensin-converting enzyme 2 (ACE2), the key entry factor for SARS-CoV-2 infection. Specifically, we analyzed five public scRNA-seq pancreas datasets and performed fluorescence in situ hybridization, western blotting, and immunolocalization for ACE2 with extensive reagent validation on normal human pancreatic tissues across the lifespan, as well as those from coronavirus disease 2019 (COVID-19) cases. These in silico and ex vivo analyses demonstrated prominent expression of ACE2 in pancreatic ductal epithelium and microvasculature, but we found rare endocrine cell expression at the mRNA level. Pancreata from individuals with COVID-19 demonstrated multiple thrombotic lesions with SARS-CoV-2 nucleocapsid protein expression that was primarily limited to ducts. These results suggest SARS-CoV-2 infection of pancreatic endocrine cells, via ACE2, is an unlikely central pathogenic feature of COVID-19-related diabetes.
Keywords: ACE2; CD34; COVID-19; SARS-CoV-2; TMPRSS2; insulin; islet; pancreas; type 1 diabetes; type 2 diabetes.
Copyright © 2020 Elsevier Inc. All rights reserved.
Conflict of interest statement
Declaration of Interests The authors declare no competing interests.
Figures
Similar articles
-
SARS-CoV-2 Cell Entry Factors ACE2 and TMPRSS2 Are Expressed in the Microvasculature and Ducts of Human Pancreas but Are Not Enriched in β Cells.Cell Metab. 2020 Dec 1;32(6):1028-1040.e4. doi: 10.1016/j.cmet.2020.11.006. Epub 2020 Nov 13. Cell Metab. 2020. PMID: 33207245 Free PMC article.
-
Lymphocytes regulate expression of the SARS-CoV-2 cell entry factor ACE2 in the pancreas of T2DM patients.Diabet Med. 2023 Oct;40(10):e15106. doi: 10.1111/dme.15106. Epub 2023 Apr 11. Diabet Med. 2023. PMID: 37014274
-
Contributions of human ACE2 and TMPRSS2 in determining host-pathogen interaction of COVID-19.J Genet. 2021;100(1):12. doi: 10.1007/s12041-021-01262-w. J Genet. 2021. PMID: 33707363 Free PMC article. Review.
-
Expression of Endogenous Angiotensin-Converting Enzyme 2 in Human Induced Pluripotent Stem Cell-Derived Retinal Organoids.Int J Mol Sci. 2021 Jan 28;22(3):1320. doi: 10.3390/ijms22031320. Int J Mol Sci. 2021. PMID: 33525682 Free PMC article.
-
Effects of SARS-CoV-2 on Cardiovascular System: The Dual Role of Angiotensin-Converting Enzyme 2 (ACE2) as the Virus Receptor and Homeostasis Regulator-Review.Int J Mol Sci. 2021 Apr 26;22(9):4526. doi: 10.3390/ijms22094526. Int J Mol Sci. 2021. PMID: 33926110 Free PMC article. Review.
Cited by
-
COVID-19 and diabetes in children.Ann Pediatr Endocrinol Metab. 2022 Sep;27(3):157-168. doi: 10.6065/apem.2244150.075. Epub 2022 Sep 30. Ann Pediatr Endocrinol Metab. 2022. PMID: 36203266 Free PMC article.
-
Long-term outcome of patients with diabetic-range hyperglycemia first detected during admission for COVID-19: A single-center observational study.J Family Med Prim Care. 2024 Aug;13(8):3374-3380. doi: 10.4103/jfmpc.jfmpc_140_24. Epub 2024 Jul 26. J Family Med Prim Care. 2024. PMID: 39228533 Free PMC article.
-
A Pan-Cancer In Silico Analysis of the COVID-19 Internalization Protease: Transmembrane Proteaseserine-2.Front Genet. 2022 Feb 25;13:805880. doi: 10.3389/fgene.2022.805880. eCollection 2022. Front Genet. 2022. PMID: 35281819 Free PMC article.
-
Incidence of an Insulin-Requiring Hyperglycemic Syndrome in SARS-CoV-2-Infected Young Individuals: Is It Type 1 Diabetes?Diabetes. 2022 Dec 1;71(12):2656-2663. doi: 10.2337/db21-0831. Diabetes. 2022. PMID: 35293987 Free PMC article.
-
Limited extent and consequences of pancreatic SARS-CoV-2 infection.Cell Rep. 2022 Mar 15;38(11):110508. doi: 10.1016/j.celrep.2022.110508. Epub 2022 Feb 21. Cell Rep. 2022. PMID: 35247306 Free PMC article.
References
-
- Blume C., Jackson C.L., Spalluto C.M., Legebeke J., Nazlamova L., Conforti F., Perotin-Collard J.-M., Frank M., Crispin M., Coles J. A novel isoform of ACE2 is expressed in human nasal and bronchial respiratory epithelia and is upregulated in response to RNA respiratory virus infection. bioRxiv. 2020 doi: 10.1101/2020.07.31.230870. - DOI - PubMed
-
- Campbell-Thompson M., Wasserfall C., Kaddis J., Albanese-O’Neill A., Staeva T., Nierras C., Moraski J., Rowe P., Gianani R., Eisenbarth G. Network for Pancreatic Organ Donors with Diabetes (nPOD): developing a tissue biobank for type 1 diabetes. Diabetes Metab. Res. Rev. 2012;28:608–617. - PMC - PubMed
Publication types
MeSH terms
Substances
Grants and funding
- R21 DK119800/DK/NIDDK NIH HHS/United States
- P01 AI042288/AI/NIAID NIH HHS/United States
- U01 DK127786/DK/NIDDK NIH HHS/United States
- I01 BX001733/BX/BLRD VA/United States
- R01 DK122160/DK/NIDDK NIH HHS/United States
- R01 AI134971/AI/NIAID NIH HHS/United States
- P30 DK097512/DK/NIDDK NIH HHS/United States
- R01 AI050237/AI/NIAID NIH HHS/United States
- P30 DK020541/DK/NIDDK NIH HHS/United States
- UC4 DK108132/DK/NIDDK NIH HHS/United States
- R01 DK093954/DK/NIDDK NIH HHS/United States
- R01 DK127308/DK/NIDDK NIH HHS/United States
- UC4 DK104166/DK/NIDDK NIH HHS/United States
LinkOut - more resources
Full Text Sources
Medical
Miscellaneous
