. 2020 Nov 11;11(1):5716.
doi: 10.1038/s41467-020-19513-2.

TranSPHIRE: automated and feedback-optimized on-the-fly processing for cryo-EM

Affiliations

TranSPHIRE: automated and feedback-optimized on-the-fly processing for cryo-EM

Markus Stabrin et al. Nat Commun. .

Abstract

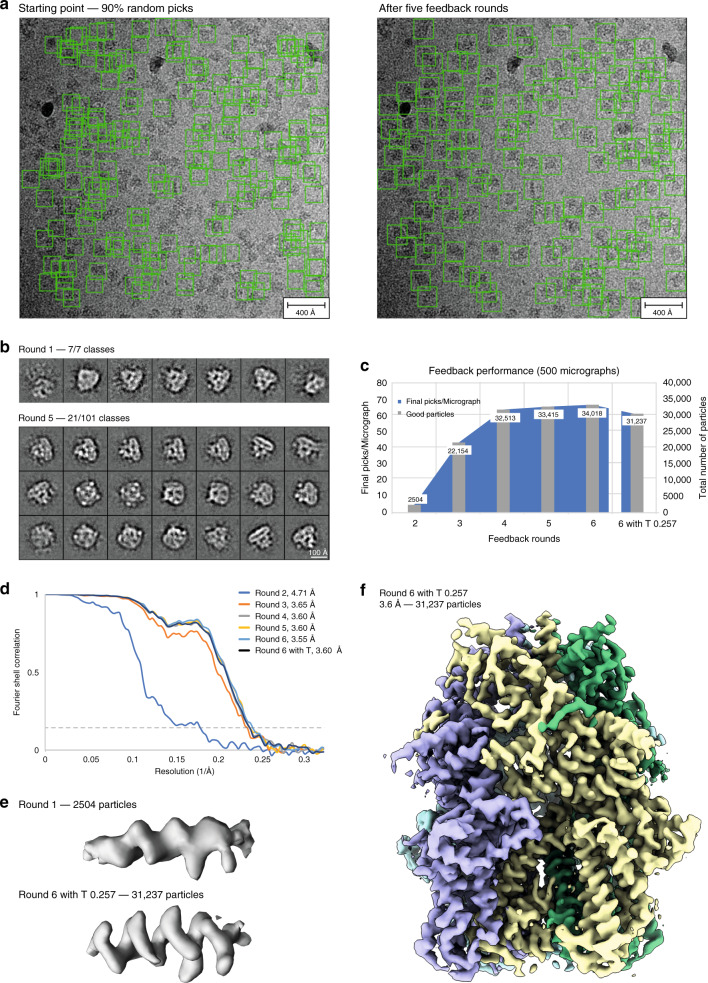
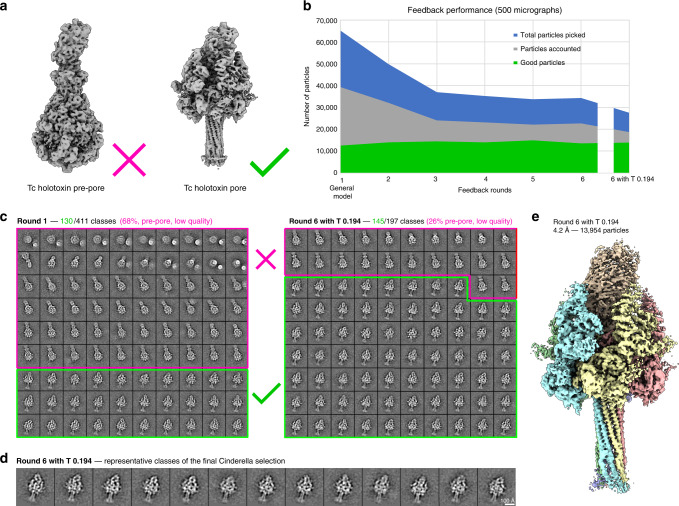
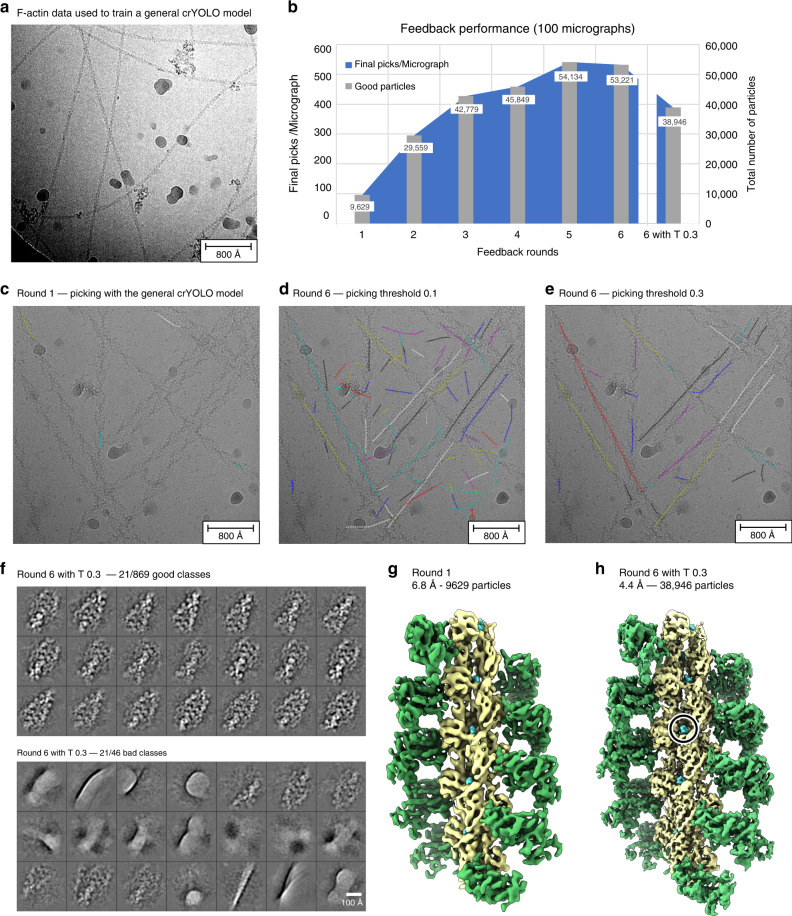
Single particle cryo-EM requires full automation to allow high-throughput structure determination. Although software packages exist where parts of the cryo-EM pipeline are automated, a complete solution that offers reliable on-the-fly processing, resulting in high-resolution structures, does not exist. Here we present TranSPHIRE: A software package for fully-automated processing of cryo-EM datasets during data acquisition. TranSPHIRE transfers data from the microscope, automatically applies the common pre-processing steps, picks particles, performs 2D clustering, and 3D refinement parallel to image recording. Importantly, TranSPHIRE introduces a machine learning-based feedback loop to re-train its picking model to adapt to any given data set live during processing. This elegant approach enables TranSPHIRE to process data more effectively, producing high-quality particle stacks. TranSPHIRE collects and displays all metrics and microscope settings to allow users to quickly evaluate data during acquisition. TranSPHIRE can run on a single work station and also includes the automated processing of filaments.


Conflict of interest statement

The authors declare no competing interests.

Figures

Fig. 1
Fig. 1. The TranSPHIRE pipeline and the SPHIRE backend.
a Upper register (solid line): Overview of the integrated TranSPHIRE pipeline and all automated processing steps. The pipeline includes file management tasks, i.e., parallelized data transfer, file compression, and file backup (gray); 2D processing, i.e., motion correction, CTF estimation, particle picking, 2D clustering, and 2D class selection (turquoise); and 3D processing, i.e., ab initio 3D reconstruction and 3D refinement (red). Additionally, the pipeline includes an automated feedback loop optimization to adapt picking to the current data set during runtime (purple). Lower register (dotted line): The SPHIRE software package forms the backend for TranSPHIRE and offers the tools used for 2D and 3D processing. SPHIRE includes additional tools for advanced processing, such as heterogeneity analysis and local resolution determination. b The TranSPHIRE feedback loop. Gray arrows indicate the flow of data processing. Purple arrows indicate the flow of the feedback loop. Left (input): Micrographs are initially picked using the crYOLO general model. Center (processing): Particles are picked and extracted. Once a pre-defined number of particles have been accumulated, the pipeline performs 2D classification; the resulting 2D class averages are labeled as either “good” or “bad” by Cinderella. Class labels and crYOLO box files are then used to re-train crYOLO and adapt its internal model to the processed data. In the next feedback round this updated model is used to re-pick the data. Right (output): After five feedback rounds, the complete data set is picked with the final optimized picking model and 2D classified in batches. For every batch a particles stack of “good” particles is created and available for 3D processing.
Fig. 2
Fig. 2. Timeline of the TranSPHIRE pipeline.
Timeline depicting the parallel execution of the processes of the TranSPHIRE pipeline. Timings are based on a Tc holotoxin data set consisting of 2053 micrographs, each containing 36 particles on average, collected at a speed of 188 micrographs per hour (K2 super-resolution, 40 frames). TranSPHIRE ran on-the-fly up to the creation of an ab initio 3D reconstruction using default settings. Important milestones are denoted in black: a first 2D class averages produced after 1.4 h; b end of the feedback loop after 7.3 h; c ab initio 3D reconstruction after 9.1 h; and d final 3D reconstruction of the first batch of particles after 15.5 h. Due to the internal scheduling of modern operating systems, and because not every TranSPHIRE thread is always working to capacity, the number of available CPUs (12/24 hyperthreading) and assigned TranSPHIRE threads (45) is not identical, and does not limit the speed of the computations.
Fig. 3
Fig. 3. Processing the TRPC4 membrane channel using a deliberately hampered picking model.
a To simulate low quality picking, only 10% of the initial crYOLO picks were used while the remaining 90% were re-positioned randomly (left). After the feedback loop crYOLO reliably picks the TRPC4 particles (right). b Total amount of 2D class averages produced in the first iteration of the feedback loop (top) and 21 representative averages produced in the final iteration of the feedback loop (bottom). c Progression of the number of particles labeled “good” when applying the intermediate picking models of the feedback loop to a fixed subset of 500 micrographs. The curve flattens out in the final iterations, indicating the convergence of the feedback loop optimization. d Fourier shell correlation (FSC) curves of the individual 3D reconstructions computed from particles labeled “good” (also see c). e Representative α-helix (amino acids 600–615) illustrating the improvement of the density when using the final (bottom) compared to the initial (top) picking model. f 3D reconstruction of TRPC4 computed from 500 micrographs using the optimized picking model.
Fig. 4
Fig. 4. Using prior knowledge to extract a pre-selected conformational state.
a The processed data set contains the Tc holotoxin in both the pre-pore state (left) and the more rare pore state (right). In this experiment, we specifically target the pore state. b Progression of the number of picked particles (blue), those accounted during 2D classification (gray) and particles labeled “good” i.e. representing the pore state (green) when applying the intermediate picking models of the feedback loop to a fixed subset of 500 micrographs. Initial picking is dominated by pre-pore state particles. This overhead is reduced with each iteration, while the amount of picked pore state particle remains stable. c Representative 2D class averages depicting the decrease of unwanted classes (pore state or low quality; marked magenta) from an initial 68% in the first feedback round (left) to 26% after the last feedback round (right). d Representative 2D class averages depicting the pore state as selected by Cinderella in the final iteration of the feedback loop. e 3D reconstruction of the Tc holotoxin pore state computed from 500 micrographs using the final optimized picking model.
Fig. 5
Fig. 5. Ligand identification within an actomyosin complex.
a Representative micrograph of the F-actin data used to train crYOLO. b Progression of the number of “good” particles per micrograph (blue) and in total (gray) when applying the intermediate picking models of the feedback loop to a fixed subset of 100 micrographs. The dipping curve at the end indicates the desired loss of low-quality picks that are excluded when a higher picking threshold (0.3) is used. c Representative micrograph of the actomyosin complex highlighting the weak initial picking results when using the crYOLO model trained on F-actin data (see a). d Particle picking performance on the same micrograph using the final picking model. While filaments are now traced much more effectively, the model also picks unwanted filament crossings and contamination. e Increasing the picking threshold from 0.1 to the default value of 0.3 minimizes the amount of false positive picks, while maintaining the desired filament traces. f Representative 2D class averages labeled “good” (top) and “bad” (bottom) by Cinderella based on 100 micrographs and using the final model for picking. g 3D reconstruction of the actomyosin complex computed from 100 micrographs using the initial picking model. h 3D reconstruction computed from the same 100 micrographs using the final optimized picking model. The resolution is sufficient to verify the binding of a ligand (circled).

Similar articles

Cited by

References

    1. Nogales E. The development of cryo-EM into a mainstream structural biology technique. Nat. Methods. 2016;13:24–27. doi: 10.1038/nmeth.3694. - DOI - PMC - PubMed
    1. Method of the Year 2015. Nat Methods 13, 1 10.1038/nmeth.3730 (2016). - PubMed
    1. Merino, F. & Raunser, S. Cryo-EM as a tool for structure-based drug development. Angewandte Chemie.10.1002/ange.201608432 (2016). - PubMed
    1. Vinayagam, D. et al. Structural basis of TRPC4 regulation by calmodulin and pharmacological agents. bioRxiv. 10.1101/2020.06.30.180778 (2020). - PMC - PubMed
    1. Pospich, S., Merino, F. & Raunser, S. Structural effects and functional implications of phalloidin and jasplakinolide binding to actin filaments. Structure. 10.1016/j.str.2020.01.014 (2020) - PubMed

Publication types