Mapping of the Spinal Sensorimotor Network by Transvertebral and Transcutaneous Spinal Cord Stimulation
- PMID: 33162882
- PMCID: PMC7581734
- DOI: 10.3389/fnsys.2020.555593
Mapping of the Spinal Sensorimotor Network by Transvertebral and Transcutaneous Spinal Cord Stimulation
Abstract
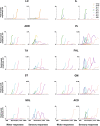
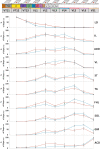
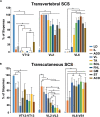
Transcutaneous stimulation is a neuromodulation method that is efficiently used for recovery after spinal cord injury and other disorders that are accompanied by motor and sensory deficits. Multiple aspects of transcutaneous stimulation optimization still require testing in animal experiments including the use of pharmacological agents, spinal lesions, cell recording, etc. This need initially motivated us to develop a new approach of transvertebral spinal cord stimulation (SCS) and to test its feasibility in acute and chronic experiments on rats. The aims of the current work were to study the selectivity of muscle activation over the lower thoracic and lumbosacral spinal cord when the stimulating electrode was located intravertebrally and to compare its effectiveness to that of the clinically used transcutaneous stimulation. In decerebrated rats, electromyographic activity was recorded in the muscles of the back (m. longissimus dorsi), tail (m. abductor caudae dorsalis), and hindlimb (mm. iliacus, adductor magnus, vastus lateralis, semitendinosus, tibialis anterior, gastrocnemius medialis, soleus, and flexor hallucis longus) during SCS with an electrode placed alternately in one of the spinous processes of the VT12-VS1 vertebrae. The recruitment curves for motor and sensory components of the evoked potentials (separated from each other by means of double-pulse stimulation) were plotted for each muscle; their slopes characterized the effectiveness of the muscle activation. The electrophysiological mapping demonstrated that transvertebral SCS has specific effects to the rostrocaudally distributed sensorimotor network of the lower thoracic and lumbosacral cord, mainly by stimulation of the roots that carry the sensory and motor spinal pathways. These effects were compared in the same animals when mapping was performed by transcutaneous stimulation, and similar distribution of muscle activity and underlying neuroanatomical mechanisms were found. The experiments on chronic rats validated the feasibility of the proposed stimulation approach of transvertebral SCS for further studies.
Keywords: decerebrated rat; neuromodulation; sensorimotor network; spinal cord; transcutaneous stimulation; transvertebral spinal cord stimulation.
Copyright © 2020 Shkorbatova, Lyakhovetskii, Pavlova, Popov, Bazhenova, Kalinina, Gorskii and Musienko.
Figures


Similar articles
-
Forward Stepping Evoked by Transvertebral Stimulation in the Decerebrate Cat.Neuromodulation. 2024 Jun;27(4):625-635. doi: 10.1016/j.neurom.2022.11.009. Epub 2022 Dec 23. Neuromodulation. 2024. PMID: 36567242 Free PMC article.
-
Preferential activation of spinal sensorimotor networks via lateralized transcutaneous spinal stimulation in neurologically intact humans.J Neurophysiol. 2019 Nov 1;122(5):2111-2118. doi: 10.1152/jn.00454.2019. Epub 2019 Sep 25. J Neurophysiol. 2019. PMID: 31553681
-
On the reflex mechanisms of cervical transcutaneous spinal cord stimulation in human subjects.J Neurophysiol. 2019 May 1;121(5):1672-1679. doi: 10.1152/jn.00802.2018. Epub 2019 Mar 6. J Neurophysiol. 2019. PMID: 30840527
-
Bipolar transcutaneous spinal stimulation evokes short-latency reflex responses in human lower limbs alike standard unipolar electrode configuration.J Neurophysiol. 2020 Oct 1;124(4):1072-1082. doi: 10.1152/jn.00433.2020. Epub 2020 Aug 26. J Neurophysiol. 2020. PMID: 32845202
-
Contributions to the understanding of gait control.Dan Med J. 2014 Apr;61(4):B4823. Dan Med J. 2014. PMID: 24814597 Review.
Cited by
-
When Spinal Neuromodulation Meets Sensorimotor Rehabilitation: Lessons Learned From Animal Models to Regain Manual Dexterity After a Spinal Cord Injury.Front Rehabil Sci. 2021 Dec 7;2:755963. doi: 10.3389/fresc.2021.755963. eCollection 2021. Front Rehabil Sci. 2021. PMID: 36188826 Free PMC article. Review.
-
Trans-Spinal Electrical Stimulation Therapy for Functional Rehabilitation after Spinal Cord Injury: Review.J Clin Med. 2022 Mar 11;11(6):1550. doi: 10.3390/jcm11061550. J Clin Med. 2022. PMID: 35329875 Free PMC article. Review.
-
Forward Stepping Evoked by Transvertebral Stimulation in the Decerebrate Cat.Neuromodulation. 2024 Jun;27(4):625-635. doi: 10.1016/j.neurom.2022.11.009. Epub 2022 Dec 23. Neuromodulation. 2024. PMID: 36567242 Free PMC article.
References
LinkOut - more resources
Full Text Sources

