. 2020 Nov 6;11(11):957.
doi: 10.1038/s41419-020-03151-z.

Age-severity matched cytokine profiling reveals specific signatures in Covid-19 patients

Affiliations

Age-severity matched cytokine profiling reveals specific signatures in Covid-19 patients

Roberta Angioni et al. Cell Death Dis. .

Abstract

A global effort is currently undertaken to restrain the COVID-19 pandemic. Host immunity has come out as a determinant for COVID-19 clinical outcomes, and several studies investigated the immune profiling of SARS-CoV-2 infected people to properly direct the clinical management of the disease. Thus, lymphopenia, T-cell exhaustion, and the increased levels of inflammatory mediators have been described in COVID-19 patients, in particular in severe cases1. Age represents a key factor in COVID-19 morbidity and mortality2. Understanding age-associated immune signatures of patients are therefore important to identify preventive and therapeutic strategies. In this study, we investigated the immune profile of COVID-19 hospitalized patients identifying a distinctive age-dependent immune signature associated with disease severity. Indeed, defined circulating factors - CXCL8, IL-10, IL-15, IL-27, and TNF-α - positively correlate with older age, longer hospitalization, and a more severe form of the disease and may thus represent the leading signature in critical COVID-19 patients.


Conflict of interest statement

The authors declare no competing interests

Figures

Fig. 1
Fig. 1. Correlative analysis between demographic and clinical parameters in the COVID-19 patient cohort.
A positive correlation between age and HT (A), age and DS (B) or HT and DS (C) was measured by Person coefficient r (95% confidence interval) and two-tailed p-value analysis (indicated inside the square). Correlation analysis of SARS-CoV-2 -specific IgG with HT (D), age (E) or DS (F) measured by Person coefficient r (95% confidence interval) and two-tailed p-value analysis (indicated inside the square). Sex-matched analysis of HT (G), days from symptoms onset to HA (H), and days from symptom onset to hospital discharge (I); all data are expressed as mean of days ± S.E.M. In B, C and F, DS is indicated as following: 0 = mild, 1 = moderate, 2 = severe, 3 = critical.
Fig. 2
Fig. 2. Cytokine correlation to age, HT, and DS in the COVID-19 patient cohort.
Correlation matrix between cytokines and age, DS, and HT (A). The upward slope of the ellipses shows positive correlations in blue whereas downward ones show negative correlations in red. Color intensities and sizes of ellipses are proportional to the absolute value of the corresponding Pearson correlation coefficients (legend at the bottom side). The analytes are clustered according to the similarity of their correlation coefficients (horizontal black lines) using the “hclust” function of the R package “stats” according to the “ward.D2” method applied to ‘manhattan’ distances. Figure generated with the R package corrplot. Individual cytokine details of Pearson’s correlation (95% confidence interval) of the indicated analytes with age (B, gray and horizontal lines), DS (C, orange and vertical lines 0 = mild, 1 = moderate, 2 = severe, 3 = critical) and HT (D, green and diagonal pattern) are indicated within each graph together with the two-tailed p-value analysis (boxed). *p < 0.05, **p < 0.01, ****p < 0.0001.
Fig. 3
Fig. 3. Cytokine profiles stratify COVID-19 patients.
Venn diagram showing cytokines, chemokines, and growth factors as related to Age (Gray), HT (Green), and DS (Orange) (A). Graphs indicate the minimum (Min), maximal (Max), and mean plasma concentration values (pg/ml) of age-dependent (B) or age-independent (C) cytokines, chemokines, and growth factors of patients with the indicated DS score. The P-value (mild versus critical) has been calculated using a non-parametric Mann–Whitney test.
Fig. 4
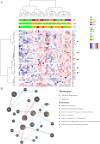
Fig. 4. Cytokine clustering and functional analysis in COVID-19 patients.
Heatmap represents an unsupervised clustering of the Luminex Assay analytes in 44 patients (every vertical line indicates one patient). On top of the severity, age, and HT clinical characteristics of each patient are reported as color codes according to the legend on the right. Clusterings were calculated using the “hclust” function of the R package “stats” according to the “ward.D2” method applied to “manhattan” distances and visualized through the ‘heatmap3’ package. Black arrows indicate the 5 cytokines correlating simultaneously with Age/HT/DS (A). Network integration for the 5 cytokines correlating simultaneously with Age/HT/DS, the connections were built by physical interactions (Red lines), and Pathway association (Green lines), main biological functions enrichment are listed (right) (B), analysis was performed using GeneMANIA algorithm.
Fig. 5
Fig. 5. Clinical relevance of COVID-19-related cytokines.
Correlogram showing a correlation between cytokines, chemokines, and growth factors - that have been shown to positively correlate with at least one of the three parameters (HT, age, and DS) - with the clinical features considered in our study (ESR, CRP, and fibrinogen) (A). Graphs show individual cytokines details of Pearson’s correlation (95% confidence interval) of all the analytes positively correlating with either ESR (green), CRP (red) amd fibrinogen (yellow) (B). Person coefficient r (95% confidence interval) and two-tailed p-value analysis (boxed) were calculated. *p < 0.05, **p < 0.01, ****p < 0.0001.
Fig. 6
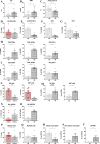
Fig. 6. Age-dependent immune profiling of COVID-19 patients.
Bar-charts showing HT, days (A), ESR, mm/h (B) and antithrombin III, % (C) in younger (<60, light gray) or older (>60, dark gray) COVID-19 patients. Bar-charts showing T lymphocyte percentage (CD3+ T cells) in healthy (red), age-matched controls and COVID-19 patients (gray) (D), or in younger (<60, light gray) or older (>60, dark gray) COVID-19 patients (E). FACS analysis of immune cell subsets in younger (<60) and older (>60) COVID-19 patients. Bar-charts showing the Percentage of total CD8+ (F) or CD4+ (G) lymphocytes and the expression of TIM3, ICOS, and PD1 in younger (<60, light gray) or older (>60, dark gray) (H–I) COVID-19 patients; the percentage of NK and NKT cells in healthy age-matched controls and COVID-19 patients (L); the percentage of NKT and NK cells in younger (<60) and older (>60) COVID-19 patients (M); NKG2A expression in NK cells in healthy age-matched controls or COVID-19 patients (N) and in younger (<60) or older (>60) COVID-19 patients (O); the percentage of CD11b+ myeloid cells in healthy age-matched controls and COVID-19 patients (P) and in younger (<60) or older (>60) COVID19 patients (Q); the percentage of classical CD11b+CD14highCD16 (R), and non-classical CD11b+CD14lowCD16+ (S) monocytes, and LD-PMN CD11b+HLA-DRlownegCD14CD15+CD66b+ (T) in younger (<60) or older (>60) COVID-19 patients. Data are represented as mean of the percentage of parent population ± SEM. Gating strategy in Fig S6. Mann-Whitney test; *p < 0.05, **p < 0.01, ****p < 0.0001. Healthy N = 11, COVID-19 Patients = 10 (<60 N = 5, >60 N = 5).

Similar articles

Cited by

References

    1. Wilk, A. J. et al. A single-cell atlas of the peripheral immune response in patients with severe COVID-19. Nature Medicine [published online ahead of print: 2020]; 10.1038/s41591-020-0944-y. - PMC - PubMed
    1. Banerjee, A. et al. Estimating excess 1-year mortality associated with the COVID-19 pandemic according to underlying conditions and age: a population-based cohort study. The Lancet [published online ahead of print: 2020]; 10.1016/S0140-6736(20)30854-0. - PMC - PubMed
    1. Akbar AN, Gilroy DW. Aging immunity may exacerbate COVID-19. Science. 2020;369:256. - PubMed
    1. Huang, C. et al. Clinical features of patients infected with 2019 novel coronavirus in Wuhan, China. The Lancet [published online ahead of print: 2020]; 10.1016/S0140-6736(20)30183-5. - PMC - PubMed
    1. Chen G, et al. Clinical and immunological features of severe and moderate coronavirus disease 2019. J. Clin. Invest. 2020;130:2620–2629. doi: 10.1172/JCI137244. - DOI - PMC - PubMed

MeSH terms