

3D quantification of changes in pancreatic islets in mouse models of diabetes type I and II
- PMID: 33158929
- PMCID: PMC7758639
- DOI: 10.1242/dmm.045351
3D quantification of changes in pancreatic islets in mouse models of diabetes type I and II
Abstract
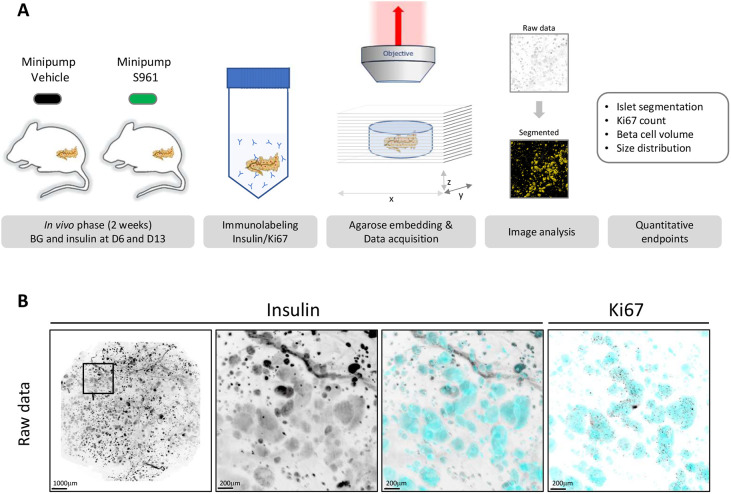
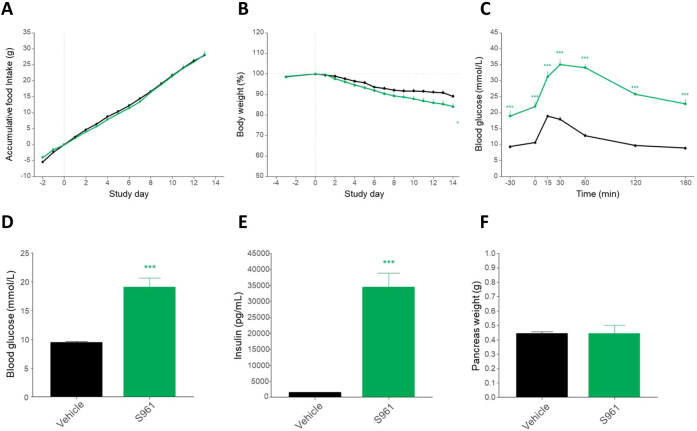
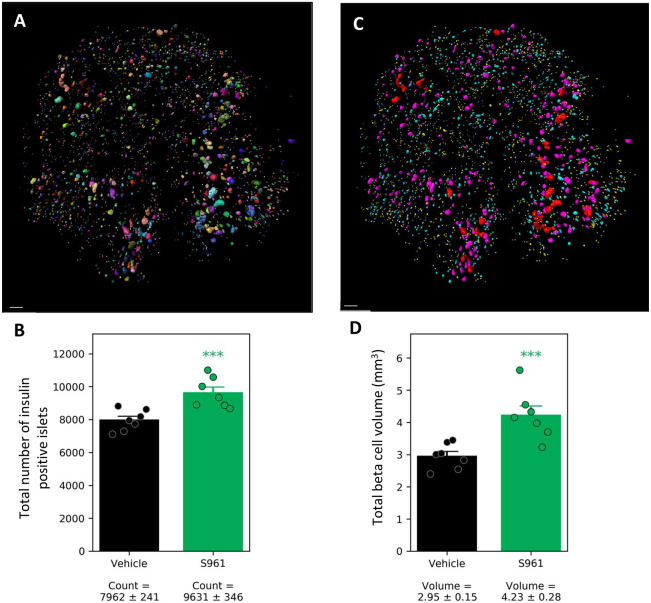
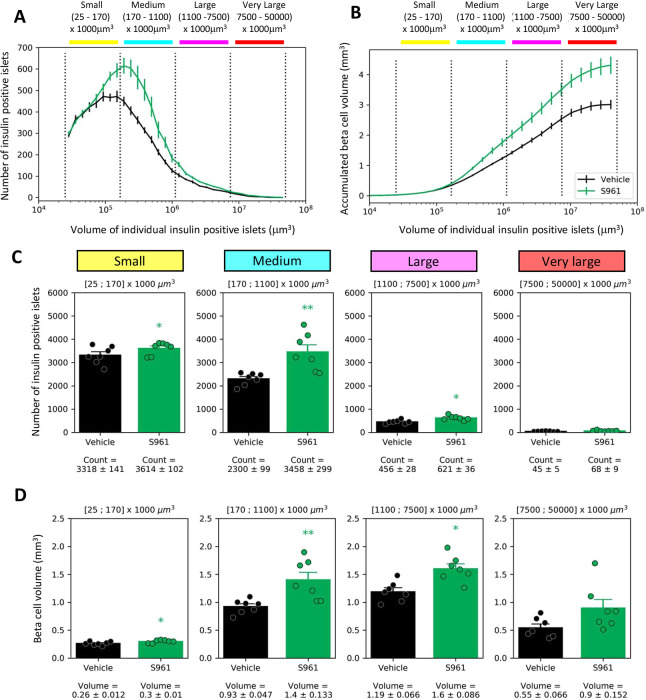
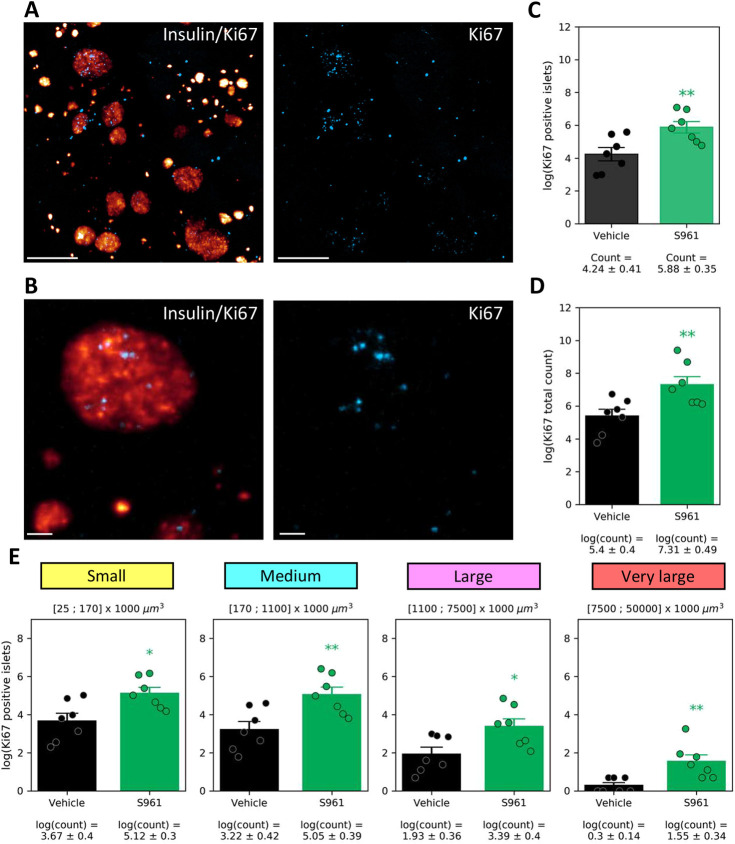
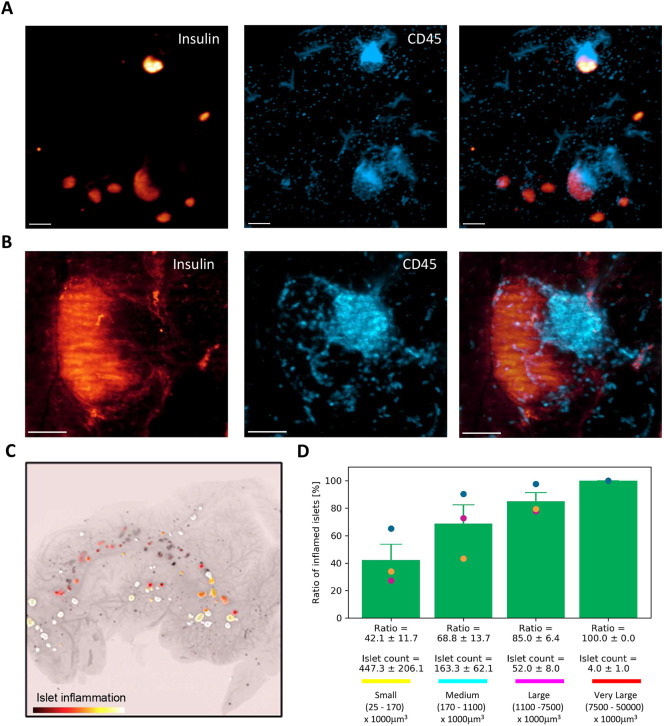
Diabetes is characterized by rising levels of blood glucose and is often associated with a progressive loss of insulin-producing beta cells. Recent studies have demonstrated that it is possible to regenerate new beta cells through proliferation of existing beta cells or trans-differentiation of other cell types into beta cells, raising hope that diabetes can be cured through restoration of functional beta cell mass. Efficient quantification of beta cell mass and islet characteristics is needed to enhance drug discovery for diabetes. Here, we report a 3D quantitative imaging platform for unbiased evaluation of changes in islets in mouse models of type I and II diabetes. To determine whether the method can detect pharmacologically induced changes in beta cell volume, mice were treated for 14 days with either vehicle or the insulin receptor antagonist S961 (2.4 nmol/day) using osmotic minipumps. Mice treated with S961 displayed increased blood glucose and insulin levels. Light-sheet imaging of insulin and Ki67 (also known as Mki67)-immunostained pancreata revealed a 43% increase in beta cell volume and 21% increase in islet number. S961 treatment resulted in an increase in islets positive for the cell proliferation marker Ki67, suggesting that proliferation of existing beta cells underlies the expansion of total beta cell volume. Using light-sheet imaging of a non-obese diabetic mouse model of type I diabetes, we also characterized the infiltration of CD45 (also known as PTPRC)-labeled leukocytes in islets. At 14 weeks, 40% of the small islets, but more than 80% of large islets, showed leukocyte infiltration. These results demonstrate how quantitative light-sheet imaging can capture changes in individual islets to help pharmacological research in diabetes.
Keywords: Beta cells; Inflammation; Insulin; Light-sheet fluorescence microscopy; Tissue clearing.
© 2020. Published by The Company of Biologists Ltd.
Conflict of interest statement
Competing interestsU.R., C.G.S., J.L.S. and J.H.-S. are currently employed by Gubra ApS. N.V. and J.J. are the owners of Gubra ApS. T.K. is employed by Boehringer Ingelheim.
Figures
Similar articles
-
Proposed mechanisms for oligonucleotide IMT504 induced diabetes reversion in a mouse model of immunodependent diabetes.Am J Physiol Endocrinol Metab. 2016 Aug 1;311(2):E380-95. doi: 10.1152/ajpendo.00104.2016. Epub 2016 Jun 21. Am J Physiol Endocrinol Metab. 2016. PMID: 27329801
-
Immunohistochemical analysis of the relationship between islet cell proliferation and the production of the enteroviral capsid protein, VP1, in the islets of patients with recent-onset type 1 diabetes.Diabetologia. 2011 Sep;54(9):2417-20. doi: 10.1007/s00125-011-2192-7. Epub 2011 May 20. Diabetologia. 2011. PMID: 21597997
-
Islet remodeling in female mice with spontaneous autoimmune and streptozotocin-induced diabetes.PLoS One. 2014 Aug 7;9(8):e102843. doi: 10.1371/journal.pone.0102843. eCollection 2014. PLoS One. 2014. PMID: 25101835 Free PMC article.
-
Intraocular in vivo imaging of pancreatic islet cell physiology/pathology.Mol Metab. 2017 May 4;6(9):1002-1009. doi: 10.1016/j.molmet.2017.03.014. eCollection 2017 Sep. Mol Metab. 2017. PMID: 28951824 Free PMC article. Review.
-
Stem cell applications in diabetes.J Stem Cells. 2012;7(4):229-44. J Stem Cells. 2012. PMID: 24196798 Review.
Cited by
-
RRM2 silencing suppresses malignant phenotype and enhances radiosensitivity via activating cGAS/STING signaling pathway in lung adenocarcinoma.Cell Biosci. 2021 Apr 15;11(1):74. doi: 10.1186/s13578-021-00586-5. Cell Biosci. 2021. PMID: 33858512 Free PMC article.
-
Mesoscopic Optical Imaging of the Pancreas-Revisiting Pancreatic Anatomy and Pathophysiology.Front Endocrinol (Lausanne). 2021 Mar 4;12:633063. doi: 10.3389/fendo.2021.633063. eCollection 2021. Front Endocrinol (Lausanne). 2021. PMID: 33746904 Free PMC article. Review.
-
Development of a 3D atlas of the embryonic pancreas for topological and quantitative analysis of heterologous cell interactions.Development. 2022 Feb 1;149(3):dev199655. doi: 10.1242/dev.199655. Epub 2022 Feb 4. Development. 2022. PMID: 35037942 Free PMC article.
-
What lies beyond 100 years of insulin.Dis Model Mech. 2021 Nov 1;14(11):dmm049361. doi: 10.1242/dmm.049361. Epub 2021 Nov 9. Dis Model Mech. 2021. PMID: 34752619 Free PMC article.
-
Pancreas Optical Clearing and 3-D Microscopy in Health and Diabetes.Front Endocrinol (Lausanne). 2021 Apr 26;12:644826. doi: 10.3389/fendo.2021.644826. eCollection 2021. Front Endocrinol (Lausanne). 2021. PMID: 33981285 Free PMC article. Review.
References
-
- Alanentalo T., Lorén C. E., Larefalk Å., Sharpe J., Holmberg D. and Ahlgren U. (2008). High-resolution three-dimensional imaging of islet-infiltrate interactions based on optical projection tomography assessments of the intact adult mouse pancreas. J. Biomed. Opt 13, 054070 10.1117/1.3000430 - DOI - PubMed
MeSH terms
Substances
LinkOut - more resources
Full Text Sources
Medical
Research Materials
Miscellaneous
