. 2021 Feb 1;218(2):e20192203.
doi: 10.1084/jem.20192203.

Optimized gene engineering of murine CAR-T cells reveals the beneficial effects of IL-15 coexpression

Affiliations

Optimized gene engineering of murine CAR-T cells reveals the beneficial effects of IL-15 coexpression

Evripidis Lanitis et al. J Exp Med. .

Abstract

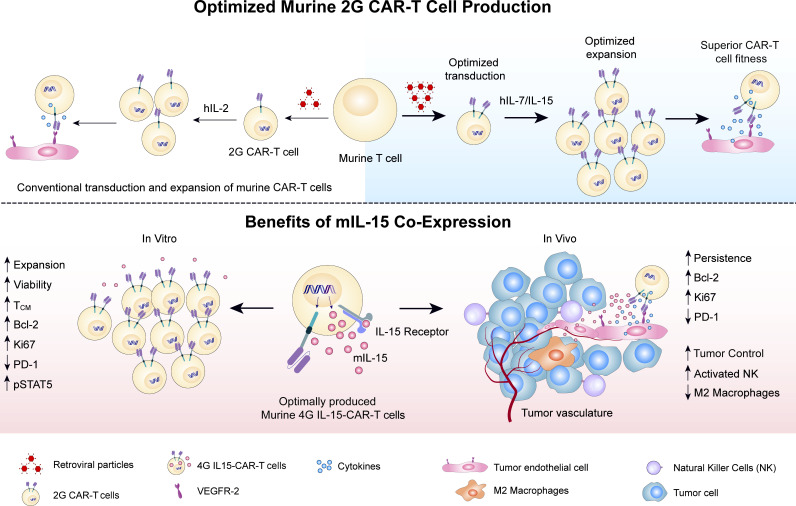
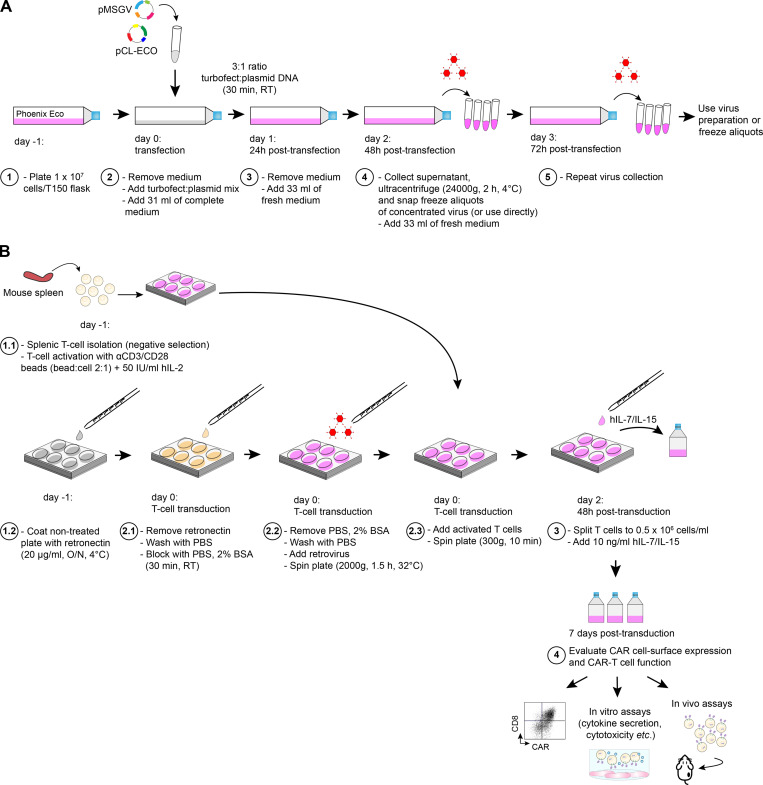
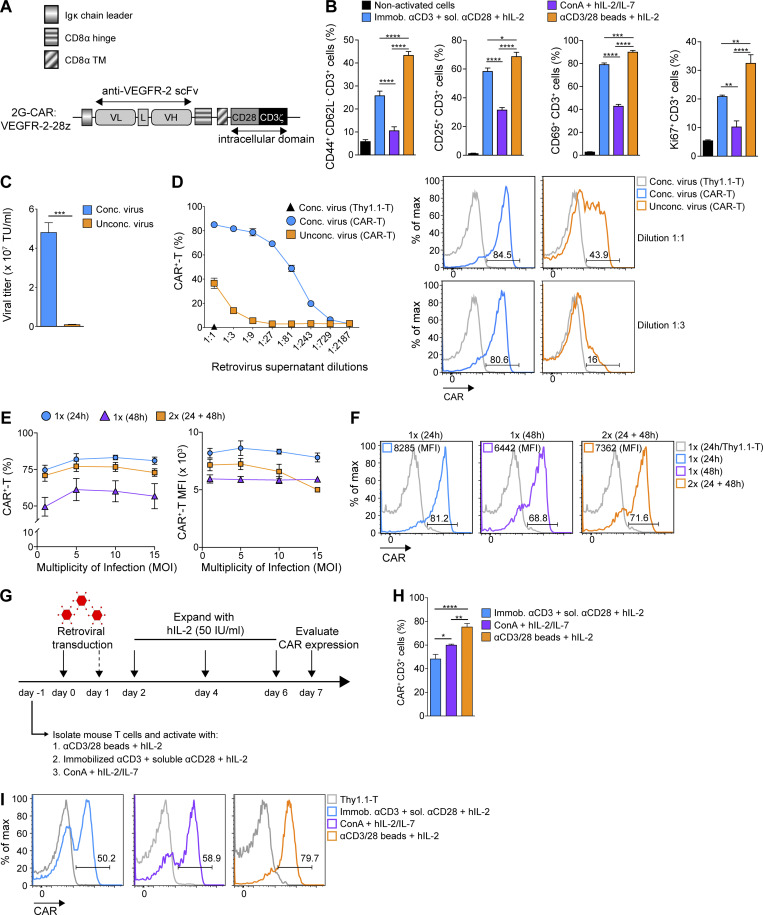
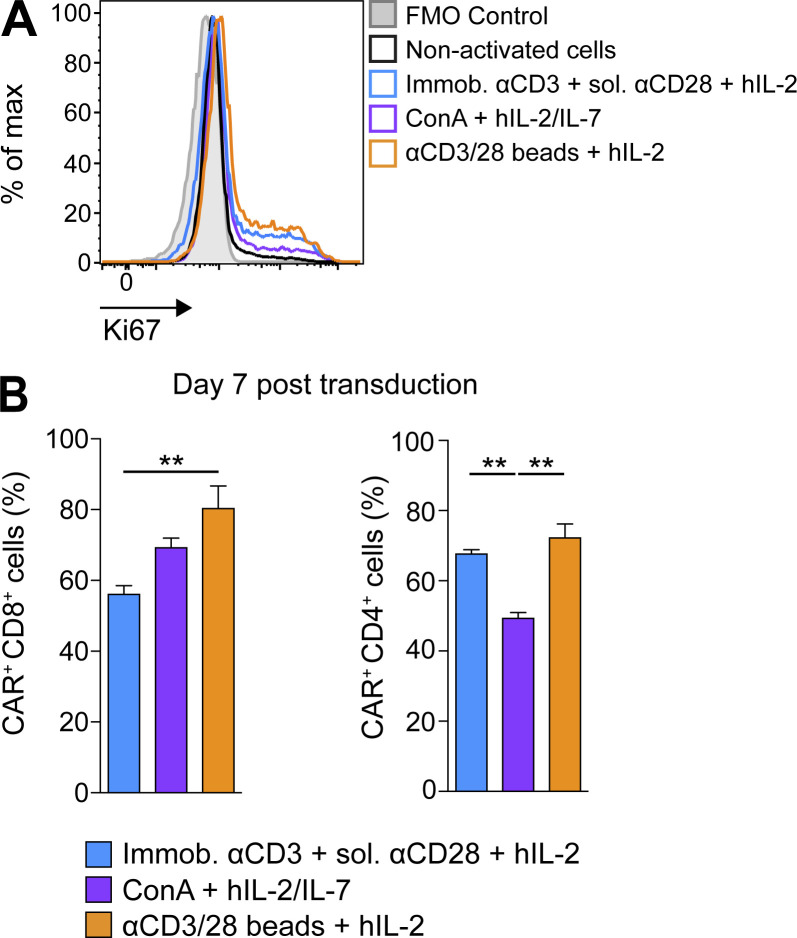
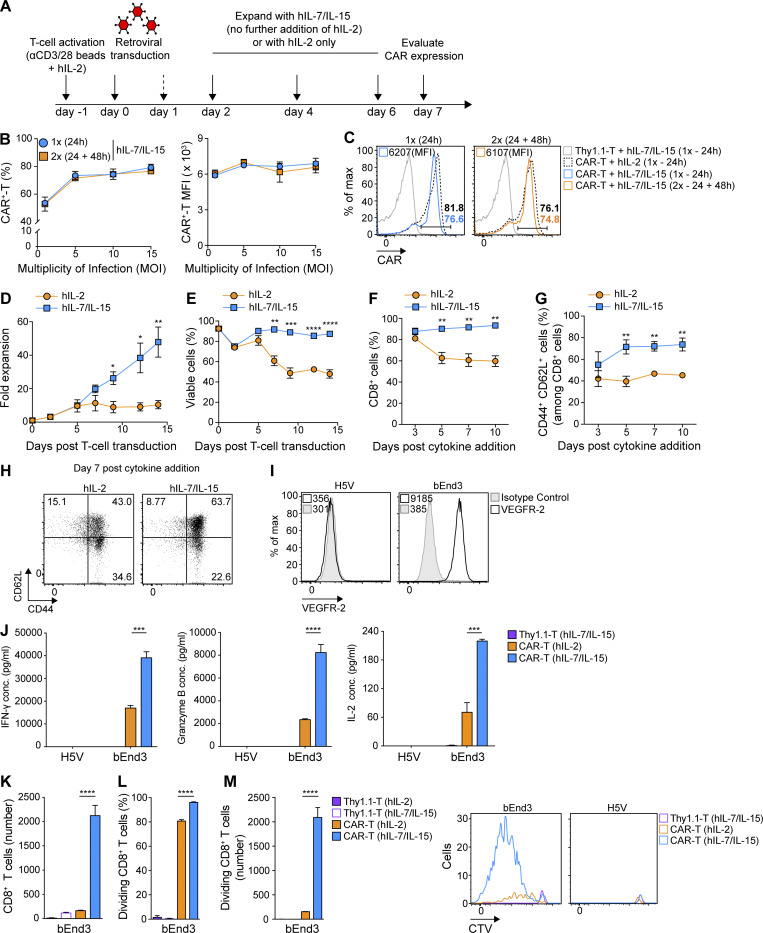
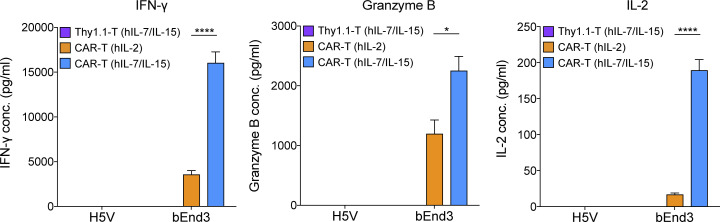
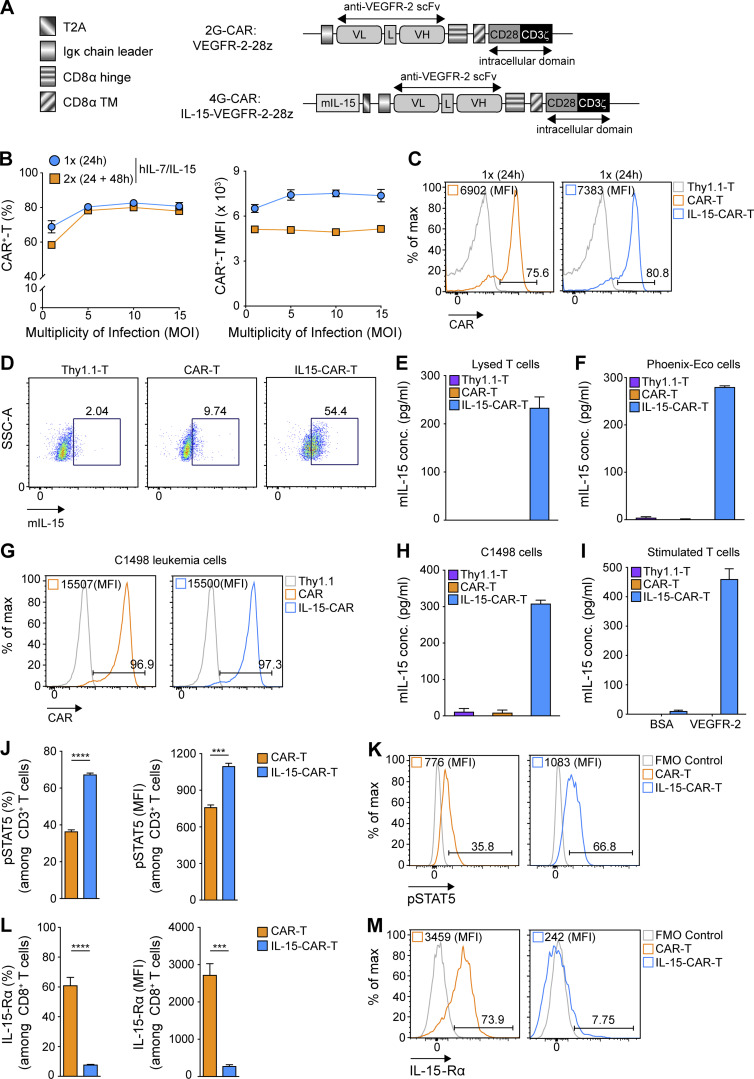
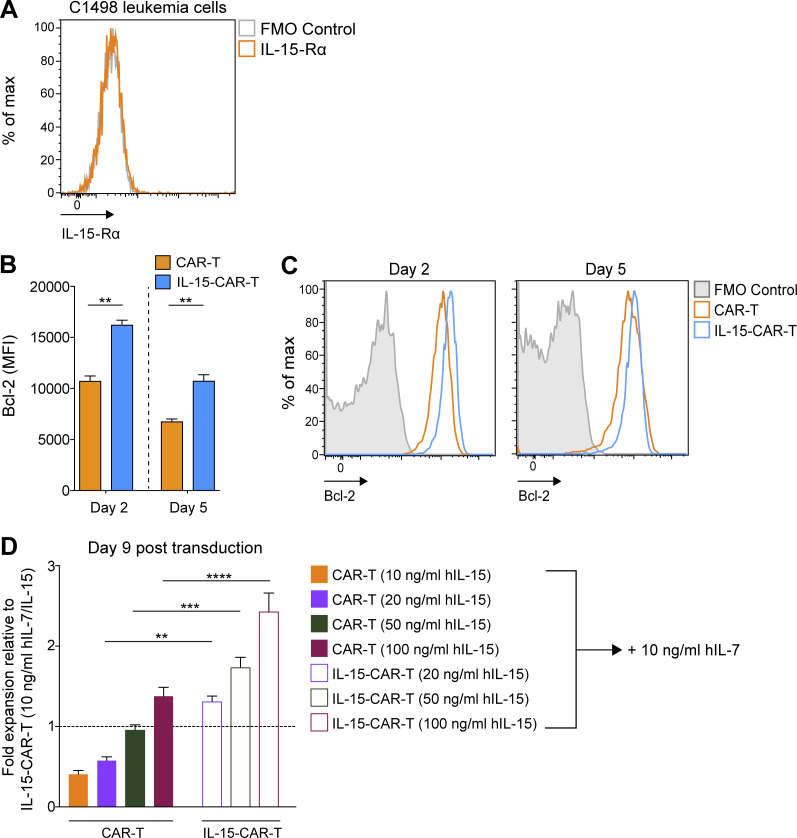
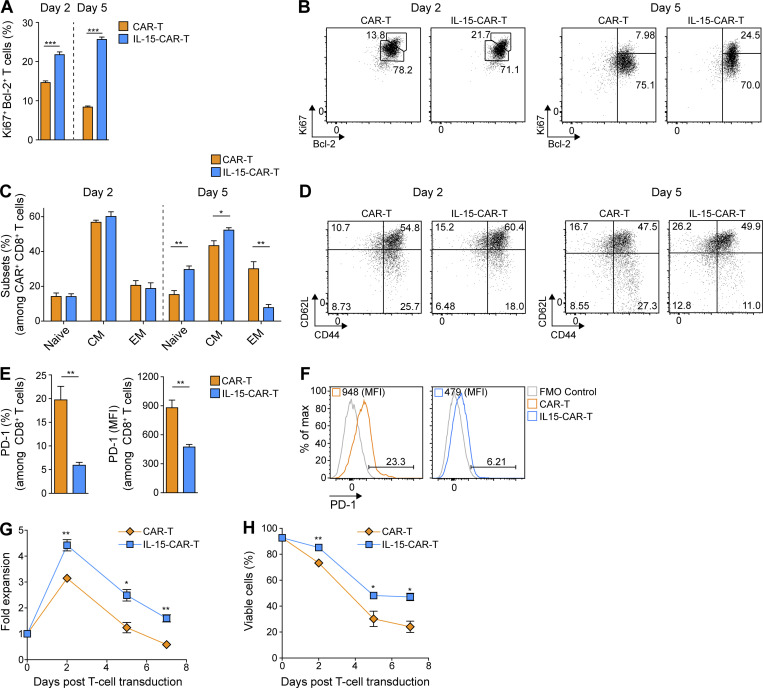
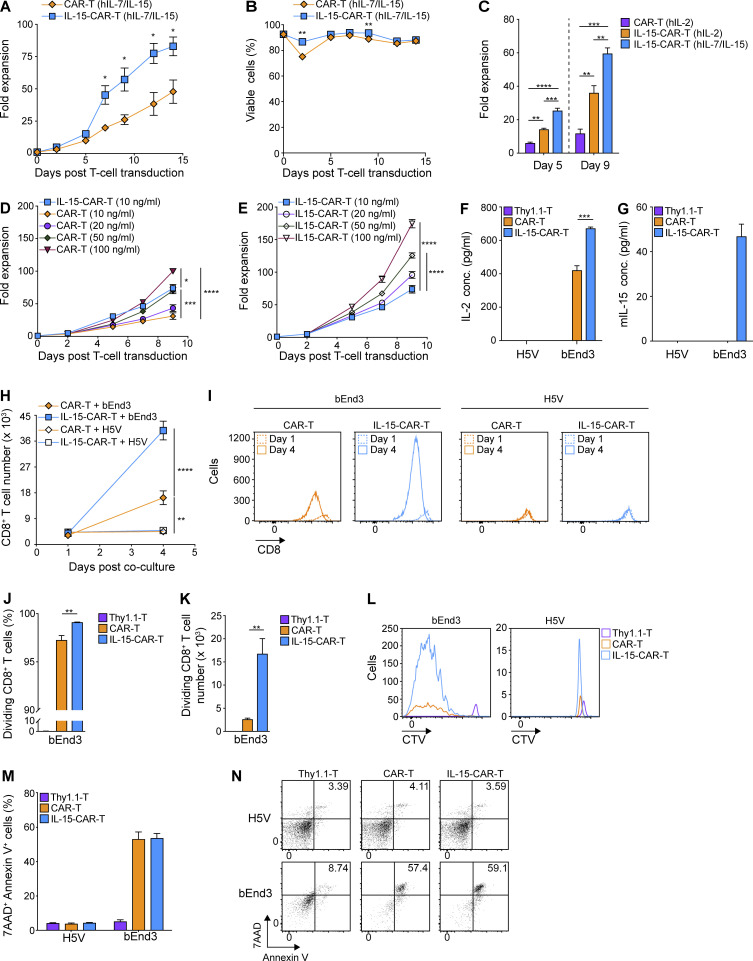
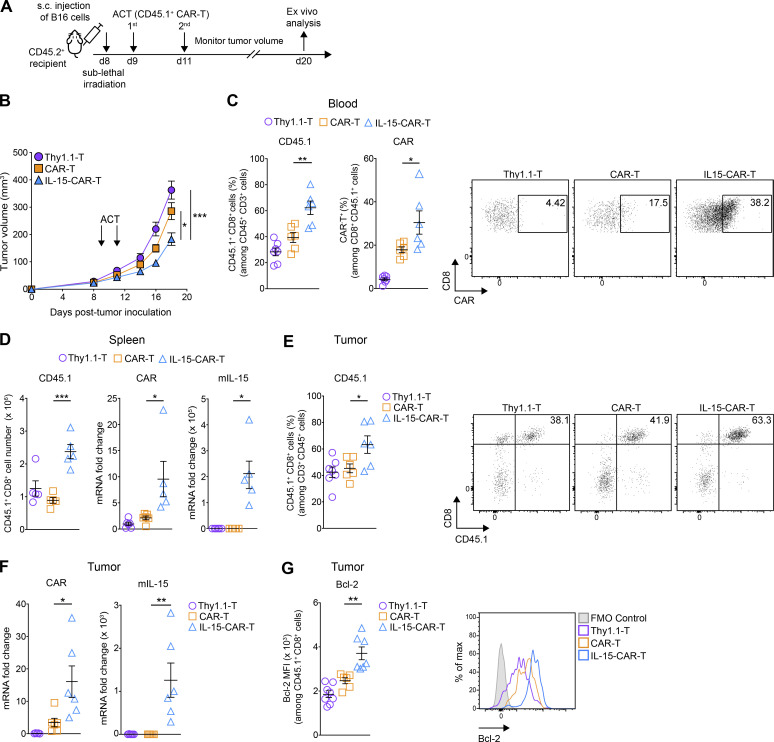
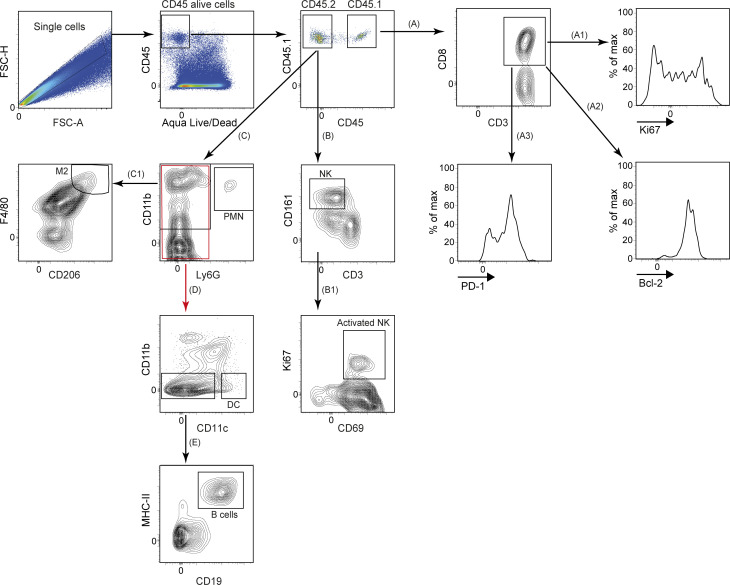
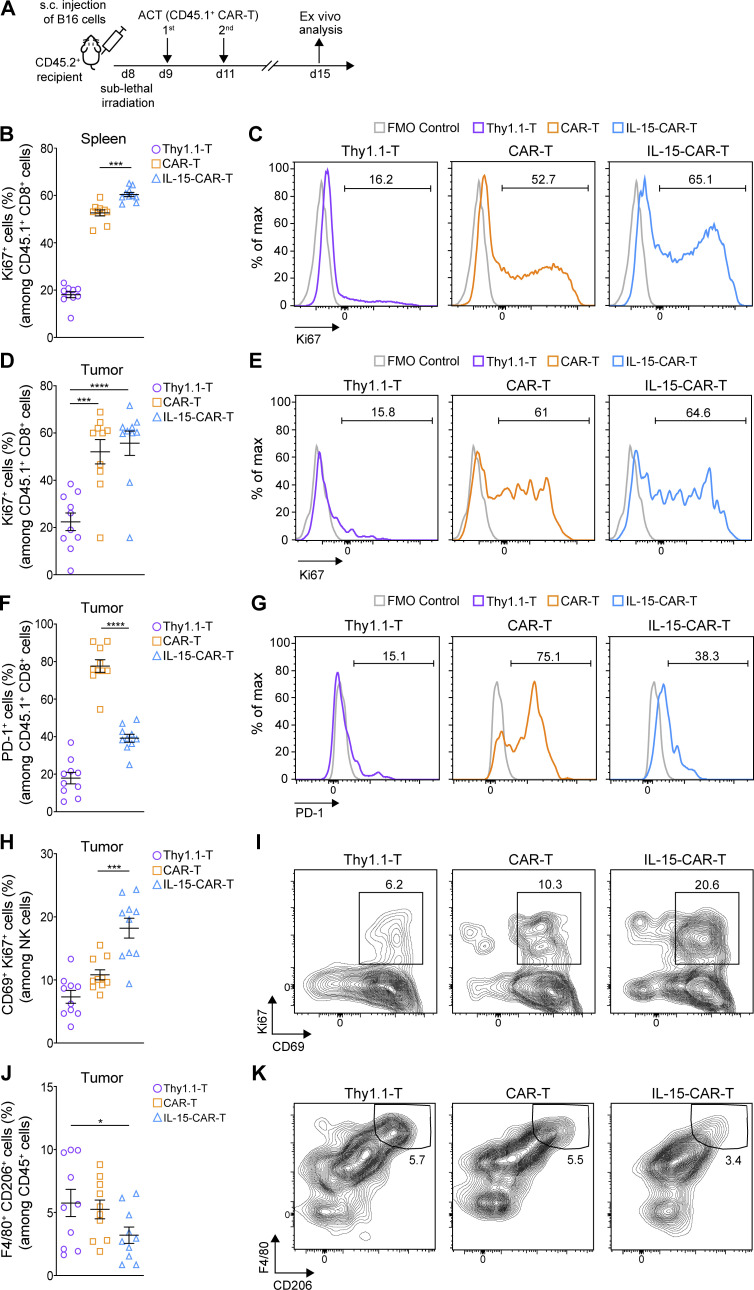
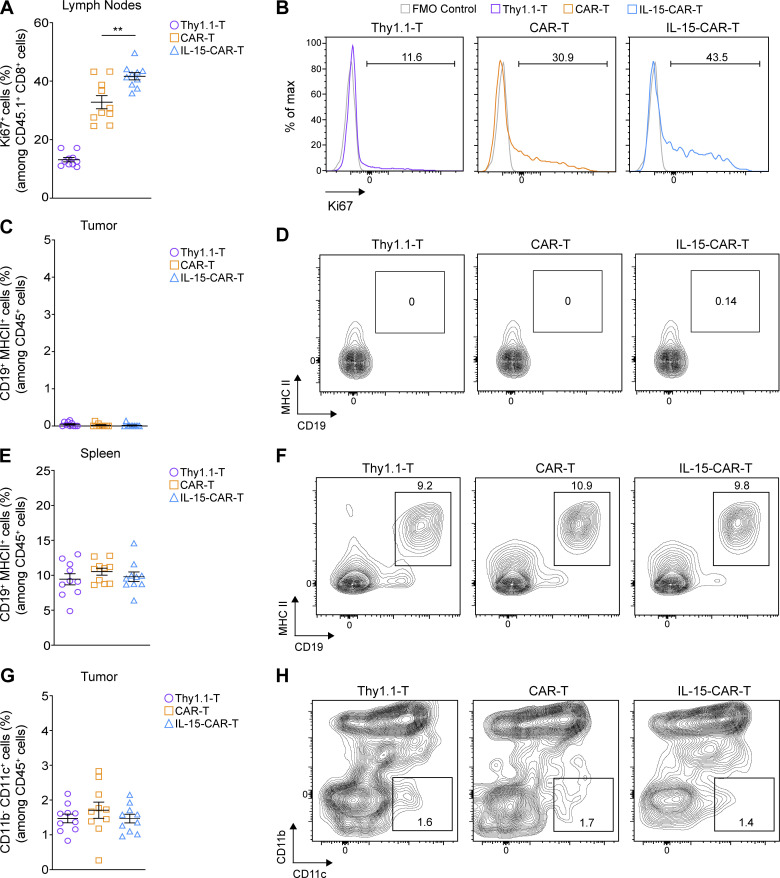
Limited clinical benefit has been demonstrated for chimeric antigen receptor (CAR) therapy of solid tumors, but coengineering strategies to generate so-called fourth-generation (4G) CAR-T cells are advancing toward overcoming barriers in the tumor microenvironment (TME) for improved responses. In large part due to technical challenges, there are relatively few preclinical CAR therapy studies in immunocompetent, syngeneic tumor-bearing mice. Here, we describe optimized methods for the efficient retroviral transduction and expansion of murine T lymphocytes of a predominantly central memory T cell (TCM cell) phenotype. We present a bicistronic retroviral vector encoding both a tumor vasculature-targeted CAR and murine interleukin-15 (mIL-15), conferring enhanced effector functions, engraftment, tumor control, and TME reprogramming, including NK cell activation and reduced presence of M2 macrophages. The 4G-CAR-T cells coexpressing mIL-15 were further characterized by up-regulation of the antiapoptotic marker Bcl-2 and lower cell-surface expression of the inhibitory receptor PD-1. Overall, this work introduces robust tools for the development and evaluation of 4G-CAR-T cells in immunocompetent mice, an important step toward the acceleration of effective therapies reaching the clinic.


Conflict of interest statement

Disclosures: G. Coukos reported grants from Celgene, Boehringer-Ingelheim, Roche, BMS, Iovance Therapeutics, and Kite Pharma; personal fees from Genentech, Roche, BMS, AstraZeneca, NextCure, Geneos Tx, and Sanofi/Aventis outside the submitted work; and had patents in the domain of antibodies and vaccines targeting the tumor vasculature as well as technologies related to T cell expansion and engineering for T cell therapy. G. Coukos holds patents around TEM1 antibodies and receives royalties from the University of Pennsylvania. No other disclosures were reported.

Figures

None
Graphical abstract
Figure 1.
Figure 1.
Overview of retrovirus production and transduction of activated primary murine T cells. (A) For retrovirus production, plated Phoenix Eco cells are transfected with Turbofect and plasmid mix. After 24 h the medium is refreshed, and at 48 and 72 h, the supernatants are collected, and the virus is concentrated by ultracentrifugation and directly used or frozen. (B) For the transduction of primary murine T cells, retrovirus is applied to plates precoated with retronectin and then spun. Activated T cells are then added to the plate, which is subsequently spun. At 48 h after transduction, the T cells are split and hIL-7/IL-15 added to the culture medium. At day 7 after transduction, CAR cell-surface expression is determined by flow cytometry, and the engineered T cells are evaluated in vitro and in vivo. Further details are provided in Materials and methods.
Figure 2.
Figure 2.
Concentration of retrovirus and optimal T cell activation increases transduction efficiency. (A) Diagram of the 2G VEGFR-2–targeted CAR construct (DC101-28z) comprising an Igκ chain leader sequence, the hinge and transmembrane (TM) region of CD8α, the costimulatory ED of CD28, and the ED of CD3ζ (DC101, αVEGFR-2 scFv; L, linker; VH, variable heavy chain; VL, variable light chain). (B) Comparison of activation state of differently stimulated T cells. Numbers represent mean percentage of expression ± SEM of T cells from n = 6 mice pooled from two independent experiments. (C) Virus titer with and without concentration by ultracentrifugation as determined with transduced T cells on day 7 after transduction. Numbers represent mean MOI ± SEM calculated in transduced T cells from n = 3 mice. TU, transducing units. (D) CAR expression on T cells transduced with serially diluted retrovirus as evaluated by flow cytometric analysis. Numbers represent mean percentage of CAR expression ± SEM of T cells from n = 3 mice. Representative histograms of transduced T cells with the indicated dilutions of retroviral supernatants shown. (E) Murine T lymphocytes were transduced once (1×) or twice (2×) after activation (24 and/or 48 h) at increasing MOI. Numbers represent mean percentage of MFI CAR ± SEM of T cells from n = 3 mice. (F) Representative histograms showing CAR frequency and expression level at day 7 after transduction. The experiments in C–Fwere repeated three times. (G) Schematic diagram of different murine T cell activation and transduction methods tested. (H) Evaluation of CAR frequency following different activation methods. Numbers represent mean percentage of CAR ± SEM of T cells from n = 5 mice pooled from two independent experiments. (I) Representative histograms of CAR expression for differently activated T cells at day 7 after transduction. Statistical analyses were performed using a one-way ANOVA with Tukey post hoc correction test (B and H) and a two-tailed unpaired Student’s t test (C): *, P < 0.05; **, P < 0.01; ***, P < 0.001; ****, P < 0.0001.
Figure S1.
Figure S1.
Stimulation with αCD3/CD28 beads leads to the highest T cell activation and CAR transduction efficiency. (A) Representative histograms of Ki67 expression in differently activated T cells. (B) Graph bars present the mean percentage CAR expression ± SEM on differently activated and transduced CD8+ and CD4+ T cells on day 7 after transduction. All results show mean ± SEM of T cells from n = 5 mice (B, left) or n = 3 mice (B, right). The experiment was repeated twice. Statistical analyses were performed using a one-way ANOVA with Tukey post hoc correction test: **, P < 0.01. FMO, fluorescence minus one.
Figure 3.
Figure 3.
CAR-T cells cultured with hIL-2 followed by hIL-7/IL-15 exhibit greater expansion, viability, and central memory phenotype than CAR-T cells cultured with hIL-2 only. (A) Overview of primary murine T cell activation, transduction, and expansion. On day 2 after transduction, the culture medium was supplemented with hIL-2 or hIL-7/IL-15. (B) CAR expression on splenic murine T cells transduced either at 24 h only, or at 24 and 48 h after activation, at increasing MOI. Values represent mean percentage and MFI CAR expression ± SEM of T cells from n = 3 mice. The experiment was repeated twice. (C) Representative flow cytometry data of CAR expression on day 7 after the first transduction in transduced T cells cultured in hIL-2 only, or hIL-2 plus hIL-7/IL-15 from day 2 after first transduction. Thy1.1-T cells were used as a negative control. (D and E) CAR-T cell expansion (D) and viability (E) upon culture in hIL-2 versus hIL-2 followed by hIL-7/IL-15. The graphs show the mean percentage of expansion (D) or viability (E) ± SEM of T cells from n = 4 mice pooled from two independent experiments. (F) Percentage of CD8+ T cells upon expansion in hIL-2 versus hIL-7/IL-15. Shown are the mean percentage of CD8+ T cells ± SEM from n = 4 mice. (G) Percentage of TCM cells (CD44+ CD62L+) upon expansion in hIL-2 versus hIL-7/IL-15. Numbers represent the mean percentage of TCM cells ± SEM from n = 4 mice pooled from two independent experiments. (H) Representative flow cytometric analysis for G on day 7 after cytokine addition. Experiments in D–H were repeated four times. (I) Flow cytometric analysis of endothelial cells stained with αVEGFR-2 Ab. The MFI values are indicated. (J) Secretion levels of IFN-γ, granzyme B, and IL-2 by CAR-T cells expanded in hIL-2 versus hIL-7/IL-15 upon co-culture with bEnd3 or H5V cells. Graph bars present the mean cytokine concentration (pg/ml) ± SEM from triplicate wells with T cells pooled from n = 4 mice. (K–M) Persistence (K) and division (L and M) of CTV-stained CAR-T cells expanded in hIL-2 or hIL-7/IL-15 upon co-culture with target cells. Graphs present the mean values ± SEM of T cells from n = 3 mice. Representative flow cytometric analysis for the CTV proliferation assay is shown in M. Experiments in I–M were repeated three times. Statistical analyses were performed using a two-tailed unpaired Student’s t test (D–G) and a one-way ANOVA with Tukey post hoc correction test (J–M): *, P < 0.05; **, P < 0.01; ***, P < 0.001; ****, P < 0.0001.
Figure S2.
Figure S2.
Enhanced effector functions of CD8+ CAR-T cells expanded with hIL-7/IL-15 versus hIL-2. Secretion levels of IFN-γ, granzyme B, and IL-2 by CD8+ CAR-T cells expanded in hIL-2 versus hIL-7/IL-15, upon co-culture with bEnd3 or H5V cells. Graph bars present the mean cytokine concentration (pg/ml) ± SEM of triplicate wells with T cells pooled from n = 5 mice. The experiment was repeated twice. Statistical analyses were performed using a one-way ANOVA with Tukey post hoc correction test: *, P < 0.05; ****, P < 0.0001.
Figure 4.
Figure 4.
Murine T cells efficiently transduced to coexpress anti-VEGFR-2 CAR and functionally active mIL-15. (A) Comparison of the 2G-CAR construct (DC101-28z) and a bicistronic vector encoding both mIL-15 and the anti-VEGFR-2 CAR (4G-CAR construct). (B) Murine T cells were transduced once (1×) or twice (2×) with 4G-CAR retrovirus at 24 h or 24 and 48 h after activation at increasing MOI. Numbers represent mean percentage and MFI of CAR ± SEM for T cells from n = 3 mice. The experiment was repeated twice. (C) Representative flow cytometry data of 2G- and 4G-CAR expression by murine T cells on day 7 after transduction. (D) Representative flow cytometry plots showing intracellular mIL-15 production by 4G-CAR-T cells as compared with 2G-CAR-T cells and Thy1.1-T cells. The experiment was performed using T cells pooled from n = 4 mice and was repeated three times. (E) mIL-15 protein expression by 4G-CAR-T cells determined by ELISA of the supernatant of lysed T cells. Results are presented as the mean concentration (pg/ml) ± SEM from triplicate wells with T cells pooled from n = 4 mice. The experiment was repeated twice. (F) Evaluation of mIL-15 levels in the supernatant of Phoenix cells 72 h after transfection. Results are presented as the mean concentration (pg/ml) ± SEM of triplicate wells. The experiment was repeated four times. (G) Flow cytometry histograms showing CAR expression on C1498 murine leukemia cells transduced to express 2G- or 4G-CAR or Thy1.1. (H) mIL-15 detected in the supernatant of 4G-CAR engineered C1498 leukemia cells. Results show the mean concentration (pg/ml) ± SEM of triplicate wells. (I) Measurement of mIL-15 secretion by 2G- and 4G-CAR-T cells at 24 h after stimulation with recombinant mVEGFR-2 or BSA. Numbers represent mean concentration (pg/ml) ± SEM of triplicate wells with T cells pooled from n = 5 mice. (J) Phosphorylated (p) STAT5 expression by 2G- versus 4G-CAR-T cells on day 2 after transduction. Numbers represent mean percentage and MFI pSTAT5 ± SEM of T cells from n = 3 mice. (K) Representative flow cytometry histograms showing pSTAT5 frequency and levels in 2G- or 4G-CAR-T cells. (L) IL-15-Rα expression by 2G- versus 4G-CAR-T cells on day 5 after transduction in the absence of exogenous cytokines. Numbers represent mean frequency and MFI of IL-15-Rα ± SEM of T cells from n = 4 mice. (M) Representative flow cytometry histograms showing IL-15-Rα frequency and levels for 2G- or 4G-CAR-T cells. Experiments in G–M were repeated three times. Statistical analyses in J and L were performed using a two-tailed unpaired Student’s t test: ***, P < 0.001; ****, P < 0.0001. FMO, fluorescence minus one; SSC-A, side scatter area.
Figure S3.
Figure S3.
Enhanced properties of 4G-CAR-T cells efficiently coexpressing mIL-15. (A) Assessment of IL-15-Rα expression on murine C1498 leukemia cells. Representative flow cytometry histogram of IL-15-Rα expression on C1498 cells. (B) Graph bars present the mean MFI of Bcl-2 ± SEM in 2G- versus 4G-CAR-T cells on days 2 and 5 after transduction from n = 3 mice. (C) Representative histograms showing intracellular levels of Bcl-2 in CD8+ 2G- versus 4G-CAR-T cells. The experiments in A–C were repeated three times. (D) Fold expansion of 2G- and 4G-CAR-T cells (by day 9 after transduction) cultured in the indicated concentrations of hIL-15 (10, 20, 50, and 100 ng/ml) and 10 ng/ml hIL-7 relative to 4G-CAR-T cells expanded in medium supplemented with 10 ng/ml hIL-7/IL-15. Shown are the mean values of relative fold expansion ± SEM of T cells from n = 5 mice. The experiment was repeated twice. Statistical analyses were performed using a two-tailed unpaired Student’s t test (B) and a one-way ANOVA with Tukey post hoc correction test (D): **, P < 0.01; ***, P < 0.001; ****, P < 0.0001. FMO, fluorescence minus one.
Figure 5.
Figure 5.
4G-CAR-T cells coexpressing mIL-15 exhibit enhanced in vitro fitness as compared with 2G-CAR-T cells. (A) Ki67 and Bcl-2 expression by 2G- versus 4G-CAR-T cells on days 2 and 5 after transduction in the absence of exogenous cytokines. Results presented are mean percentage ± SEM of T cells from n = 3 mice. (B) Representative flow cytometric analyses of 2G- and 4G-CAR-T cells stained with αKi67 and αBcl-2 Abs on days 2 and 5 after transduction. (C) Percentages of naive (CD44low CD62Lhigh), CM (CD44high CD62Lhigh), and EM (CD44high CD62Llow) of 2G- versus 4G-CAR-T cells on days 2 and 5 after transduction in the absence of exogenous cytokines. The analysis was performed using T cells derived from n = 3 mice. (D) Representative flow cytometry plots showing CD44 and CD62L expression on 2G- and 4G-CAR-T cells. Experiments in A–Dwere repeated three times. (E) PD-1 expression by 2G- versus 4G-CAR-T cells on day 5 after transduction in the absence of exogenous cytokines. Results present the mean percentage and MFI of PD-1 ± SEM of T cells from n = 3 mice. (F) Representative flow cytometry histograms showing PD-1 frequency and MFI for 2G- versus 4G-CAR-T cells. (G and H) Fold expansion (G) and viability (H) of 2G- versus 4G-CAR-T cells in the absence of exogenous cytokines. Graphs present the mean fold expansion (G) or percentage of viability (H) ± SEM of T cells from n = 3 mice. Experiments in E–H were repeated four times. Statistical analyses in A, C, E, G, and H were performed using a two-tailed unpaired Student’s t test: *, P < 0.05; **, P < 0.01; ***, P < 0.001.
Figure 6.
Figure 6.
4G-CAR-T cells coexpressing mIL-15 exhibit robust expansion during culture and enhanced IL-2 secretion and proliferation in response to antigenic stimulation. (A and B) Expansion (A) and viability (B) of 2G- versus 4G-CAR-T cells in the presence of exogenous hIL-7/IL-15 from day 2 after transduction. Results present the mean fold expansion (A) or percentage of viable cells (B) ± SEM of T cells from n = 4 mice pooled from two independent experiments. Experiments in A and B were repeated four times. (C) Expansion of 2G- versus 4G-CAR-T cells in the presence of the indicated cytokines. Graphs present the mean fold expansion ± SEM of T cells from n = 3 mice on days 5 and 9 after transduction. The experiment was repeated three times. (D) Expansion of 2G-CAR-T cells in T cell medium supplemented with the indicated concentrations of hIL-15 (10, 20, 50, and 100 ng/ml) and 10 ng/ml hIL-7 in comparison to 4G-CAR-T cells expanded with 10 ng/ml hIL-7/IL-15. Cytokines were added from day 2 after transduction and replenished every 2–3 d. Shown are the mean fold expansion values ± SEM of T cells from n = 5 mice. (E) Expansion of 4G-CAR-T cells cultured in the indicated concentrations of hIL-15 and 10 ng/ml hIL-7. Shown are the mean values of fold expansion ± SEM of T cells from n = 5 mice. Experiments in D and E were repeated twice. (F) IL-2 production by 2G- versus 4G-CAR-T cells upon co-culture with target cells. Results present the mean concentration (pg/ml) ± SEM in triplicate wells with T cells pooled from n = 4 mice. (G) Measurement of mIL-15 secretion by 2G- and 4G-CAR-T cells at 24 h after co-culture with target cells at a CAR+ T cell to target cell ratio of 2:1. Numbers represent mean concentration (pg/ml) ± SEM in co-culture supernatants with T cells from n = 4 mice. (H) Expansion of 2G- versus 4G-CAR-T cells after co-culture with target cells. Results present the mean number of CD8+ T cells ± SEM for n = 5 mice. (I) Shown are representative flow cytometric examples indicating the numbers of CD8+ T cells in the co-cultures of 2G- and 4G-CAR-T cells with target cells on days 1 and 4 after co-culture. (J and K) Percentage (J) or number (K) of dividing CD8+ T cells upon co-culture with bEnd3 cells. Results shown are mean values ± SEM of T cells from n = 4 mice. (L) Shown is a representative flow cytometric analysis of CTV-stained CAR-T cells co-cultured with bEnd3 or H5V cells. (M) Quantification of target cell apoptosis on day 3 after co-culture with 2G- or 4G-CAR-T cells using Annexin V and 7-AAD staining. The graph presents mean values ± SEM of Annexin V+/7-AAD+ target cells upon co-culture with T cells from n = 3 mice. (N) Representative dot plots of Annexin V+/7-AAD+ target cells following CAR-T cell co-culture. Experiments in F–N were repeated three times. Statistical analyses were performed using a two-tailed unpaired Student’s t test (A and B) and a one-way ANOVA with Tukey post hoc correction test (C–F, H, J, and K): *, P < 0.05; **, P < 0.01; ***, P < 0.001; ****, P < 0.0001.
Figure 7.
Figure 7.
4G-CAR-T cells achieve higher in vivo tumor control and persistence than 2G-CAR-T cells. (A) Schematic of ACT study and ex vivo analysis. (B) Assessment of tumor control over time for the different treatment groups. Results are expressed as mean tumor volume (mm3 ± SEM) with n = 18 mice per group pooled from three independent experiments. The experiment was repeated four times. (C) Abundance of transferred T cells in the blood (day 11 after transfer), as measured by CD45.1 staining (left) and CAR expression levels (right) (n = 6 mice per group). Shown are representative dot plots for the assessment of CAR expression. The experiments in C (left and right) were repeated three and two times, respectively. (D) Number of transferred T cells (left) and relative mRNA quantification of the CAR (middle) and mIL-15 (right) transgenes in the spleens (n = 5–6 mice per group). The experiment in the left panel was repeated three times, and the experiments in the middle and right panels were repeated twice. (E) Abundance of transferred T cells in the tumors as measured by CD45.1 staining (n = 6–7 mice per group). Shown are representative dot plots for the frequency of tumor-residing CD45.1+ CD8+ T cells. The experiment was repeated three times. (F) Relative mRNA quantification of the CAR (left) and mIL-15 (right) transgenes in the tumors (n = 5–6 mice per group). The experiments were repeated twice. (G) Expression levels of Bcl-2 (MFI) in tumor-infiltrating transferred T cells (n = 6–8 mice per group) along with representative histograms. The experiment was repeated three times. All experimental data show mean values ± SEM. Statistical analyses were performed using a two-way repeated measures ANOVA with Tukey post hoc correction test (B) and a one-way ANOVA with Tukey post hoc correction test (C–G): *, P < 0.05; **, P < 0.01; ***, P < 0.001.
Figure S4.
Figure S4.
Workflow demonstrating the ex vivo gating strategy. Shown is the flow cytometry gating strategy for evaluating the phenotype of adoptively transferred CD45.1+ CD8+ T cells (A1–A3), the activation status of NK cells (B1) and the identification of M2 macrophages (C1), DCs (D), and B cells (E). FSC-A, forward scatter area; FSC-H, forward scatter height.
Figure 8.
Figure 8.
4G-CAR-T cells coexpressing mIL-15 are characterized by lower PD-1 expression than 2G-CAR-T cells in vivo and promote TME remodeling. (A) Schematic of ACT study and ex vivo analysis. (B–E) Assessment of Ki67 expression in the transferred T cells in the spleens (B) and tumors (D) of all treatment groups. Representative flow cytometry histograms showing the frequency of Ki67 in the transferred T cells in the spleens (C) and tumors (E). (F) Evaluation of PD-1 expression on the transferred T cells in the tumors. (G) Representative histograms showing the frequency of PD-1 among the transferred tumor-infiltrating T cells. (H) Assessment of the frequency of activated (CD69+ Ki67+) tumor-residing NK cells. (I) Representative contour plots showing the frequency of activated tumor-residing NK cells. (J) Assessment of the frequency of M2 (F4/80+ CD206+) tumor-infiltrating macrophages among the CD45+ cells. (K) Representative contour plots showing the frequency of tumor-residing M2 macrophages in all treatment groups. Graphs in B, D, F, H, and J present mean frequencies ± SEM of n = 10 mice pooled from two independent experiments. Statistical analyses were performed using a one-way ANOVA with Tukey post hoc correction test (B, D, F, and H) and a one-way ANOVA followed by Fisher’s least significant difference test (J): *, P < 0.05; **, P < 0.01; ***, P < 0.001; ****, P < 0.0001. FMO, fluorescence minus one.
Figure S5.
Figure S5.
Ex vivo analysis of CAR-T cell–treated mice. (A and B) Assessment of Ki67 expression in the transferred T cells in the tumor-draining lymph nodes and representative flow cytometry histograms. (C–F) Assessment of the frequency of B cells (CD19+ MHCII+) among CD45+ cells in the tumors (C) and spleens (E) of treated mice along with representative contour plots shown in D and F, respectively. (G and H) Assessment of the frequency of tumor-residing DCs (CD11b CD11c+) among CD45+ cells of treated mice (G) and representative contour plots (H). Graphs in A, C, E, and G present mean frequencies ± SEM obtained at day 6 after ACT from n = 10 mice pooled from two independent experiments. Statistical analysis in A was performed using a one-way ANOVA with Tukey post hoc correction test: **, P < 0.01.

Similar articles

Cited by

References

    1. Adachi, K., Kano Y., Nagai T., Okuyama N., Sakoda Y., and Tamada K.. 2018. IL-7 and CCL19 expression in CAR-T cells improves immune cell infiltration and CAR-T cell survival in the tumor. Nat. Biotechnol. 36:346–351. 10.1038/nbt.4086 - DOI - PubMed
    1. Ahmadzadeh, M., Johnson L.A., Heemskerk B., Wunderlich J.R., Dudley M.E., White D.E., and Rosenberg S.A.. 2009. Tumor antigen-specific CD8 T cells infiltrating the tumor express high levels of PD-1 and are functionally impaired. Blood. 114:1537–1544. 10.1182/blood-2008-12-195792 - DOI - PMC - PubMed
    1. Avanzi, M.P., Yeku O., Li X., Wijewarnasuriya D.P., van Leeuwen D.G., Cheung K., Park H., Purdon T.J., Daniyan A.F., Spitzer M.H., and Brentjens R.J.. 2018. Engineered Tumor-Targeted T Cells Mediate Enhanced Anti-Tumor Efficacy Both Directly and through Activation of the Endogenous Immune System. Cell Rep. 23:2130–2141. 10.1016/j.celrep.2018.04.051 - DOI - PMC - PubMed
    1. Baumann, J.G., Unutmaz D., Miller M.D., Breun S.K., Grill S.M., Mirro J., Littman D.R., Rein A., and KewalRamani V.N.. 2004. Murine T cells potently restrict human immunodeficiency virus infection. J. Virol. 78:12537–12547. 10.1128/JVI.78.22.12537-12547.2004 - DOI - PMC - PubMed
    1. Brown, C.E., Alizadeh D., Starr R., Weng L., Wagner J.R., Naranjo A., Ostberg J.R., Blanchard M.S., Kilpatrick J., Simpson J., et al. . 2016. Regression of Glioblastoma after Chimeric Antigen Receptor T-Cell Therapy. N. Engl. J. Med. 375:2561–2569. 10.1056/NEJMoa1610497 - DOI - PMC - PubMed

Publication types

MeSH terms