. 2021 Jan 4;220(1):e202002150.
doi: 10.1083/jcb.202002150.

The ER cholesterol sensor SCAP promotes CARTS biogenesis at ER-Golgi membrane contact sites

Affiliations

The ER cholesterol sensor SCAP promotes CARTS biogenesis at ER-Golgi membrane contact sites

Yuichi Wakana et al. J Cell Biol. .

Abstract

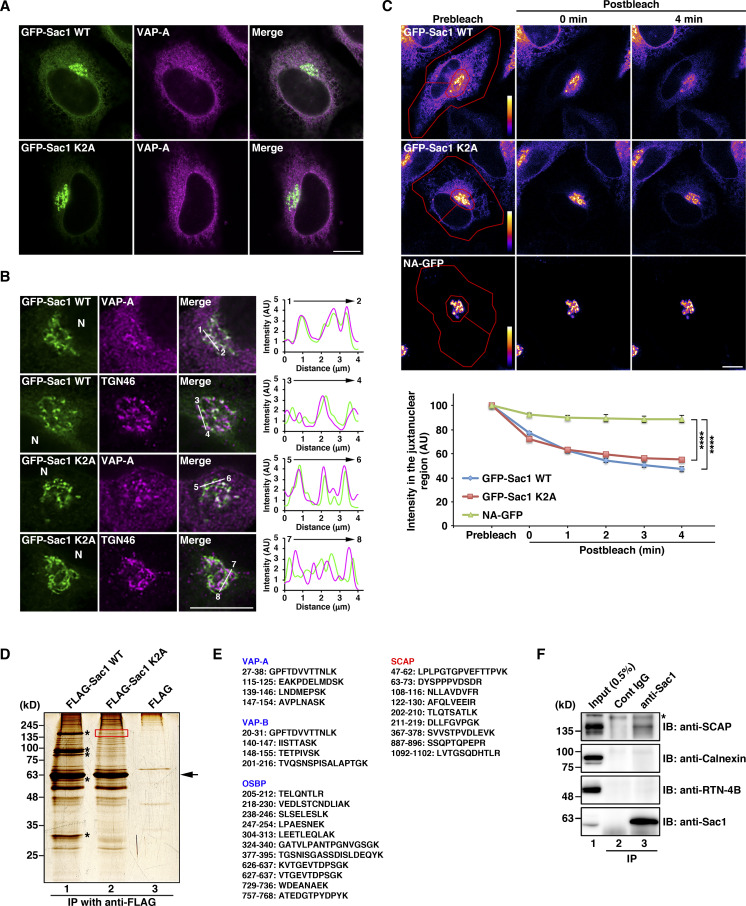
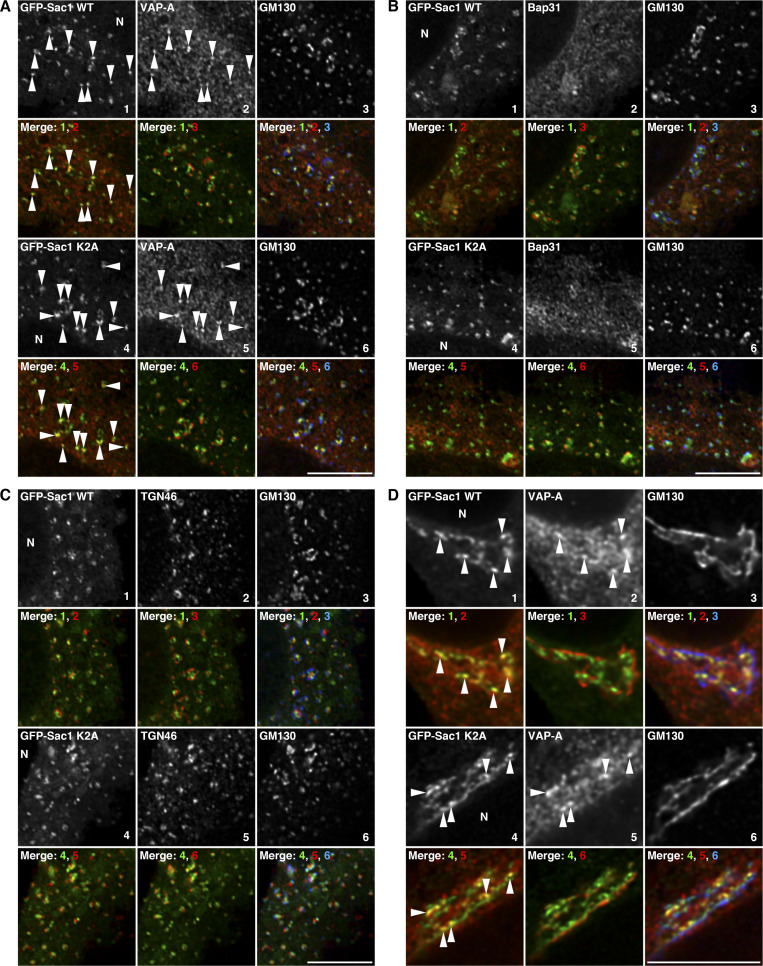
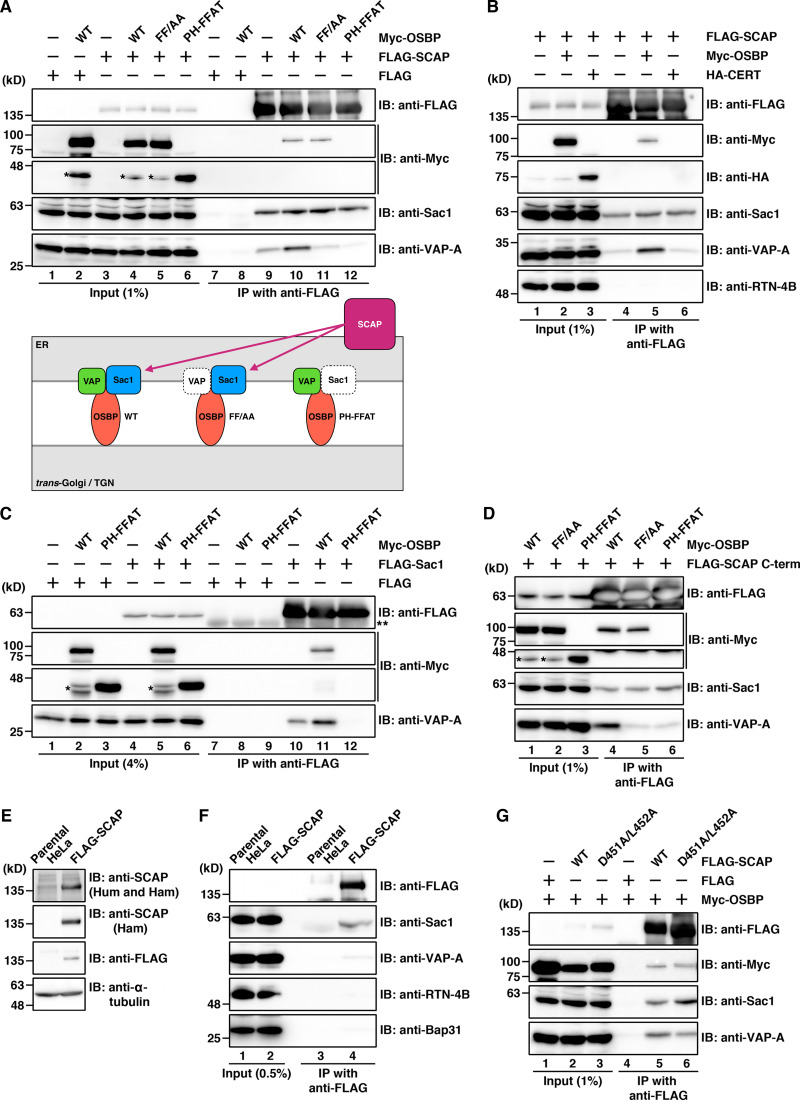
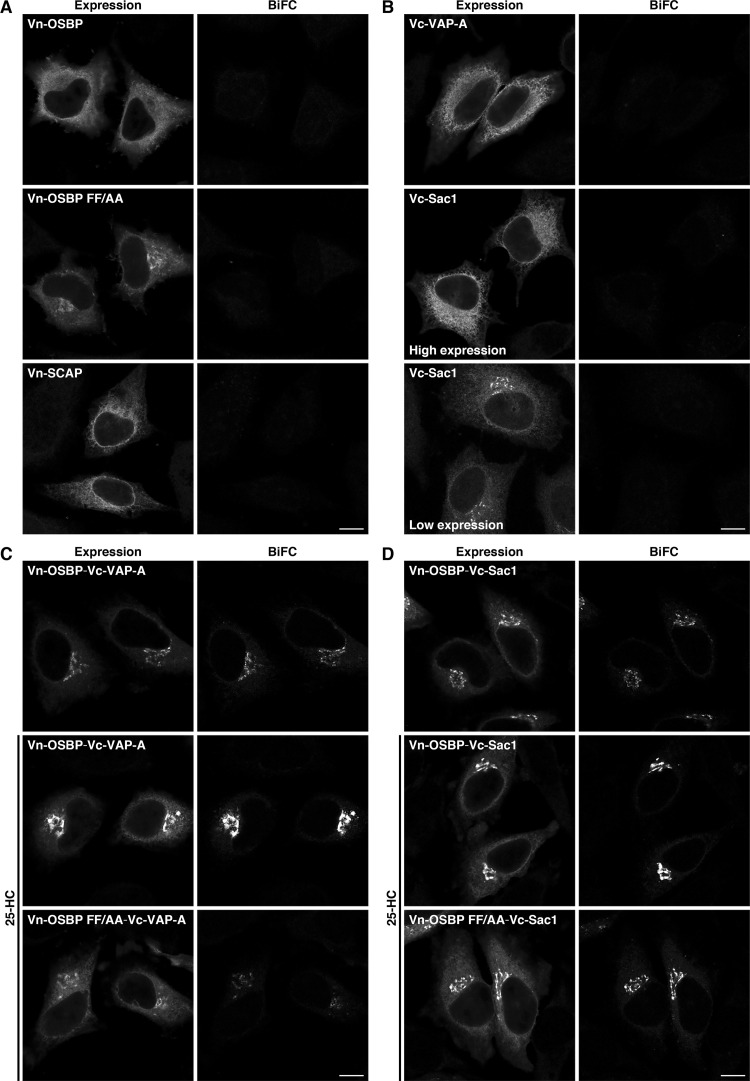
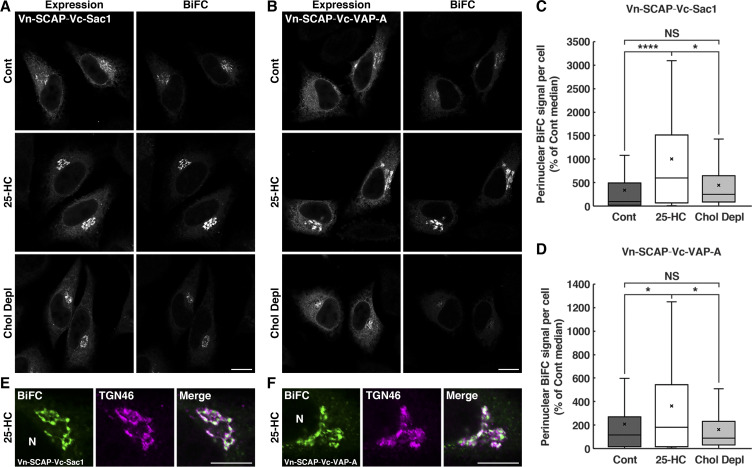
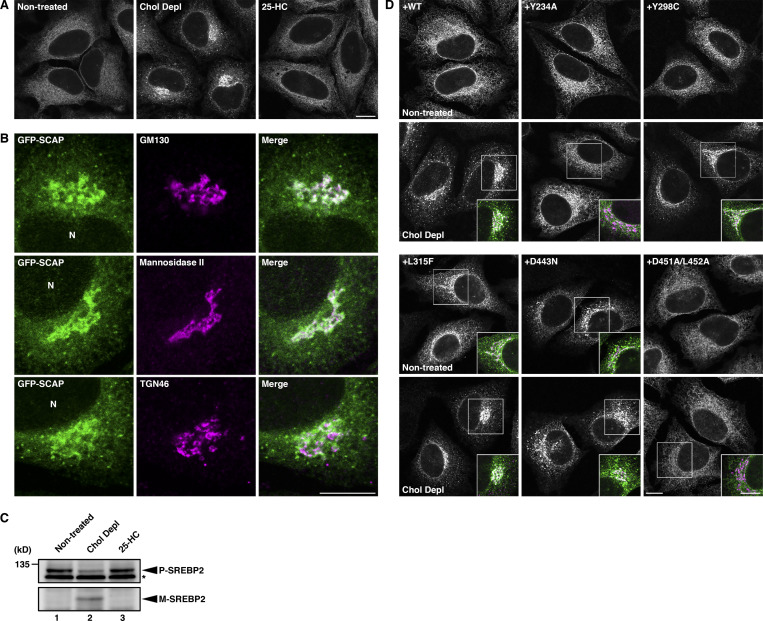
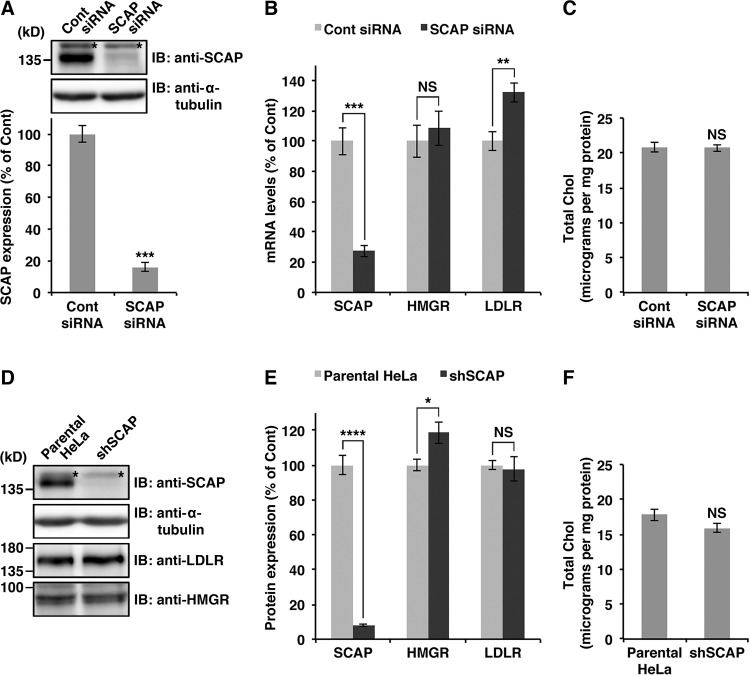
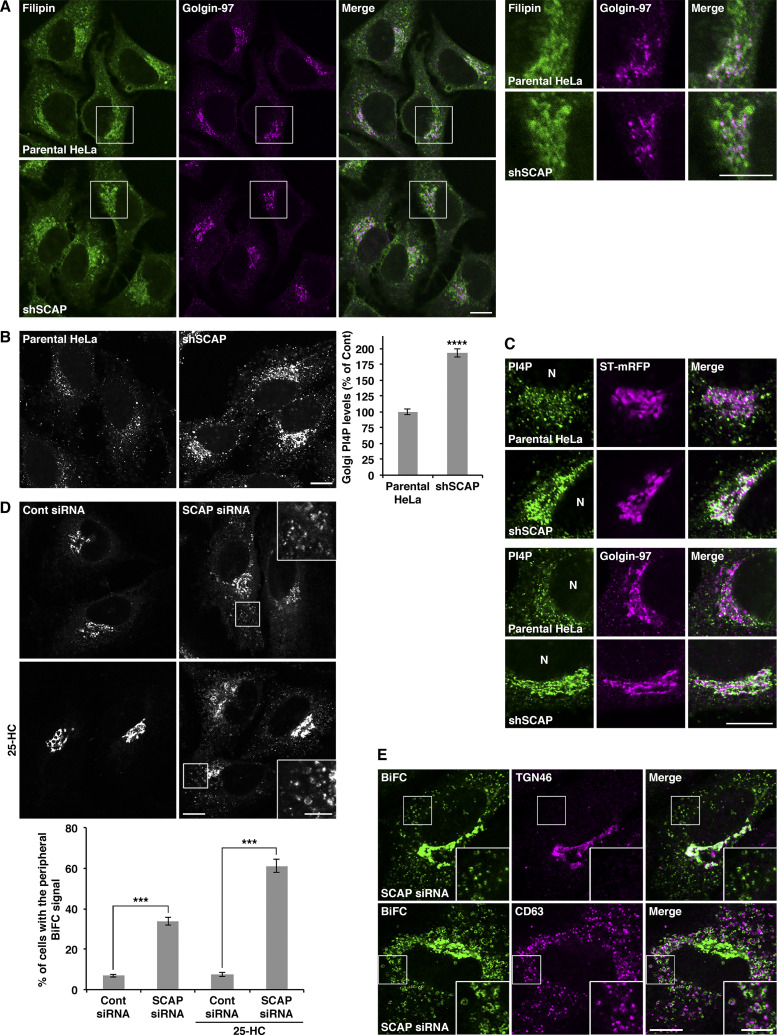
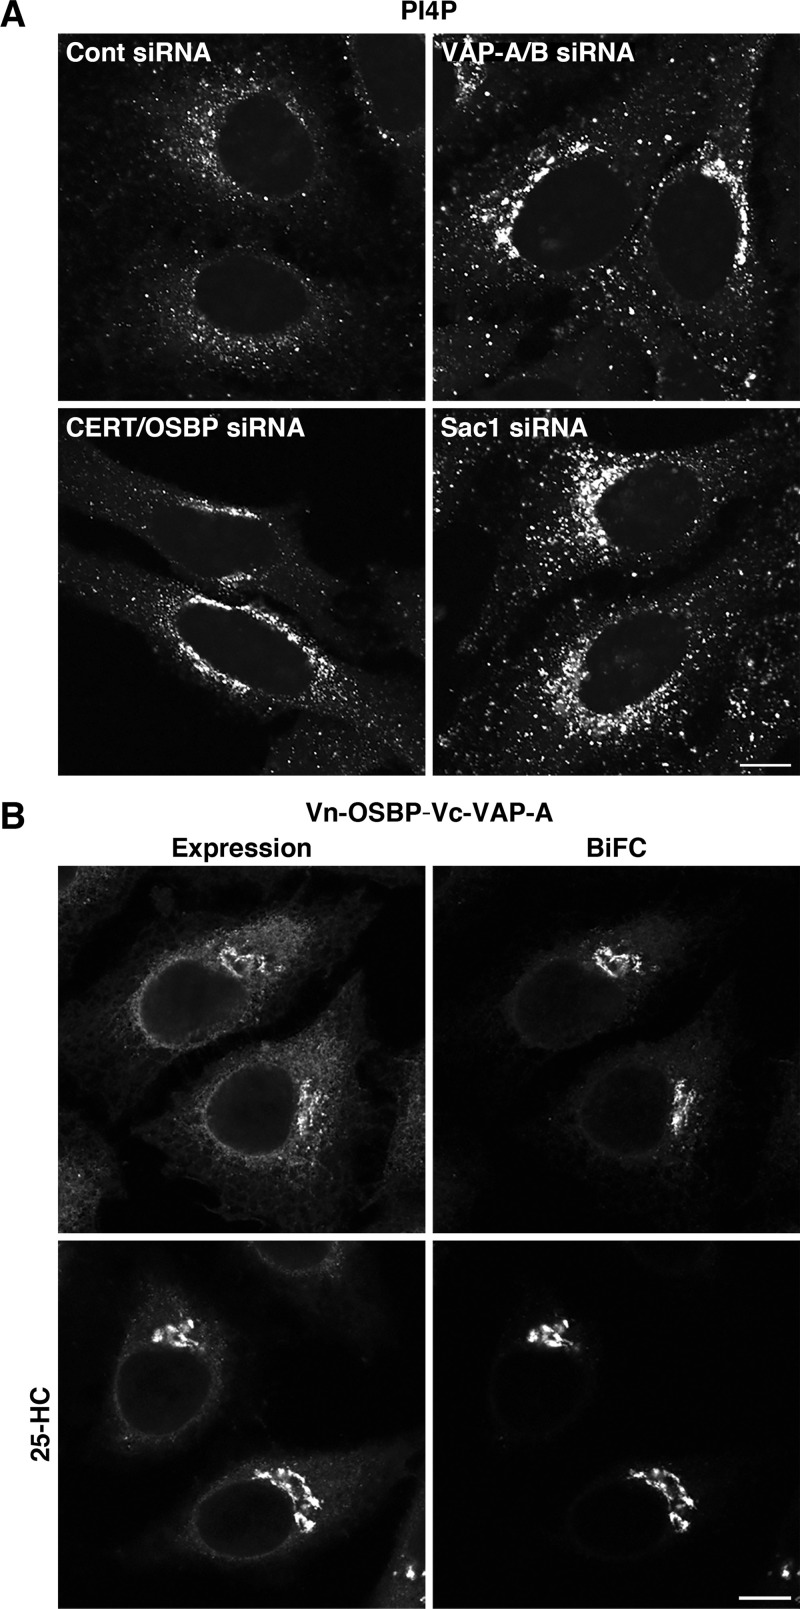
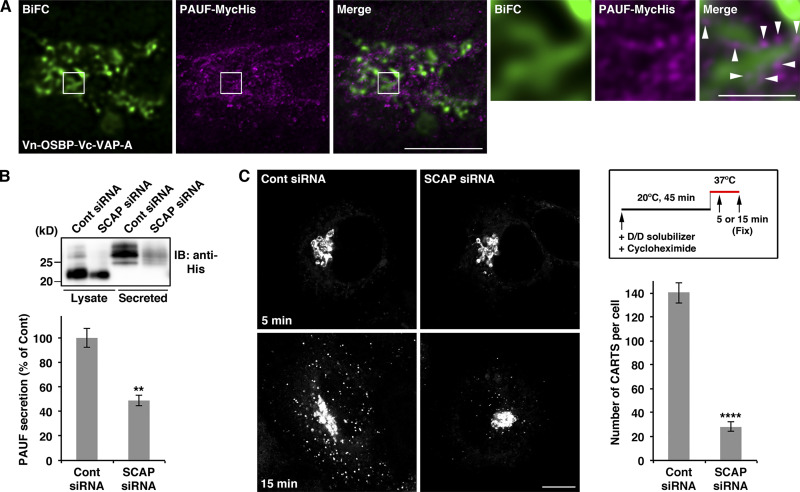
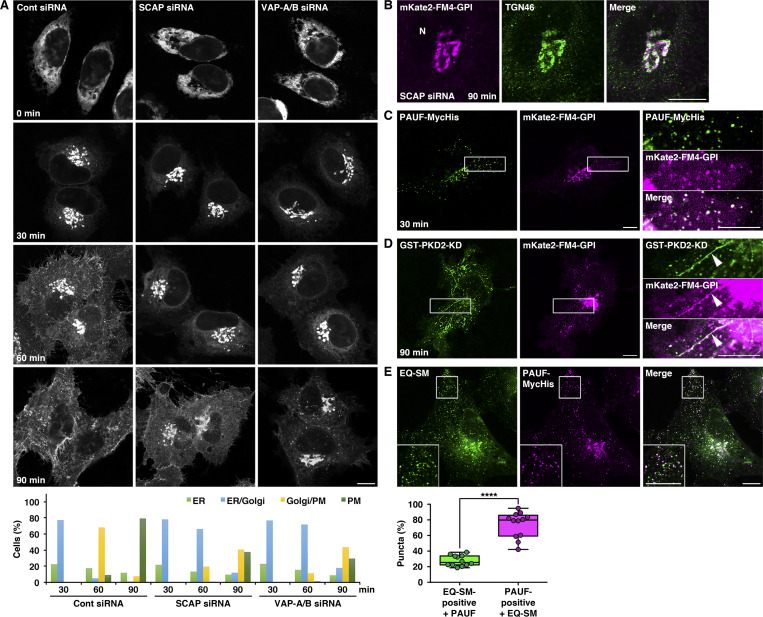
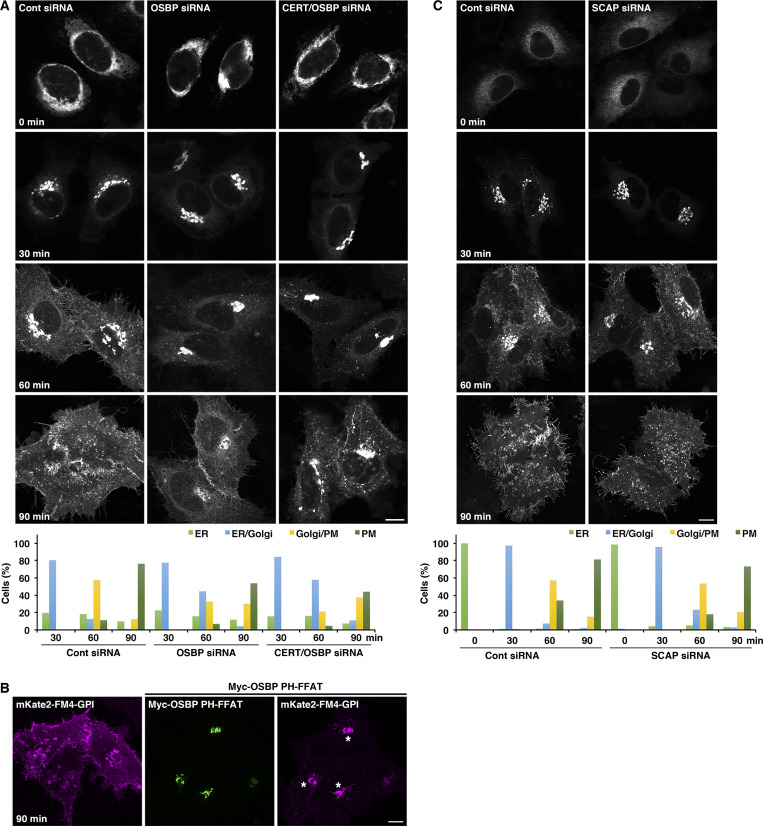
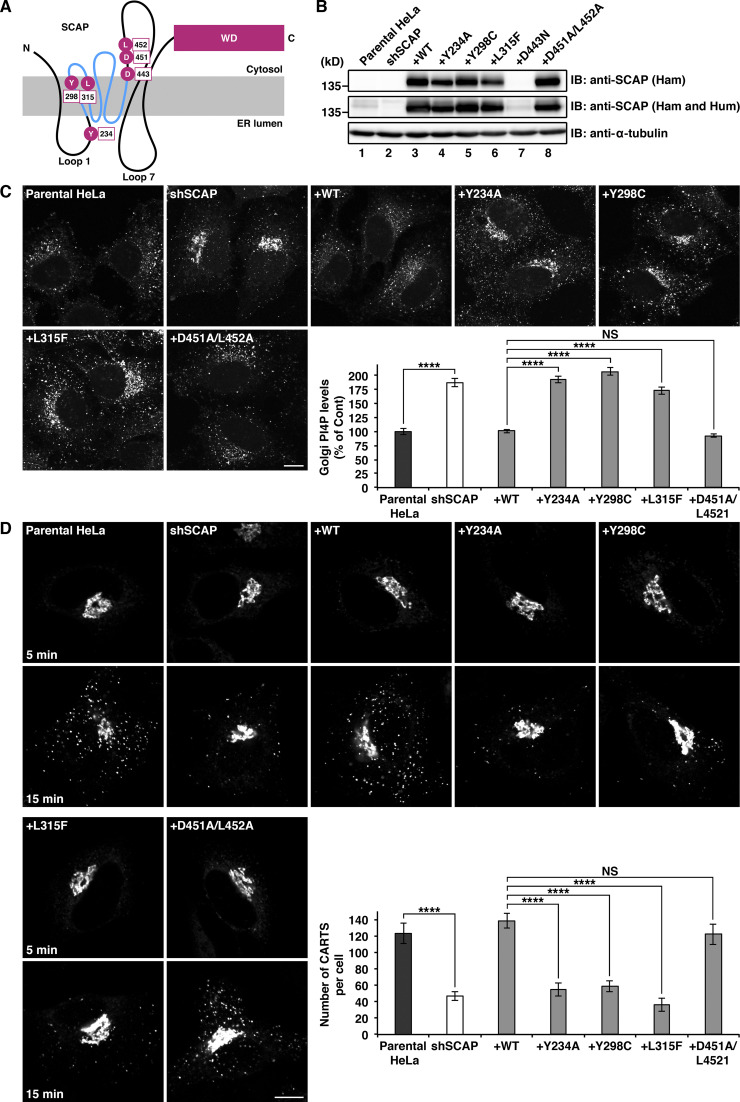
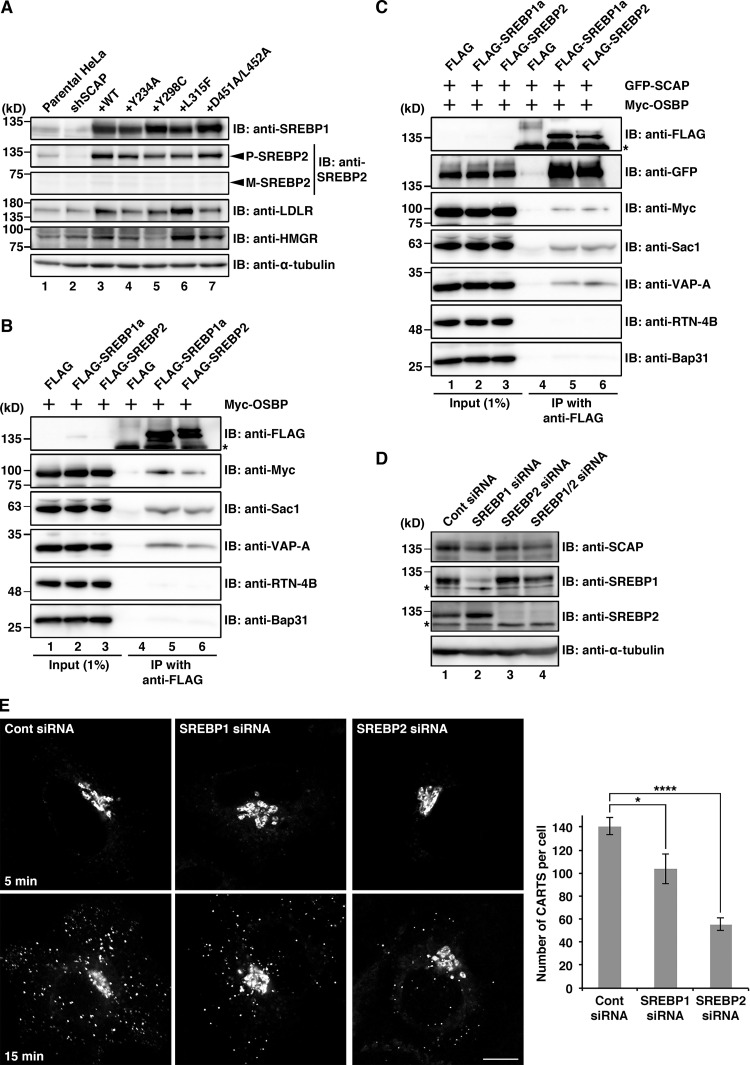
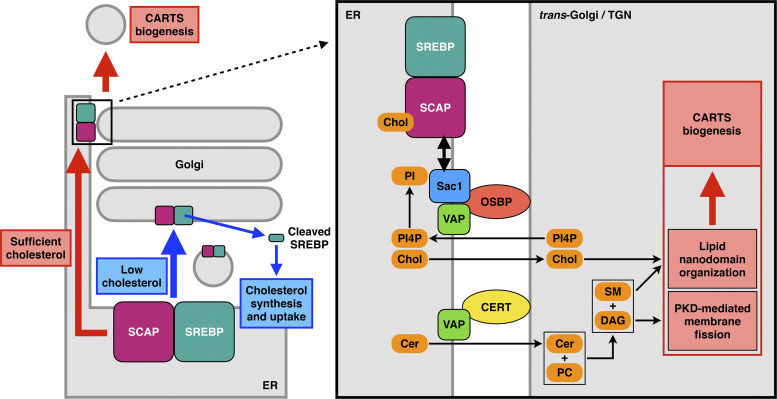
In response to cholesterol deprivation, SCAP escorts SREBP transcription factors from the endoplasmic reticulum to the Golgi complex for their proteolytic activation, leading to gene expression for cholesterol synthesis and uptake. Here, we show that in cholesterol-fed cells, ER-localized SCAP interacts through Sac1 phosphatidylinositol 4-phosphate (PI4P) phosphatase with a VAP-OSBP complex, which mediates counter-transport of ER cholesterol and Golgi PI4P at ER-Golgi membrane contact sites (MCSs). SCAP knockdown inhibited the turnover of PI4P, perhaps due to a cholesterol transport defect, and altered the subcellular distribution of the VAP-OSBP complex. As in the case of perturbation of lipid transfer complexes at ER-Golgi MCSs, SCAP knockdown inhibited the biogenesis of the trans-Golgi network-derived transport carriers CARTS, which was reversed by expression of wild-type SCAP or a Golgi transport-defective mutant, but not of cholesterol sensing-defective mutants. Altogether, our findings reveal a new role for SCAP under cholesterol-fed conditions in the facilitation of CARTS biogenesis via ER-Golgi MCSs, depending on the ER cholesterol.


Figures

Figure 1.
Figure 1.
Identification of SCAP as a novel component of Sac1-positive ER–Golgi MCSs. (A) Juxtanuclear localization of the GFP-Sac1 WT and K2A mutant in HeLa cells. (B) Colocalization of GFP-Sac1 WT or K2A with VAP-A and their proximity to TGN46. HeLa cells expressing GFP-Sac1 WT or K2A were treated with 2 µg/ml 25-HC for 1 h. Images were subjected to deconvolution processing as described in Materials and methods. The graphs on the right show the fluorescence intensity of GFP-Sac1 WT or K2A (green), and VAP-A or TGN46 (magenta) along the respective white lines shown in the merged images. N, nucleus. (C) iFRAP in HeLa cells expressing GFP-Sac1 WT, K2A, or NA-GFP. The areas delimited by a red line were bleached as described in Materials and methods. The graph shows quantification of the fluorescence intensity of the indicated proteins in the nonbleached, juxtanuclear region. Data are means ± SEM (n = 4 cells per condition; ****, P < 0.0001; one-way ANOVA multiple comparison test). (D) Silver staining of immunoprecipitated proteins with FLAG-Sac1 WT, FLAG-Sac1 K2A, or FLAG in HEK 293T cells. The arrow indicates FLAG-Sac1. Asterisks denote protein bands containing COPI components. SCAP was identified in the protein band boxed with a red line. (E) Peptides of VAP-A, VAP-B, OSBP, and SCAP, which were identified by MS analysis of FLAG-Sac1 K2A immunoprecipitates (lane 2 in D). (F) Interaction of endogenous Sac1 with SCAP, but not with calnexin or RTN-4B. HEK 293T cell lysate was incubated with Dynabeads Protein G coupled with control (Cont) IgG or an anti-Sac1 antibody, and the cell lysate (Input) and immunoprecipitates (IPs) were immunoblotted (IB) with the indicated antibodies. Asterisk denotes nonspecific bands. Scale bars, 10 µm. AU, arbitrary units.
Figure S1.
Figure S1.
Colocalization of Sac1 WT or K2A with VAP-A, but not with Bap31, and their proximity to TGN46 or GM130. (A–D) HeLa cells expressing GFP-Sac1 WT or K2A were treated with 2 µg/ml 25-HC for 1 h with (A–C) or without (D) subsequent treatment with 5 µg/ml nocodazole for 2 h. The cells were fixed and visualized with GFP and antibodies against GM130 and VAP-A (A and D), Bap31 (B), or TGN46 (C). Images were subjected to deconvolution processing as described in Materials and methods. Merged images are shown in the second and fourth rows (second row, left panel: panels 1 and 2 [colored in green and red, respectively]; middle panel: panels 1 and 3 [colored in green and red, respectively]; right panel: panels 1, 2, and 3 [colored in green, red, and blue, respectively]; fourth row, left panel: panels 4 and 5 [colored in green and red, respectively]; middle panel: panels 4 and 6 [colored in green and red, respectively]; right panel: panels 4, 5, and 6 [colored in green, red, and blue, respectively]). Arrowheads indicate the small punctate elements containing both GFP-Sac1 and VAP-A. Scale bars, 10 µm. N, nucleus.
Figure 2.
Figure 2.
ER-localized SCAP interacts through Sac1 with the VAP-AOSBP complex. (A) Interactions of FLAG-SCAP with Myc-OSBP, Sac1, and VAP-A in HEK 293T cells. Bottom panel shows a schematic representation of the SCAP interactions with VAP, OSBP, and Sac1. (B) Interactions of FLAG-SCAP with Myc-OSBP, Sac1, and VAP-A, but not with HA-CERT or RTN-4B. (C) Interactions of FLAG-Sac1 with VAP-A and Myc-OSBP WT, but not with the PH-FFAT mutant. (D) Interactions of FLAG-SCAP C-term with Myc-OSBP, Sac1, and VAP-A. (E) Establishment of a HeLa stable cell line expressing FLAG-SCAP. Ham, hamster; Hum, human. (F) Interaction of stably expressed FLAG-SCAP with Sac1, but not with RTN-4B or Bap31. VAP-A was detected as a very faint band in the immunoprecipitate (IP) of the stable cell line (lane 4). (G) Interactions of the FLAG-SCAP D451A/L452A mutant with Myc-OSBP, Sac1, and VAP-A. Single and double asterisks denote degraded Myc-OSBP fragments and the Ig heavy chain, respectively. IB, immunoblotted.
Figure S2.
Figure S2.
BiFC visualization of VAP-A, OSBP, and Sac1 interactions at ER–Golgi MCSs. (A and B) No BiFC signal in HeLa cells with single expression of Vn-fused proteins (A) or Vc-fused proteins (B). (C and D) BiFC visualization of OSBP–VAP-A (C) and OSBP–Sac1 (D) interactions at ER–Golgi MCSs. The coexpression of Vn-OSBP WT or FF/AA with Vc-VAP-A (C) or Vc-Sac1 (D) was visualized with an anti-GFP antibody. The BiFC signal was enhanced by treatment of cells with 2 µg/ml 25-HC for 2.5 h. Vn-OSBP FF/AA showed a reduced BiFC signal compared with WT. Scale bars, 10 µm.
Figure 3.
Figure 3.
BiFC visualization of SCAP, VAP-A, and Sac1 interactions at ER–Golgi MCSs. (A–F) BiFC visualization of the SCAP–Sac1 or SCAP–VAP-A interaction at ER–Golgi MCSs in HeLa cells coexpressing Myc-OSBP and Vn-fused SCAP in combination with Vc-fused Sac1 (A, C, and E) or VAP-A (B, D, and F). The cells were incubated without (Control [Cont]) or with 2 µg/ml 25-HC for 2.5 h or were cholesterol depleted (Chol Depl) for 3 h. The expression of Vn-SCAP together with Vc-Sac1 (A) or Vc-VAP-A (B) was visualized with an anti-GFP antibody. (C and D) Quantification of perinuclear BiFC signal. Boxes delimit the first and third quartiles and the central line is the median, whereas the cross represents the mean value. The whiskers represent the minimum and maximum values after outlier removal (n = 70–101 cells per condition; *, P < 0.05; ****, P < 0.0001; Kruskal-Wallis multiple sample nonparametric test). N, nucleus. Scale bars, 10 µm.
Figure S3.
Figure S3.
Sterol-dependent localization of SCAP. (A and B) Localization of stably expressed GFP-SCAP in HeLa cells with or without cholesterol depletion (Chol Depl) for 3 h or treated with 2 µg/ml 25-HC for 2.5 h. (B) Accumulation of GFP-SCAP in GM130 (cis-Golgi matrix protein)– and mannosidase II (cis/medial-Golgi marker enzyme)–positive membranes upon cholesterol depletion. N, nucleus. (C) Proteolytic activation of SREBP2 upon cholesterol depletion. Lysates of HeLa cells with or without cholesterol depletion for 3 h or treated with 2 µg/ml 25-HC for 3 h were analyzed by Western blotting with an anti-SREBP2 antibody. Arrowheads indicate the precursor (P) and mature (M) forms of SREBP2. Asterisk denotes nonspecific bands. (D) Localization of the stably expressed hamster SCAP WT and mutants in shSCAP HeLa cells with or without cholesterol depletion for 3 h. Merged images for the hamster SCAP WT or mutants (green) and the cis/medial-Golgi marker GPP130 (magenta) of the boxed areas are shown in the insets. Scale bars, 10 µm.
Figure 4.
Figure 4.
SCAP knockdown does not disrupt cholesterol metabolism under cholesterol-fed conditions. (A) siRNA-mediated knockdown of SCAP in HeLa cells. The graph shows determination of the expression levels of SCAP at 72 h after siRNA transfection. Data are means ± SEM (n = 3 independent experiments; ***, P < 0.001; unpaired two-tailed Student’s t test). (B) Determination of mRNA levels of the indicated genes in control (Cont) and SCAP knockdown cells by quantitative real-time PCR. Data are means ± SEM (n = 4 independent experiments; **, P < 0.01; ***, P < 0.005; unpaired two-tailed Student’s t test). (C) Total cholesterol (Chol) levels in control and SCAP knockdown cells. Data are means ± SEM (n = 6 independent experiments; unpaired two-tailed Student’s t test). (D and E) shRNA-mediated knockdown of SCAP in HeLa cells. (E) Expression levels of SCAP, HMGR, and LDLR in parental HeLa (control) and shSCAP HeLa cells. Data are means ± SEM (n = 4 independent experiments; *, P < 0.05; ****, P < 0.001; unpaired two-tailed Student’s t test). (F) Total cholesterol levels in parental HeLa and shSCAP HeLa cells. Data are means ± SEM (n = 3 independent experiments; unpaired two-tailed Student’s t test). Asterisks on the Western blots denote nonspecific bands. IB, immunoblotted.
Figure 5.
Figure 5.
SCAP is important for PI4P turnover and VAP-A–OSBP complex distribution at ER–Golgi MCSs. (A) Filipin staining in parental HeLa and shSCAP HeLa cells. High magnifications of the boxed areas are shown in the right panels. (B and C) PI4P staining in parental HeLa and shSCAP HeLa cells with (top two rows in C) or without (B and bottom two rows in C) sialyltransferase (ST)–mRFP expression. The graph shows determination of the Golgi PI4P levels in parental HeLa (control) and shSCAP HeLa cells. Data are means ± SEM (n = 139 cells per condition; ****, P < 0.0001; unpaired two-tailed Student’s t test). N, nucleus. (D) BiFC visualization of the OSBP–VAP-A interaction in control (Cont) and SCAP knockdown cells. HeLa cells stably coexpressing Vn-OSBP and Vc-VAP-A were transfected with siRNA. After 72 h, the cells were treated with or without 2 µg/ml 25-HC for 2.5 h. High magnifications of the boxed areas are shown in the insets where brightness/contrast enhancement was applied. The graph shows the percentage of cells with the peripheral BiFC signal of Vn-OSBP–Vc-VAP-A. Data are means ± SEM (n = 3 independent experiments; 100–131 cells per condition; ***, P < 0.005; unpaired two-tailed Student’s t test). (E) Close apposition of CD63- but not of TGN46-positive membranes to the peripheral BiFC signal of Vn-OSBP–Vc-VAP-A in SCAP knockdown cells treated with 2 µg/ml 25-HC for 2.5 h. High magnifications of the boxed areas are shown in the insets. Scale bars, 10 µm (large panels), 5 µm (insets).
Figure S4.
Figure S4.
Effects of knockdown of ER–Golgi MCS components on PI4P turnover and BiFC visualization of the VAP-A–OSBP complex. (A) PI4P staining in control (Cont), VAP-A/B, CERT/OSBP, and Sac1 knockdown HeLa cells. (B) HeLa cells stably coexpressing Vn-OSBP and Vc-VAP-A were treated with or without 2 µg/ml 25-HC for 2.5 h. The coexpression of Vn-OSBP and Vc-VAP-A was visualized with an anti-GFP antibody. Scale bars, 10 µm.
Figure 6.
Figure 6.
SCAP is required for the biogenesis of CARTS at the TGN. (A) Close proximity of CARTS formation sites (PAUF-MycHis channel, imaged by STED) to VAP-A–OSBP–mediated ER–Golgi MCSs (BiFC channel, imaged by confocal microscopy). Images were acquired and deconvolved as described in Materials and methods. High magnifications of the boxed areas are shown in the right panels. Arrowheads indicate putative nascent CARTS located in the close vicinity of the BiFC signal of Vn-OSBP–Vc-VAP-A. Scale bars, 5 µm (left panels), 1 µm (right panels). (B) PAUF-MycHis secretion in control (Cont) and SCAP knockdown cells. The graph shows quantification of secreted PAUF-MycHis relative to the total cellular level and normalized as the values in control cells. Data are means ± SEM (n = 3 independent experiments; **, P < 0.01; unpaired two-tailed Student’s t test). IB, immunoblotted. (C) Biogenesis of mKate2-FM4-PAUF–containing CARTS in control and SCAP knockdown cells. The graph shows the number of mKate2-FM4-PAUF–containing CARTS in control and SCAP knockdown cells at 15 min after the temperature shift to 37°C. Data are means ± SEM (n = 20–29 cells per condition; ****, P < 0.0001; unpaired two-tailed Student’s t test). Scale bar, 10 µm. See also Video 1.
Figure 7.
Figure 7.
SCAP is required for GPI-anchored protein transport from the TGN to the PM. (A) mKate2-FM4-GPI transport from the ER to the PM via the Golgi complex in control (Cont), SCAP, and VAP-A/B knockdown cells. The graph shows the percentages of cells with mKate2-FM4-GPI at the ER, ER/Golgi, Golgi/PM, or PM at the indicated times. The data shown are for a single representative experiment out of three performed (n = 230–252 cells per condition). (B) mKate2-FM4-GPI has accumulated at the TGN at 90 min after the transport induction in SCAP knockdown cells. N, nucleus. (C) Colocalization of PAUF-MycHis and mKate2-FM4-GPI in CARTS at 30 min after the transport induction. (D) Colocalization of GST-PKD2-KD and mKate2-FM4-GPI in tubules attached to the TGN at 90 min after the transport induction. (C and D) High magnifications of the boxed areas are shown in the right column where brightness/contrast enhancement was applied to the mKate2-FM4-GPI channel. Arrowheads in D indicate a GST-PKD2-KD–induced tubule containing mKate2-FM4-GPI. (E) Colocalization of EQ-SM and PAUF-MycHis. High magnifications of the boxed areas are shown in the insets. The box-and-whisker plots show quantification of EQ-SM–positive puncta containing PAUF-MycHis (green) and PAUF-MycHis–positive puncta containing EQ-SM (magenta). Boxes delimit the first and third quartiles, and the central line is the median. The whiskers represent the minimum and maximum values after outlier removal (EQ-SM positive: n = 4,487 puncta; PAUF positive: n = 1,650 puncta in 12 cells; ****, P < 0.0001; paired two-tailed Student’s t test). Scale bars, 10 µm.
Figure S5.
Figure S5.
Effects of knockdown of OSBP, CERT/OSBP, or SCAP on trafficking of GPI-anchored protein or VSV-G. (A) mKate2-FM4-GPI transport from the ER to the PM via the Golgi complex in control (Cont), OSBP, and CERT/OSBP knockdown cells. The cells were incubated at 37°C with D/D solubilizer and cycloheximide and fixed at the indicated times. The graph shows the percentages of cells with mKate2-FM4-GPI at the ER, ER/Golgi, Golgi/PM, or PM at the indicated times. The data shown are for a single representative experiment out of three performed (n = 229–268 cells per condition). (B) mKate2-FM4-GPI transport in the presence or absence of the Myc-OSBP PH-FFAT mutant. Asterisks denote cells coexpressing mKate2-FM4-GPI and Myc-OSBP PH-FFAT. (C) VSV-G–GFP transport from the ER to the PM via the Golgi complex in control and SCAP knockdown cells. The cells were incubated at 32°C with cycloheximide and fixed at the indicated times. The graph shows the percentages of cells with VSV-G–GFP at the ER, ER/Golgi, Golgi/PM, or PM at the indicated times. The data shown are for a single representative experiment out of three performed (n = 203–224 cells per condition). Scale bars, 10 µm.
Figure 8.
Figure 8.
SCAP regulates CARTS biogenesis in a cholesterol-dependent manner. (A) Schematic representation of the SCAP topology. SSD is highlighted in light blue. N, N-terminus; C, C-terminus. (B) Establishment of shSCAP HeLa cells stably expressing the hamster SCAP WT and mutants. IB, immunoblotted. (C) Recovery of PI4P turnover on expression of hamster SCAP WT or D451A/L452A, but not of Y234A, Y298C, or L315F. The graph shows determination of the Golgi PI4P levels in the indicated cells. Data are means ± SEM (n = 69–96 cells per condition; ****, P < 0.0001; one-way ANOVA multiple comparison test). (D) Recovery of the biogenesis of mKate2-FM4-PAUF–containing CARTS on expression of hamster SCAP WT or D451A/L452A, but not of Y234A, Y298C, or L315F. The graph shows the number of mKate2-FM4-PAUF–containing CARTS in the indicated cells at 15 min after the temperature shift to 37°C. Data are means ± SEM (n = 20 cells per condition; ****, P < 0.0001; one-way ANOVA multiple comparison test). Scale bars, 10 µm.
Figure 9.
Figure 9.
The SCAP–SREBP complex functions in CARTS biogenesis. (A) Effects of SCAP knockdown and expression of the hamster SCAP WT or mutants on the expression levels of SREBP1 and SREBP2. The precursor (P), but not the mature (M), form of SREBP2 was detected in parental HeLa cells and shSCAP HeLa cells stably expressing the hamster SCAP WT or mutants. Expression levels of LDLR and HMGR were significantly increased by expression of the L315F mutant. (B) Interactions of FLAG-SREBP1a and FLAG-SREBP2 with Myc-OSBP, Sac1, and VAP-A, but not with RTN-4B or Bap31, in HEK 293T cells. (C) Interactions of FLAG-SREBP1a and FLAG-SREBP2 with GFP-SCAP, Myc-OSBP, Sac1, and VAP-A, but not with RTN-4B or Bap31. (D) siRNA-mediated knockdown of SREBP1 and/or SREBP2 in HeLa cells. Asterisks in B–D denote nonspecific bands. (E) Biogenesis of mKate2-FM4-PAUF–containing CARTS in control (Cont), SREBP1, and SREBP2 knockdown cells. The graph shows the number of mKate2-FM4-PAUF–containing CARTS in the indicated cells at 15 min after the temperature shift to 37°C. Data are means ± SEM (n = 11 cells per condition; * P, < 0.05; ****, P < 0.0001; one-way ANOVA multiple comparison test). Scale bar, 10 µm. IB, immunoblotted; IP immunoprecipitate.
Figure 10.
Figure 10.
Working model for the facilitation of CARTS biogenesis by the SCAP–SREBP complex at ER–Golgi MCSs. Low cholesterol (Chol) levels: SCAP escorts SREBP transcription factors from the ER to the Golgi complex for cholesterol synthesis and uptake (left panel, blue arrows). Sufficient cholesterol levels: a complex of cholesterol-bound SCAP and SREBP interacts with the VAP–OSBP complex via Sac1 and functions in the counter-transport of ER cholesterol and Golgi PI4P at ER–Golgi MCSs to promote CARTS biogenesis at the TGN domains immediately adjacent to the ER MSCs (left panel, red arrows, and right panel). PC, phosphatidylcholine.

Similar articles

Cited by

References

    1. Adams C.M., Goldstein J.L., and Brown M.S.. 2003. Cholesterol-induced conformational change in SCAP enhanced by Insig proteins and mimicked by cationic amphiphiles. Proc. Natl. Acad. Sci. USA. 100:10647–10652. 10.1073/pnas.1534833100 - DOI - PMC - PubMed
    1. Adams C.M., Reitz J., De Brabander J.K., Feramisco J.D., Li L., Brown M.S., and Goldstein J.L.. 2004. Cholesterol and 25-hydroxycholesterol inhibit activation of SREBPs by different mechanisms, both involving SCAP and Insigs. J. Biol. Chem. 279:52772–52780. 10.1074/jbc.M410302200 - DOI - PubMed
    1. Antonny B., Bigay J., and Mesmin B.. 2018. The Oxysterol-Binding Protein Cycle: Burning Off PI(4)P to Transport Cholesterol. Annu. Rev. Biochem. 87:809–837. 10.1146/annurev-biochem-061516-044924 - DOI - PubMed
    1. Baron C.L., and Malhotra V.. 2002. Role of diacylglycerol in PKD recruitment to the TGN and protein transport to the plasma membrane. Science. 295:325–328. 10.1126/science.1066759 - DOI - PubMed
    1. Blagoveshchenskaya A., Cheong F.Y., Rohde H.M., Glover G., Knödler A., Nicolson T., Boehmelt G., and Mayinger P.. 2008. Integration of Golgi trafficking and growth factor signaling by the lipid phosphatase SAC1. J. Cell Biol. 180:803–812. 10.1083/jcb.200708109 - DOI - PMC - PubMed

Publication types

MeSH terms

Substances