

Structure and expression analysis of seven salt-related ERF genes of Populus
- PMID: 33150090
- PMCID: PMC7583627
- DOI: 10.7717/peerj.10206
Structure and expression analysis of seven salt-related ERF genes of Populus
Abstract
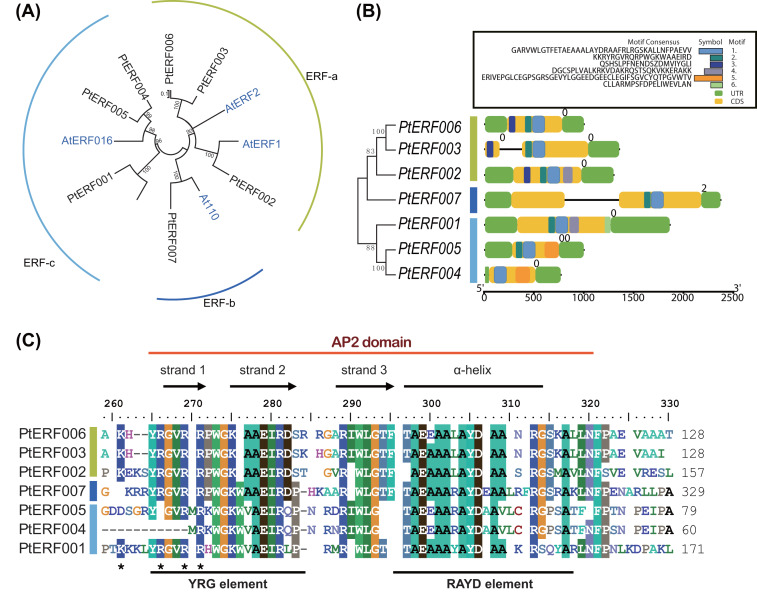
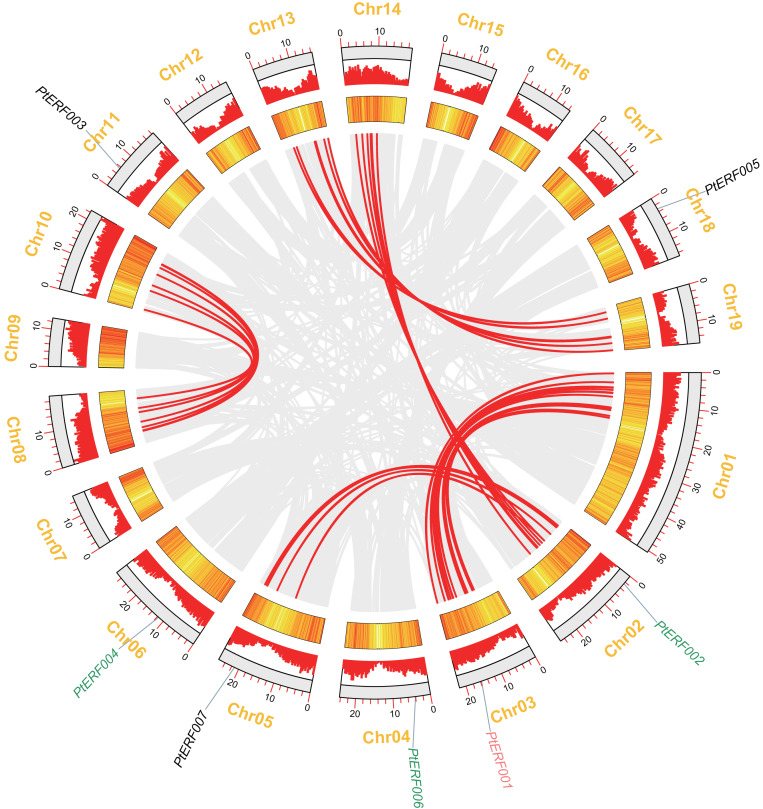
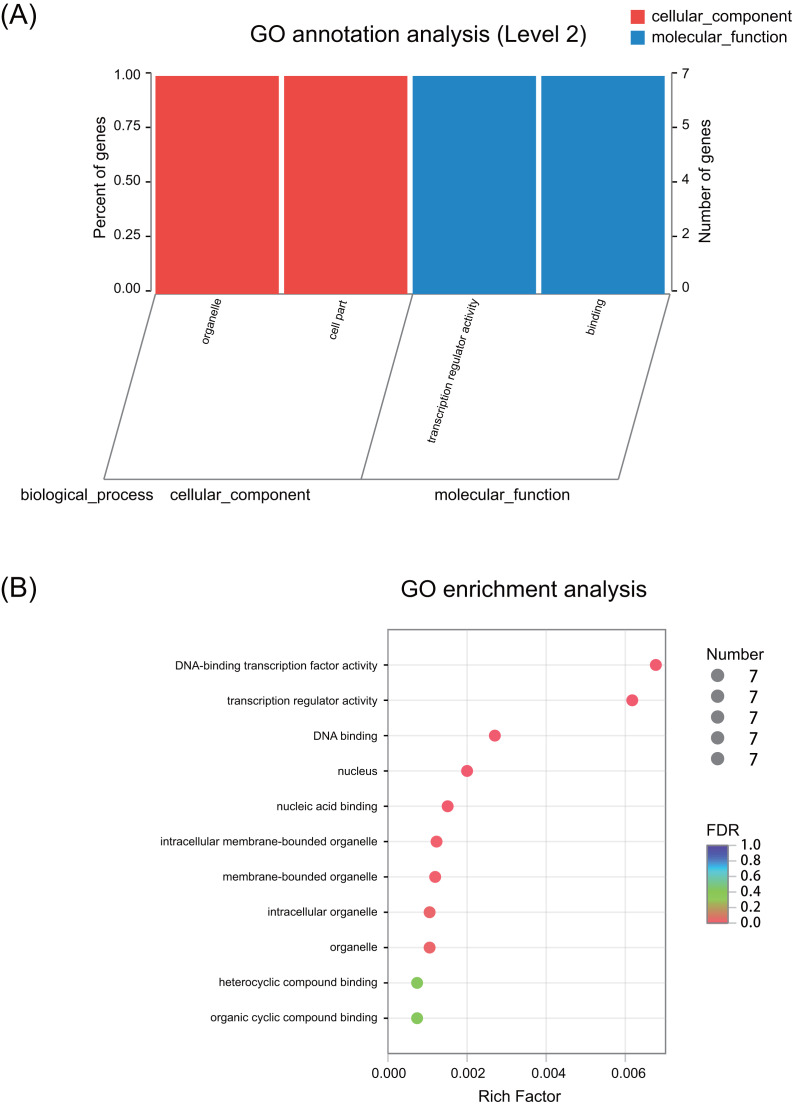
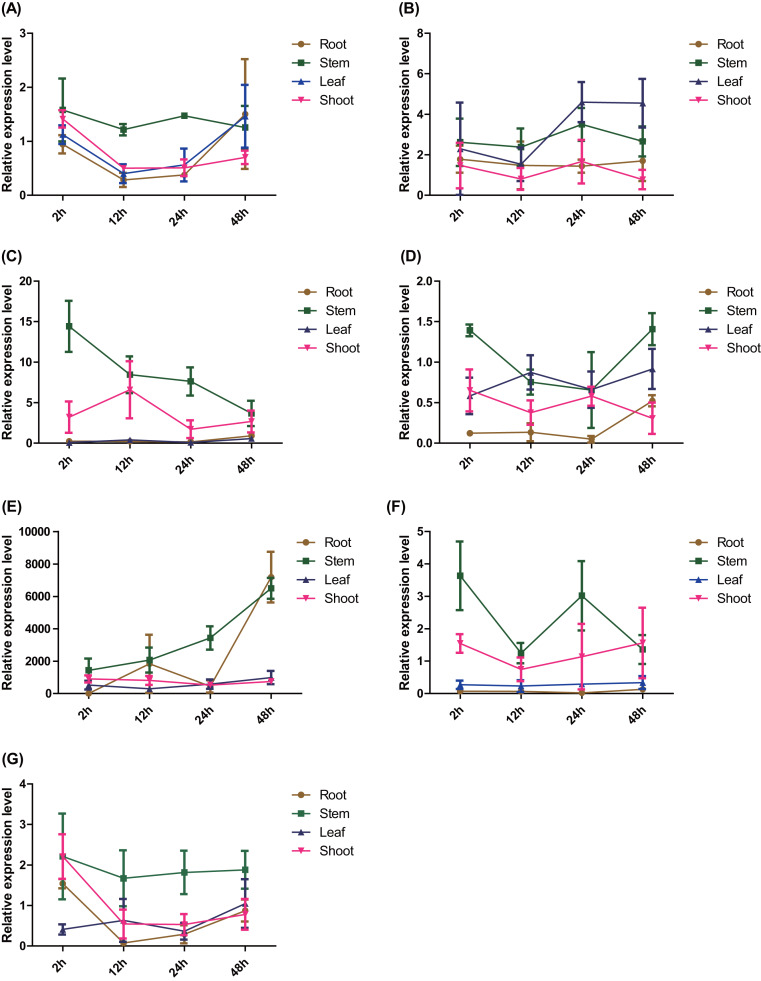
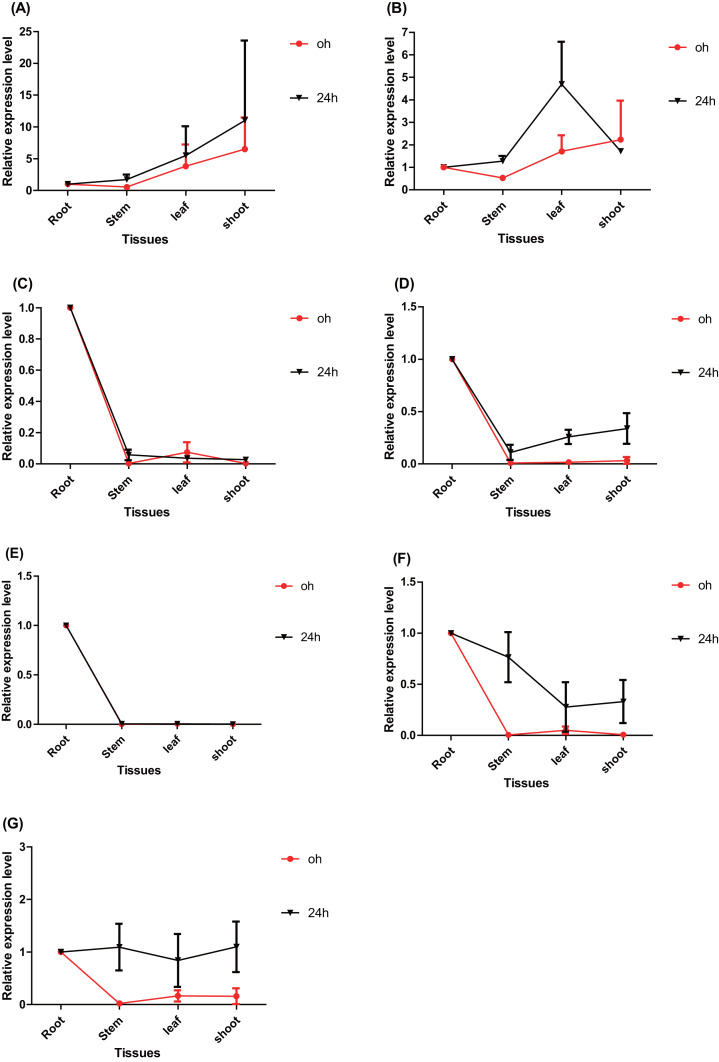
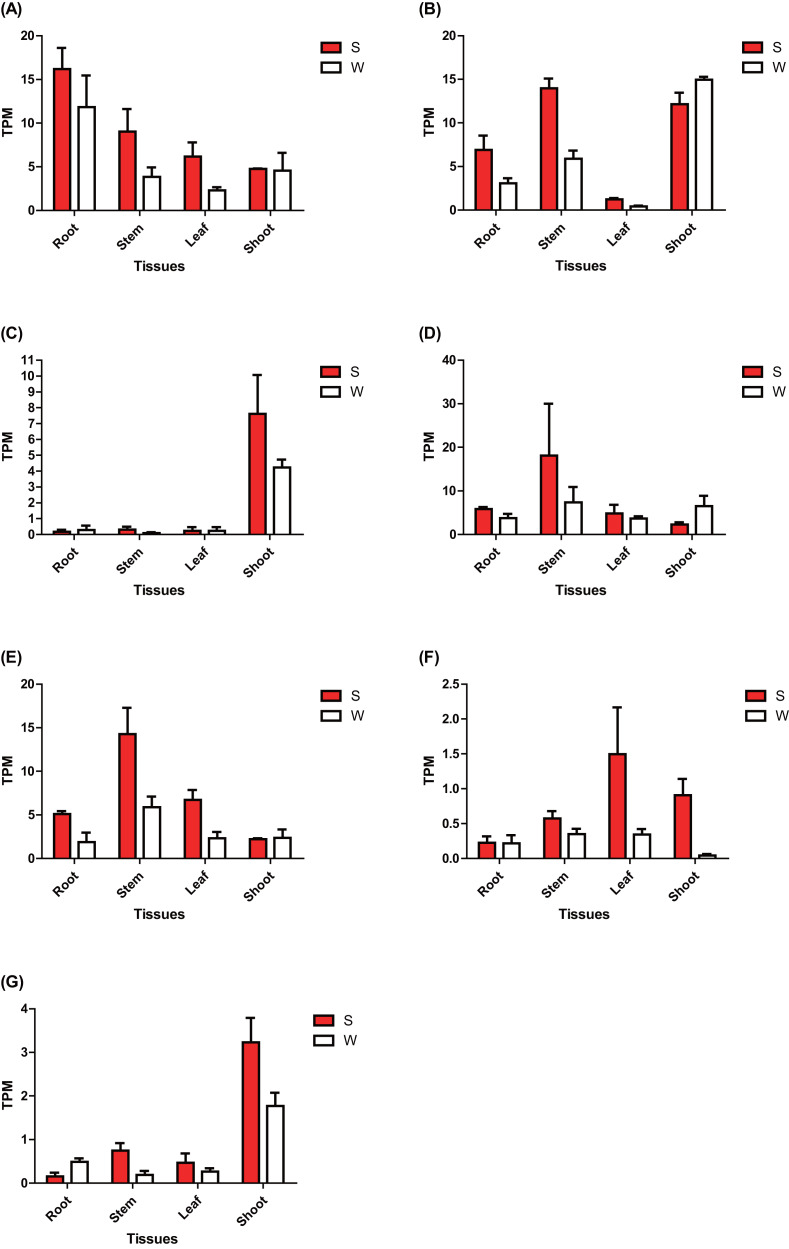
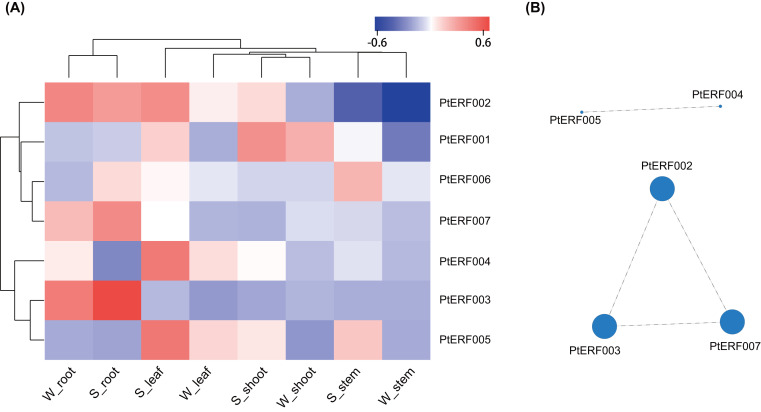
Ethylene response factors (ERFs) are plant-specific transcription factors (TFs) that play important roles in plant growth and stress defense and have received a great amount of attention in recent years. In this study, seven ERF genes related to abiotic stress tolerance and response were identified in plants of the Populus genus. Systematic bioinformatics, including sequence phylogeny, genome organisation, gene structure, gene ontology (GO) annotation, etc. were detected. Expression-pattern of these seven ERF genes were analyzed using RT-qPCR and cross validated using RNA-Seq. Data from a phylogenetic tree and multiple alignment of protein sequences indicated that these seven ERF TFs belong to three subfamilies and contain AP2, YRG, and RAYD conserved domains, which may interact with downstream target genes to regulate the plant stress response. An analysis of the structure and promoter region of these seven ERF genes showed that they have multiple stress-related motifs and cis-elements, which may play roles in the plant stress-tolerance process through a transcriptional regulation mechanism; moreover, the cellular_component and molecular_function terms associated with these ERFs determined by GO annotation supported this hypothesis. In addition, the spatio-temporal expression pattern of these seven ERFs, as detected using RT-qPCR and RNA-seq, suggested that they play a critical role in mediating the salt response and tolerance in a dynamic and tissue-specific manner. The results of this study provide a solid basis to explore the functions of the stress-related ERF TFs in Populus abiotic stress tolerance and development process.
Keywords: Gene express; Salt stress; ERF; Populus; Transcription factor.
©2020 Huang et al.
Conflict of interest statement
The authors declare there are no competing interests.
Figures
Similar articles
-
Genome-wide identification, phylogeny and expression analysis of AP2/ERF transcription factors family in Brachypodium distachyon.BMC Genomics. 2016 Aug 15;17(1):636. doi: 10.1186/s12864-016-2968-8. BMC Genomics. 2016. PMID: 27527343 Free PMC article.
-
Identification, Classification, and Functional Analysis of AP2/ERF Family Genes in the Desert Moss Bryum argenteum.Int J Mol Sci. 2018 Nov 19;19(11):3637. doi: 10.3390/ijms19113637. Int J Mol Sci. 2018. PMID: 30463185 Free PMC article.
-
Genome-Wide Identification, Characterization, and Expression Profiling of AP2/ERF Superfamily Genes under Different Development and Abiotic Stress Conditions in Pecan (Carya illinoinensis).Int J Mol Sci. 2022 Mar 8;23(6):2920. doi: 10.3390/ijms23062920. Int J Mol Sci. 2022. PMID: 35328341 Free PMC article.
-
Ethylene Response Factor (ERF) Family Proteins in Abiotic Stresses and CRISPR-Cas9 Genome Editing of ERFs for Multiple Abiotic Stress Tolerance in Crop Plants: A Review.Mol Biotechnol. 2019 Feb;61(2):153-172. doi: 10.1007/s12033-018-0144-x. Mol Biotechnol. 2019. PMID: 30600447 Review.
-
Ethylene responsive factors in the orchestration of stress responses in monocotyledonous plants.Front Plant Sci. 2015 Aug 28;6:640. doi: 10.3389/fpls.2015.00640. eCollection 2015. Front Plant Sci. 2015. PMID: 26379679 Free PMC article. Review.
Cited by
-
Expression analysis of PIN family genes in Chinese hickory reveals their potential roles during grafting and salt stress.Front Plant Sci. 2022 Sep 29;13:999990. doi: 10.3389/fpls.2022.999990. eCollection 2022. Front Plant Sci. 2022. PMID: 36247577 Free PMC article.
-
BnAP2-12 overexpression delays ramie flowering: evidence from AP2/ERF gene expression.Front Plant Sci. 2024 Mar 25;15:1367837. doi: 10.3389/fpls.2024.1367837. eCollection 2024. Front Plant Sci. 2024. PMID: 38590749 Free PMC article.
-
Potassium indole-3-butyric acid affects rice's adaptability to salt stress by regulating carbon metabolism, transcription factor genes expression, and biosynthesis of secondary metabolites.Front Plant Sci. 2024 Sep 3;15:1416936. doi: 10.3389/fpls.2024.1416936. eCollection 2024. Front Plant Sci. 2024. PMID: 39290739 Free PMC article.
-
Transcription Factor ERF194 Modulates the Stress-Related Physiology to Enhance Drought Tolerance of Poplar.Int J Mol Sci. 2023 Jan 2;24(1):788. doi: 10.3390/ijms24010788. Int J Mol Sci. 2023. PMID: 36614232 Free PMC article.
-
PagSOD2a improves poplar salt tolerance by elevating superoxide dismutase activity and decreasing malondialdehyde contents.Front Plant Sci. 2024 Sep 13;15:1456249. doi: 10.3389/fpls.2024.1456249. eCollection 2024. Front Plant Sci. 2024. PMID: 39345981 Free PMC article.
References
-
- Chen C, Chen H, He Y, Xia R. TBtools, a toolkit for biologists integrating various biological data handling tools with a user-friendly interface. BioRxiv. 2018:289660.
-
- Chen W, Provart NJ, Glazebrook J, Katagiri F, Chang H-S, Eulgem T, Mauch F, Luan S, Zou G, Whitham SA. Expression profile matrix of Arabidopsis transcription factor genes suggests their putative functions in response to environmental stresses. The Plant Cell. 2002;14:559–574. doi: 10.1105/tpc.010410. - DOI - PMC - PubMed
Grants and funding
LinkOut - more resources
Full Text Sources
Research Materials
