. 2020 Nov;587(7834):466-471.
doi: 10.1038/s41586-020-2877-5. Epub 2020 Oct 28.

Exuberant fibroblast activity compromises lung function via ADAMTS4

Collaborators, Affiliations

Exuberant fibroblast activity compromises lung function via ADAMTS4

David F Boyd et al. Nature. 2020 Nov.

Erratum in

  • Publisher Correction: Exuberant fibroblast activity compromises lung function via ADAMTS4.
    Boyd DF, Allen EK, Randolph AG, Guo XJ, Weng Y, Sanders CJ, Bajracharya R, Lee NK, Guy CS, Vogel P, Guan W, Li Y, Liu X, Novak T, Newhams MM, Fabrizio TP, Wohlgemuth N, Mourani PM; PALISI Pediatric Intensive Care Influenza (PICFLU) Investigators; Wight TN, Schultz-Cherry S, Cormier SA, Shaw-Saliba K, Pekosz A, Rothman RE, Chen KF, Yang Z, Webby RJ, Zhong N, Crawford JC, Thomas PG. Boyd DF, et al. Nature. 2020 Dec;588(7836):E5. doi: 10.1038/s41586-020-2987-0. Nature. 2020. PMID: 33208953

Abstract

Severe respiratory infections can result in acute respiratory distress syndrome (ARDS)1. There are no effective pharmacological therapies that have been shown to improve outcomes for patients with ARDS. Although the host inflammatory response limits spread of and eventually clears the pathogen, immunopathology is a major contributor to tissue damage and ARDS1,2. Here we demonstrate that respiratory viral infection induces distinct fibroblast activation states, which we term extracellular matrix (ECM)-synthesizing, damage-responsive and interferon-responsive states. We provide evidence that excess activity of damage-responsive lung fibroblasts drives lethal immunopathology during severe influenza virus infection. By producing ECM-remodelling enzymes-in particular the ECM protease ADAMTS4-and inflammatory cytokines, damage-responsive fibroblasts modify the lung microenvironment to promote robust immune cell infiltration at the expense of lung function. In three cohorts of human participants, the levels of ADAMTS4 in the lower respiratory tract were associated with the severity of infection with seasonal or avian influenza virus. A therapeutic agent that targets the ECM protease activity of damage-responsive lung fibroblasts could provide a promising approach to preserving lung function and improving clinical outcomes following severe respiratory infections.


Conflict of interest statement

Competing Interests

PT is a consultant for Cytoagents Inc. A patent has been filed on work related to but not directly based on the findings in this manuscript. The authors declare no other competing interests.

Figures
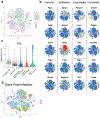
Extended Data Figure 1.
Extended Data Figure 1.. Single-cell gene expression profiling of CD45-lung cells during severe influenza virus infection in mice.
(A) Cell hashing of biological replicates for each time point. t-SNE of CD45-cells from mouse lungs at all time points. Cells from individual mice (n = 5 for time points 0, 1, and 3 dpi, and n = 4 for 6 dpi) were labeled with DNA-tagged antibodies (JCChto 10, 11, 12, 13, and 14) and pooled within time points. Pooled cells for each time point were run on separate 10x Genomics gel bead reactions. Cells are color-coded according to hashtag oligo ID as indicated at the right of the graph. ‘Unknown’ (purple) indicates that an insufficient number of hashtags were sequenced in order to determine the ID. Cells are also symbol-coded according to time point after infection: 0 dpi (circle), 1 dpi (triangle), 3 dpi (square), 6 dpi (cross). (B) Feature plots of signature genes used to identify mouse lung cell populations. The following genes were used to identify general populations of cells: immune cells (Ptprc), epithelial cells (Epcam), endothelial cells (Pecam1, Lyve1, Vwf), and mesenchymal cells (Col1a2). The following genes were used to identify specific cell populations within the main types of cells: T cells (Cd3e), B cells (Cd19), myeloid cells (Fcgr1), neutrophils (Mmp9), type I pneumocytes (Akap5), type II pneumocytes (Sftpc), ciliated epithelial cells (Foxj1), club cells (Scgb1a1), lymphatic endothelial cells (Pecam1, Thy1), fibroblasts (Pdgfra), pericytes and smooth muscle cells (Acta2), mesothelial cells (Msln), and platelets (Pf4). (C) Violin plot of expression of influenza A PR8 transcripts by scGEX in non-immune lung cells. (D) Overlay of days post-infection on t-SNE clustering of murine lung cells.
Extended Data Figure 2..
Extended Data Figure 2... Summary of gene-set enrichment analysis of murine and human fibroblast populations.
(A) Relative expression of the indicated gene sets in individual murine fibroblasts and smooth muscle cells. Gene sets representing ECM structural proteins (EXTRACELLULAR_MATRIX1 and COLLAGEN1) inflammatory cytokine responses (HALLMARK_IL6_STAT3_SIGNALING1, GO_REGULATION_OF_TYPE_I_INTERFERON_MEDIATED_SIGNALING_PATHWAY, HINATA_NFKB_IMMU_INF1), and myogenesis (HALLMARK_TGF_BETA_SIGNALING1, HALLMARK_MYOGENESIS1) are plotted. (B) Pairwise comparison of selected hallmark gene sets between murine inflammatory fibroblast clusters 4 (DRFibs) and 6 (IRFibs). Each bar represents the normalized enrichment score (NES) from GSEA comparing all cells in cluster 4 (n = 892 cells) and cluster 6 (n = 749 cells). (C) t-SNE clustering of human COL1A2 expressing mesenchymal cells from five human lung biopsy samples. Relative expression of the indicated gene sets in individual human fibroblasts and smooth muscle cells. Gene sets representing ECM structural proteins (EXTRACELLULAR_MATRIX1 and COLLAGEN1) inflammatory cytokine responses (HALLMARK_IL6_STAT3_SIGNALING1,HALLMARK_INTERFERON_ALPHA_RESPON SE1, HINATA_NFKB_IMMU_INF1), and myogenesis (HALLMARK_TGF_BETA_SIGNALING1, HALLMARK_MYOGENESIS1) are plotted. (D) Dot plots of key genes related to cytokine/chemokine induction and ECM-production and modification in human lung mesenchymal cells.
Extended Data Figure 3.
Extended Data Figure 3.. Validation of inflammatory fibroblasts transcriptional states by flow cytometry.
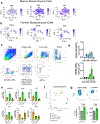
(A, B) Feature plots of Itga5/ITGA5 and Cd9/CD9 in murine and human mesenchymal cells expressing Col1a2/COL1A2 from scGEX data. Legend indicates relative expression within each dataset. (C) Gating strategy for identifying inflammatory fibroblast transcriptional states based on ITGA5 (CD49e) and CD9 staining. (D) Total cell number for IRFibs (blue) and DRFibs (green) in the lungs during IAV infection. (E) Gene expression in sorted ITGA5hiCD9lo, ITGA5lo CD9hi, and bulk CD45-cells as measured by qPCR. Each data point represents an independent biological replicate (CD45-, n = 5; ITGA5hiCD9lo , n = 4, ITGA5lo CD9hi, n = 4). Error bars represent standard error of the mean. (F) Principal component analysis of sorted fibroblast populations and bulk CD45-cells from murine lungs. (G) In vitro stimulation of murine lung fibroblasts with IL-1/TNFα. Representative flow plots of ITGA5 staining before and after stimulation. Charts at bottom indicate % of ITGA5hi fibroblasts (p = 2e-06)) and median fluorescence intensity (MFI) for ITGA5 (p = 0.002). Each data point represents an independent biological replicate (unstim, n = 3; IL1/TNF, n = 3). For statistical analysis, groups were compared using a two-sided students t-test.
Extended Data Figure 4.
Extended Data Figure 4.. Assessment of fibroblast cell surface phenotype in human lung samples.
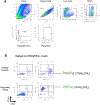
(A) Gating strategy for identifying live, CD45-EPCAM-CD31-PDGFRA+ cells in human lung samples. (B) Each flow plot represents cells gated on live, CD45-EPCAM-CD31-PDGFRA+ from an individual sample as indicated in the gating strategy. Resting fibroblasts (ITGA5loCD9hi) and damage-responsive fibroblasts (ITGA5hiCD9lo) are labeled on representative flow plots.
Extended Data Figure 5.
Extended Data Figure 5.. Regulation of ECM-related gene expression in human and murine respiratory cells following cytokine stimulation.
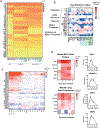
(A) Heatmap representing ΔCt values (normalized to ACTB) in normal human bronchial fibroblasts (NHBFs) and normal human bronchial epithelial cells (NHBEs) stimulated for 24 hours with the indicated cytokines or viruses, and nasal wash cells (NWCs). Green shading highlights stimulation with IL-1 cytokines, while blue shading indicates stimulation with indicated viruses. ECM-related genes are grouped by unsupervised, hierarchical clustering. (B) Heatmap representing log2 fold-change in differentiation normal human bronchial epithelial cells (NHBEs) stimulated with the indicated cytokines/viruses. Values are relative to untreated NHBEs. (C) Heat map representing log2 fold-change in gene expression relative to untreated cells as determined by the ΔΔCt method. Matrix protease genes (y-axis) and treated cell samples (x-axis) were grouped by unsupervised, hierarchical clustering. (D) Assessment of ECM protease and TIMP protein levels in bronchoalveolar lavage fluid collected from mice. Heatmaps of log2 fold-change values relative to mock-infected animals for each of the indicated analytes over the course of IAV infection. Protein levels in the BAL (top panel) are compared to log2 fold-change values relative to mock-infected animals for gene expression as measured by qPCR in whole lung homogenates. The kinetics for individual analytes plotting absolute protein concentrations are presented at the right (0dpi, n = 5 mice; 3dpi, n = 5; 6dpi, n = 5; 9 dpi, n = 5; 12dpi, n = 4; 21dpi, n = 5). Error bars represent standard error of the mean.
Extended Data Figure 6.
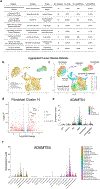
Extended Data Figure 6.. Meta-analysis of publicly available human disease single-cell gene expression datasets.
(A) Table of datasets from eight distinct studies (seven from respiratory disease and one from rheumatoid arthritis), which were aggregated for meta-analysis. Cells expressing at least one transcript of ADAMTS4 were identified. (B, C) Uniform manifold approximation and projection (UMAP) clustering of ADAMTS4+ cells with overlay of study or of unsupervised clustering by cell type. (D) Volcano plot of differentially expressed genes in cluster 14. Differentially expressed genes are based on comparison to all cells in the dataset. Each data point represents a gene and is color-coded according to whether the gene was above a threshold for adjusted p-value (<10−3, blue), log2 fold-change (>|2|, green), adjusted p-value and log2 fold-change (red), or not significant (gray). (E) Expression level of ADAMTS4 in the pulmonary fibrosis dataset from Habermann et al by disease state. (F) Expression level of ADAMTS4 in the Habermann et al dataset by cell type (endothelial, epithelial, immune, mesenchymal) and disease state.
Extended Data Figure 7.
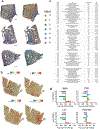
Extended Data Figure 7.. Spatial transcriptomics of lung sections from mice collected 10 days after infection.
(A) H&E staining (left) and unsupervised clustering analysis (right) are presented for four lung sections from four individual mice, representing four biologically independent samples. Similar results were obtained across the four independent samples. ‘Ident’ indicates the identity of each lung region determined by unsupervised clustering of transcriptional profiles. (B) Relative gene expression of key fibroblast-associated genes (Itga5, Lox, Cd9, Timp3) in a representative lung section. (C) Summary of Gene Ontology (GO) analysis of lung regions (clusters) determined by unsupervised clustering. The chart indicates the lung region (‘Cluster’), the GO pathway (‘GO’), fold enrichment of the indicated pathway in the indicated region (‘Fold Enrichment’), and the p-value using false-discovery rate to assess statistical significance (‘FDR’). (D) Average log fold change in expression among all spots pertaining to lung regions (n = 4 independent lung sections from four individual mice). Enrichment determined using two-sided Wilcoxon Rank Sum Test with FDR adjustment. Asterisk (*) indicates that adjusted p-value is <0.00001 (exact p-values in Source Data).
Extended Data Figure 8.
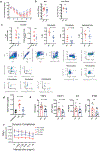
Extended Data Figure 8.. Assessment of IAV infection in ADAMTS-4+/+ and ADAMTS-4−/− mice.
(A) Weight loss curves of ADAMTS-4+/+ and KO mice following lethal IAV challenge with 6000 EID50 PR8. Data points represent mean ± SD (WT, n = 27; KO, n = 16). Data are pooled from 5 independent experiments (B) Viral plaque titers in BAL fluid and lung tissue homogenates at 6 dpi. Each data point represents a biologically independent animal (BAL: WT, n = 12; KO, n = 11; Lung tissue: WT, n = 5; KO, n = 5). Groups were compared using a two-sided Mann-Whitney U test. Error bars represent standard error of the mean (SEM) (C) Cell-type specific infection based on IAV nucleoprotein (NP) positivity as assessed by flow cytometry and gating strategy for identifying populations for cell-type specific infection. Populations were identified using the following markers: Epithelial (CD45-Epcam+), Endothelial (CD45-CD31+), Fibroblasts (CD45-Epcam-CD90+), Monocytes (CD45+CD11c-CD11b+Gr-1lo), Neutrophils (CD45+CD11c-CD11b+Gr-1hi). Each data point represents a biologically independent animal (uninfected, n = 2; WT, n = 7; KO, n = 7). Groups were compared using a two-sided Mann-Whitney U test. Error bars represent SEM. (D) Total protein concentration in BAL fluid as measured by BCA assay at 6 dpi. Each data point represents a biologically independent animal (uninfected, n = 8; WT, n = 7; KO, n = 5). Groups were compared using a two-sided Mann-Whitney U test. Error bars represent SEM. (E) Cytokine concentrations in BAL fluid at 6 dpi as measured by multiplexed cytokine bead arrays (WT, n = 8; ADAMTS-4−/−, n = 8). (F) Measurement of dynamic lung compliance at 10 days after infection following sublethal challenge with IAV (Uninfected: WT, n = 8; KO = 3, Infected: WT n = 8, KO, n = 9). Error bars represent SEM. For statistical analysis, groups were compared using a two-sided Mann-Whitney U test.
Extended Data Figure 9.
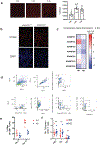
Extended Data Figure 9.. Versican accumulates in the lung during severe IAV infection in mice and affects localization and responses of T cells.
(A) Representative fluorescence microscopy images of VCAN staining at 0, 3, and 6 days after infection from two independent experiments. Scale bar = 200 μm. Quantification of VCAN staining is presented at the right. Area-under-curve was determined from the average of five intensity profiles of fluorescence per image. Each data point represents average of intensity profiles for each individual animal (0dpi, n = 6, 3dpi, n = 8; 6 dpi, n = 6). Error bars represent SEM. (B) Representative images of intact VCAN staining in lung sections from ADAMTS-4+/+ and ADAMTS-4−/− collect 9 days after infection from two independent experiments. Note that images are also presented in Figure 3H with CD3 staining. Scale bar = 50 μm. (C) Heatmap representing log2 fold change values in gene expression for each genotype relative to mock-infected controls. Whole lungs were collected 9 days after infection. (D) Gating strategy for identifying CD8+ T cells in lungs of IAV-infected mice. CD8+ T cells were identified as CD45+CD3+CD8+. (E) Frequency of IFNg+ in ADAMTS-4 WT and KO mice at 9 and 12 days after infection. Each data point represents a biologically independent animal (9dpi: WT, n = 5; KO, n = 5; 12dpi: WT, n = 5; KO, n = 4). (F) Total cell number of tetramer+ CD8+ T cells in the lung at 9 days after infection (WT, n =10; KO, n = 10). Error bars represent standard error of the mean.
Extended Data Figure 10.
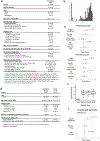
(A) Demographic information for the Pediatric Intensive Care Influenza (PICFLU) cohort. (B) Histogram of VFDS for the PICFlu cohort. (C) Odds ratios for PRMODS and PRAHRF, as well as gender, previously healthy, age, and steroids as covariates. (D) Demographic information for influenza infection cohorts in Taiwan and Guangzhou. (E) Compartmentalization of ADAMTS-4 in samples from upper (nasal wash) and lower (sputum, BALF, ETA) respiratory tracts (NW, n = 131; sputum, n = 48; BALF, n = 25; ETA, n =34). Box plots were generated for samples in which ADAMTS-4 protein was detectable. Center line indicates median, bottom and top of boxes indicate first and third quartiles, and whiskers extend to 1.5 times the interquartile range. (F) Odds ratios for VFDS<10, including gender and age as covariates, in combined analysis of three human cohorts. Odds ratios (C,F) determined using logistic regression with FDR adjustments for multiple testing.
Figure 1.
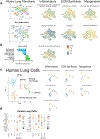
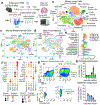
Figure 1.. Single-cell gene expression profiling of CD45-cells during severe IAV infection.
(A) Schematic of sample collection for scGEX. (B) t-SNE projection of murine lung cells based on scGEX. Data from all time points and mice were aggregated (n = 5 for time points 0, 1, and 3 dpi, and n = 4 for 6 dpi). ~40,800 individual cells are represented in the figure. (C) t-SNE projection of murine mesenchymal cells expressing Col1a2. (D) t-SNE projection of murine mesenchymal cells with day post-infection (dpi). (E) Summary of gene-set enrichment analysis (GSEA) comparing all cells in each cluster (1, n = 1188; 2, n = 1123; 4, n = 892; 6, n = 749; 8, n = 681). (F) Expression of key genes in murine lung mesenchymal cells. (G) Kinetics of fibroblast activation states. Representative flow plots of ITGA5/CD49e, CD9, and BST2 staining. (H) Frequency of DRFib and IRFib activation states during infection (0dpi, n = 5; 3dpi, n = 4; 6dpi, n = 3; 9dpi, n = 4; 12dpi, n = 4; 21dpi, n = 5). Error bars indicate standard error of the mean (SEM).
Figure 2.
Figure 2.. ADAMTS-4 is a lung fibroblast-derived ECM protease induced by influenza virus infection.
(A) Average log2 fold-change values relative to mock-infected or -treated controls. For co-culture experiments, each column represents a biological replicate. For monoculture experiments, each column represents the average of two independent experiments performed with duplicate stimulations. (B) Average log2 fold-change values in gene expression relative to mock-infected mice (n = 3 – 5 mice per time point) from lung homogenates. (C) Adamts4 expression by cell type from scGEX data. (D) Fold change in Adamts4 gene expression relative to bulk CD45+ cells in cells sorted prior to and 3 days after infection. (E) Spatial transcriptomics of lung tissue collected 10 days after infection. Scale bar = 1 mm.
Figure 3.
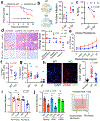
Figure 3.. ADAMTS-4 promotes lethal immunopathology during IAV infection in mice.
(A) Survival curves following lethal IAV challenge, ADAMTS-4+/+ (WT), n = 33; ADAMTS-4−/− (KO), n = 23. Log-rank Test, two-sided. Data pooled from five independent experiments. (B) Representative lung images and quantification of viral spread. Areas of active infection outlined in red. (3dpi: WT, n = 6; KO, n = 5 and 6dpi: WT, n = 5; KO, n = 6). (C) Arterial oxygen saturation (% SpO2) at 3 and 6 days after infection (WT, n =5; KO, n = 5) (D) Representative images and histological scores at 9 dpi with sublethal challenge (WT, n =9; KO, n = 9). Scale bar, 4x = 1mm, 20x = 200μm. (E) Airway resistance with sublethal challenge (Uninfected: WT, n = 8; KO = 3, Infected: WT n = 8, KO, n = 9). (F) Frequency of IFNg+ CD8+ T cells from lungs collected at 9 dpi (WT, n =10; KO, n = 9). (G) Frequency of tetramer+ CD8+ T cells in the lung at 9 days after infection (WT, n =10; KO, n = 10). (H) Representative images of CD3 (green), intact versican (red), and DAPI (blue) staining in lung sections and quantification of CD3+ cells. Three to four fields of view imaged from each individual mouse (uninfected, n = 3; WT, n = 5; KO, n = 4). Scale bar = 50 μm (I) CD8+ T cell migration in presence of ADAMTS-4 WT and KO fibroblasts. Migrated cells normalized to uncoated control for each genotype (n = 6 biologically independent samples/group) (J) CD8+ T cell migration in presence of fibroblast activation states (n = 4 biologically independent samples/ group). Unless otherwise indicated, data are pooled from two independent experiments. Error bars indicate SEM. For statistical analysis, groups were compared using a two-sided Mann-Whitney U test.
Figure 4.
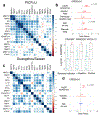
Figure 4.. ADAMTS-4 levels are associated with severe seasonal and avian influenza infections.
(A) Correlation matrix of analytes for the PICFLU cohort. For each pairwise comparison, color indicates the Spearman correlation coefficient while the size of the box indicates significance level. Analytes are arranged by hierarchical clustering. (B) Odds ratios for VFDS<10 as well as gender, previously healthy, age, and steroids as covariates. Boxplots of log10(1+ADAMTS4) values for each severity indicator (n = 84 samples from individual patients). Center line indicates median, bottom and top of boxes indicate first and third quartiles, whiskers extend to 1.5 times the interquartile range. Positive (red) or negative (blue) association. (C) Correlation matrix of analytes from the first available time point for each patient in Taiwan/Guangzhou cohorts. (D) Odds ratio for VFDS<10, including gender and age as potential covariates. Odds ratios (B, D) determined using logistic regression with FDR adjustments for multiple testing.

Comment in

Similar articles

Cited by

References

    1. Matthay MA et al. Acute respiratory distress syndrome. Nat Rev Dis Primers 5, 18 (2019). - PMC - PubMed
    1. Soares MP, Teixeira L & Moita LF Disease tolerance and immunity in host protection against infection. Nat. Rev. Immunol 17, 83–96 (2017). - PubMed
    1. Forum of International Respiratory Societies. The Global Impact of Respiratory Disease - Second Edition European Respiratory Society Second Edition, (2017).
    1. Duan S & Thomas PG Balancing Immune Protection and Immune Pathology by CD8(+) T-Cell Responses to Influenza Infection. Front. Immunol 7, 25 (2016). - PMC - PubMed
    1. Bonnans C, Chou J & Werb Z Remodelling the extracellular matrix in development and disease. Nat. Rev. Mol. Cell Biol 15, 786–801 (2014). - PMC - PubMed

Publication types

MeSH terms