. 2020 Dec;27(12):1194-1201.
doi: 10.1038/s41594-020-00520-2. Epub 2020 Oct 26.

Structure, lipid scrambling activity and role in autophagosome formation of ATG9A

Affiliations

Structure, lipid scrambling activity and role in autophagosome formation of ATG9A

Shintaro Maeda et al. Nat Struct Mol Biol. 2020 Dec.

Abstract

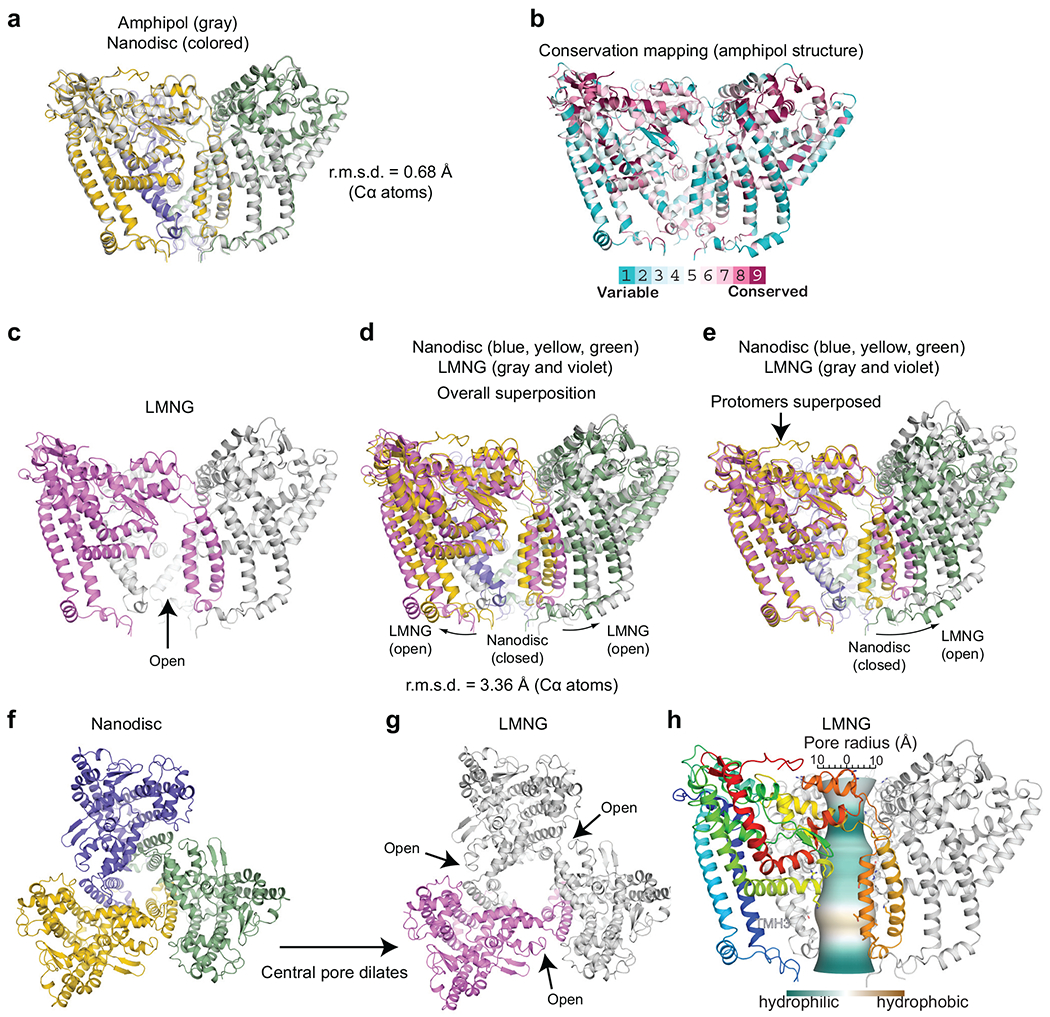
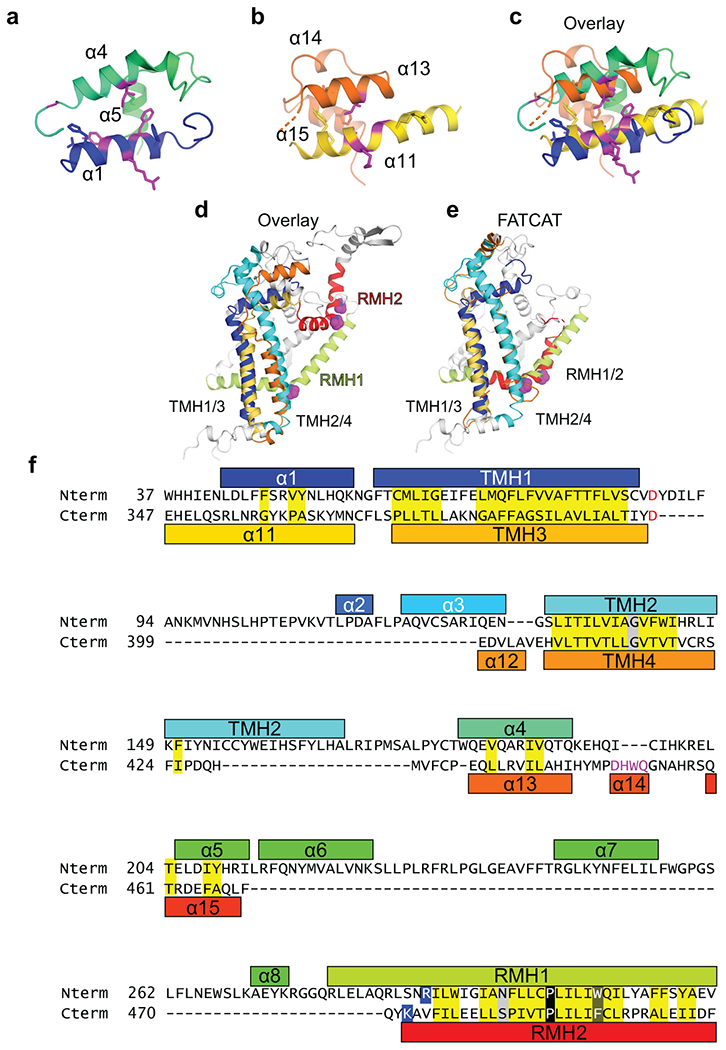
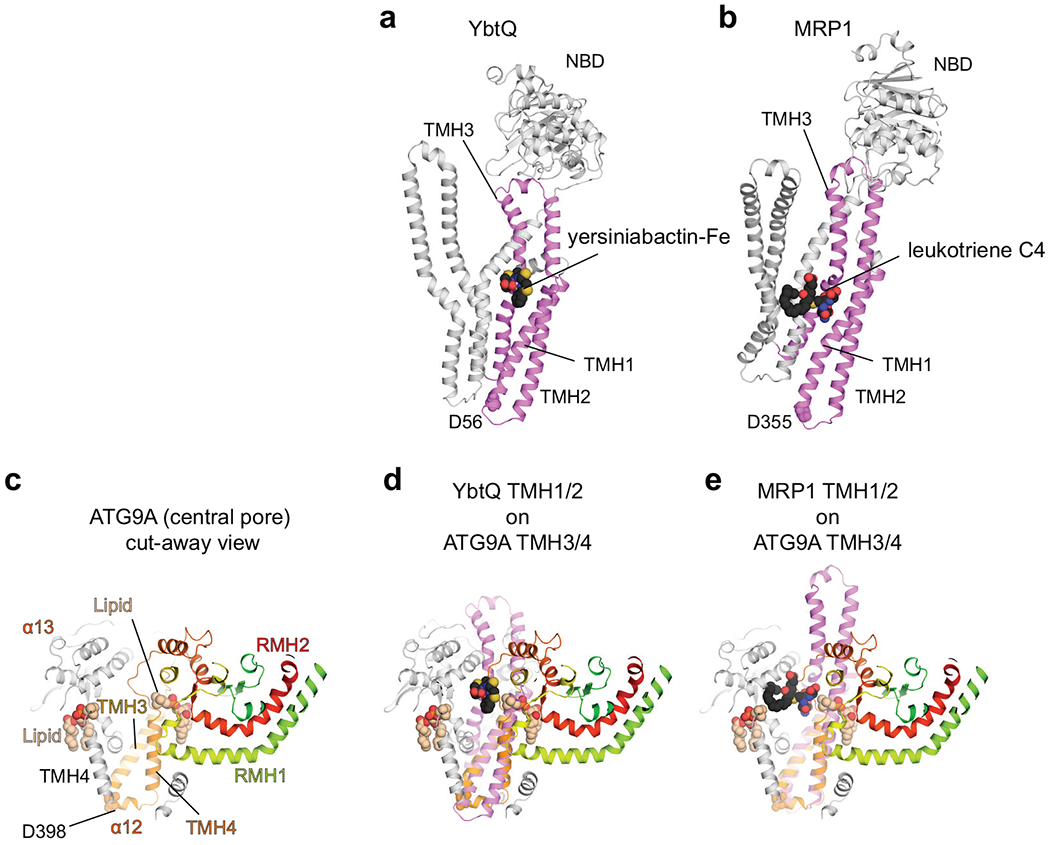
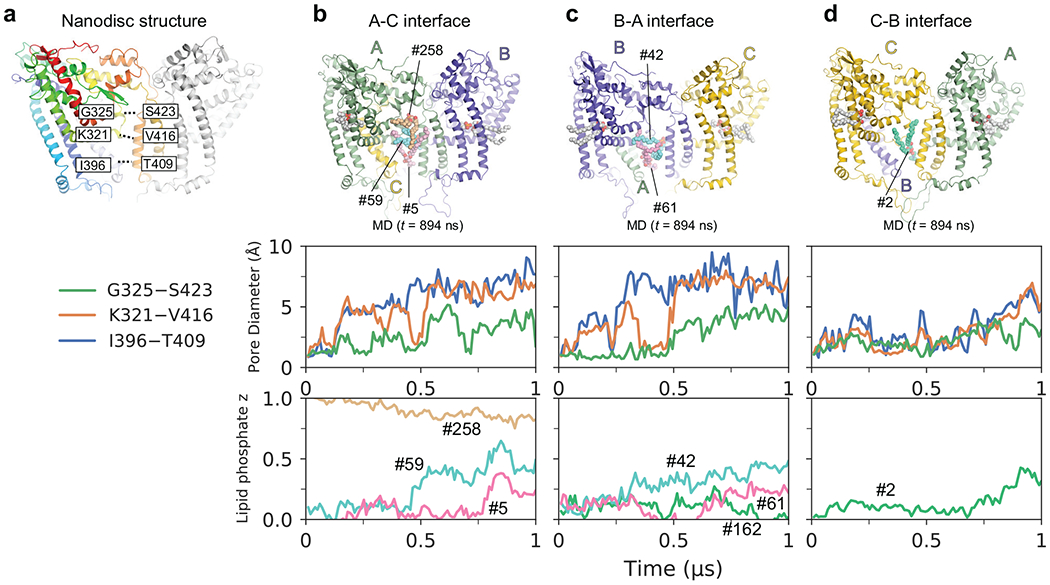
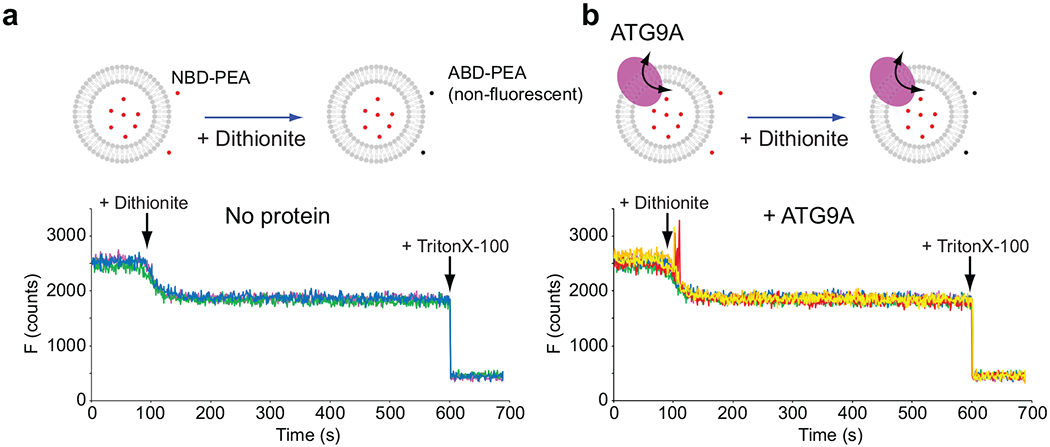
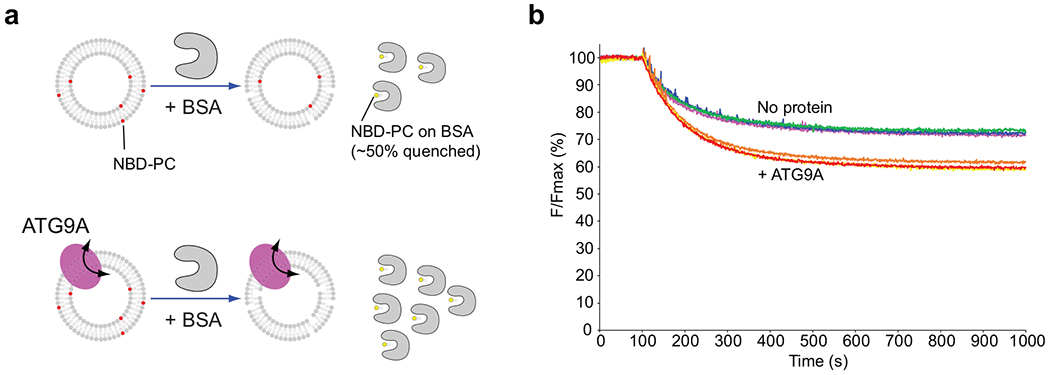
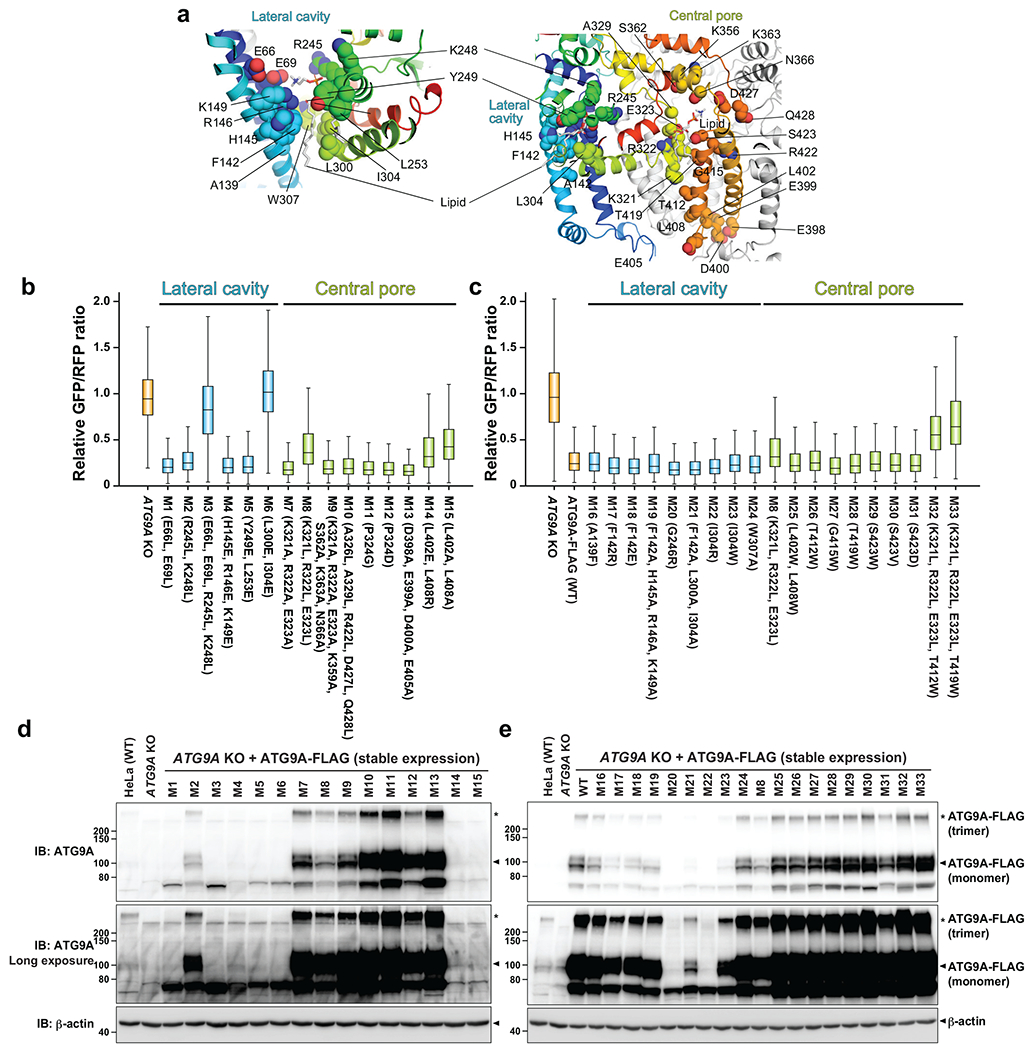
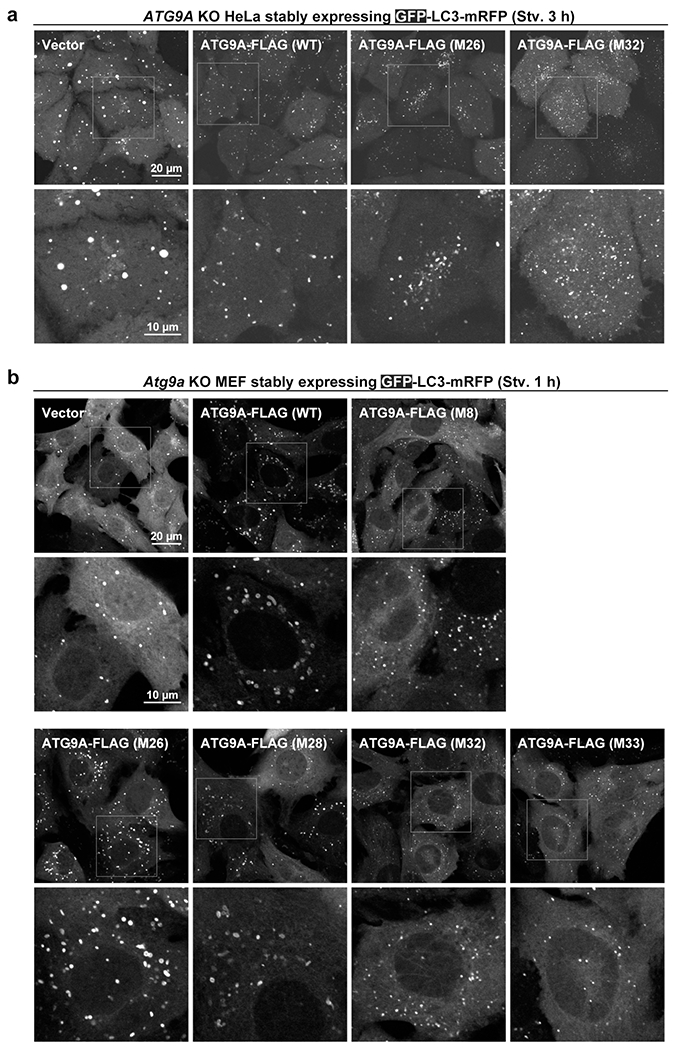
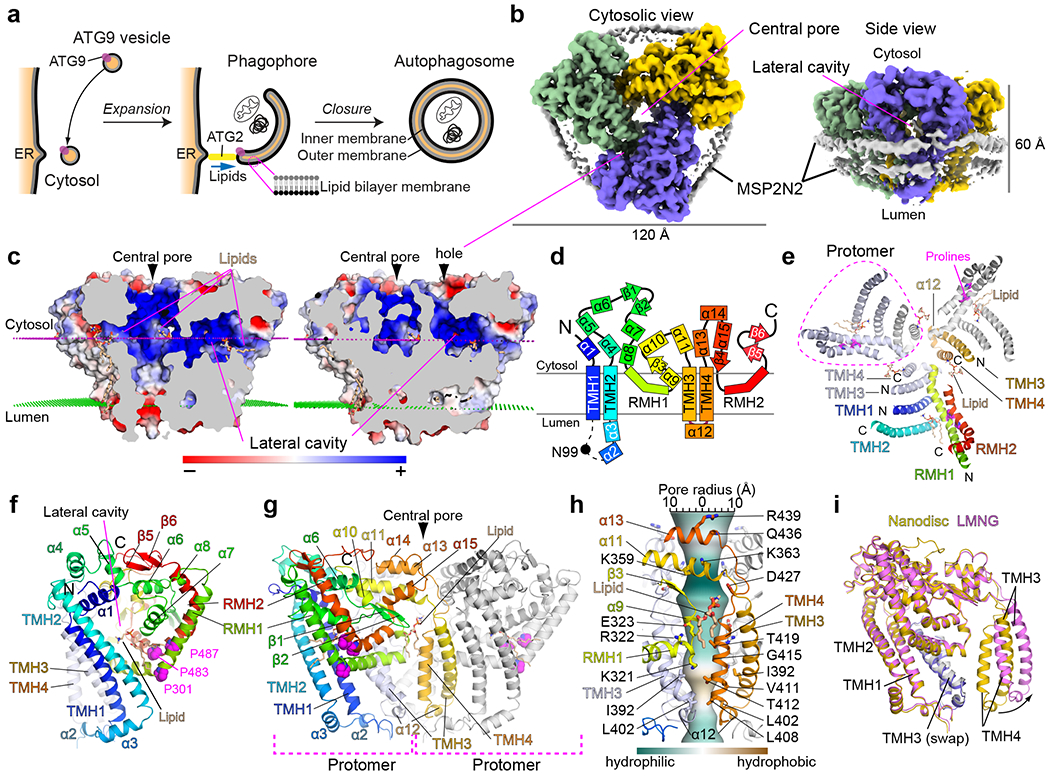
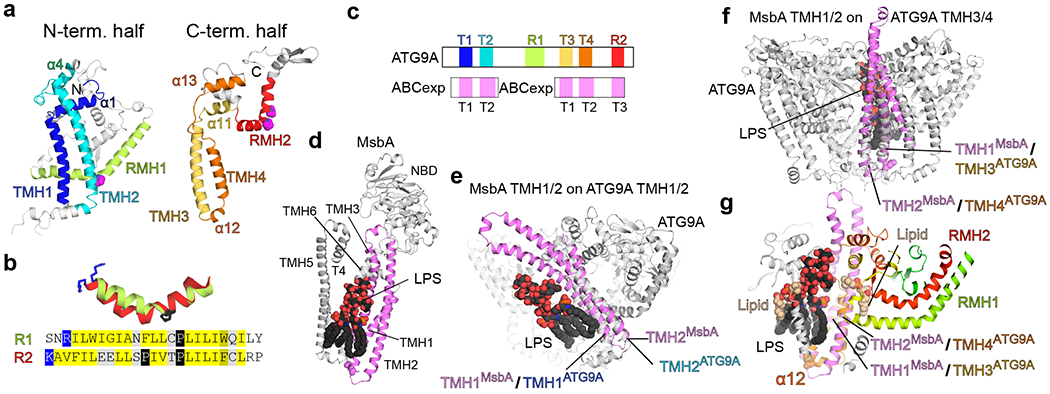
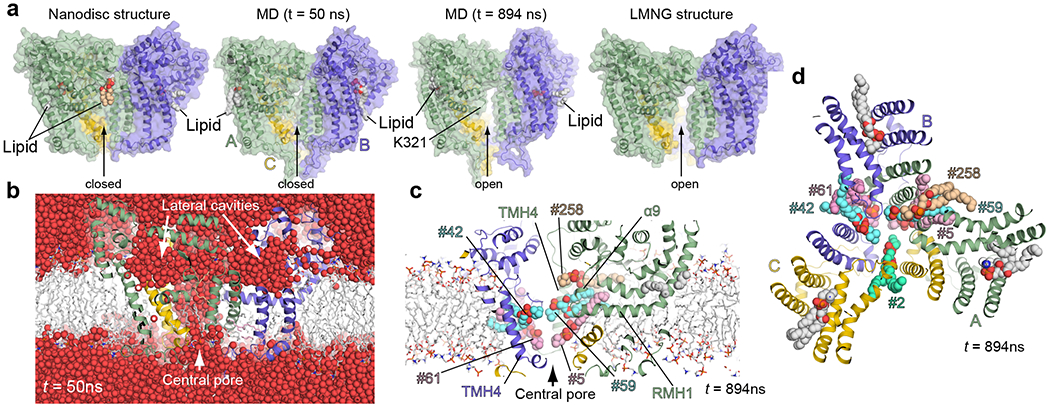
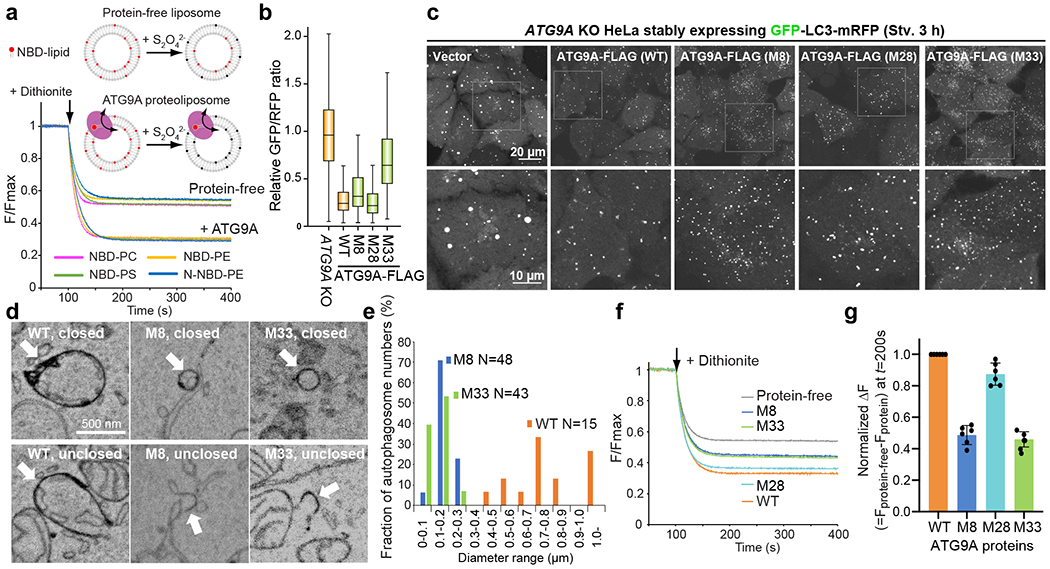
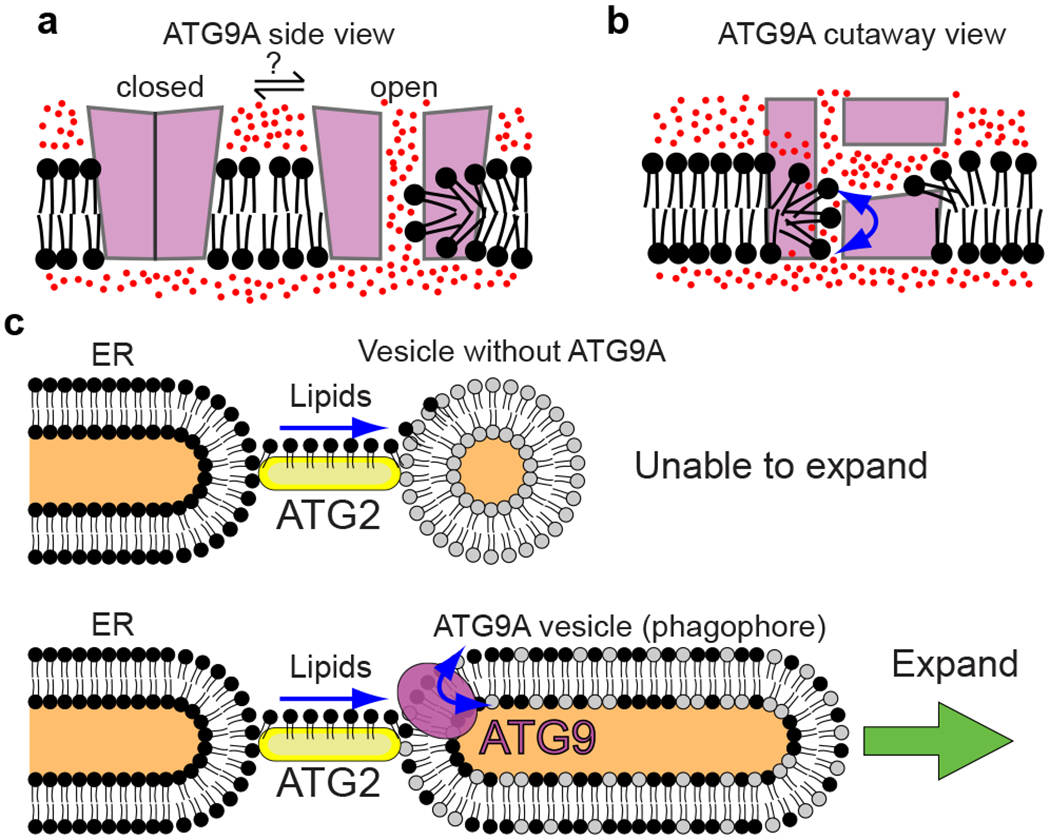
De novo formation of the double-membrane compartment autophagosome is seeded by small vesicles carrying membrane protein autophagy-related 9 (ATG9), the function of which remains unknown. Here we find that ATG9A scrambles phospholipids of membranes in vitro. Cryo-EM structures of human ATG9A reveal a trimer with a solvated central pore, which is connected laterally to the cytosol through the cavity within each protomer. Similarities to ABC exporters suggest that ATG9A could be a transporter that uses the central pore to function. Moreover, molecular dynamics simulation suggests that the central pore opens laterally to accommodate lipid headgroups, thereby enabling lipids to flip. Mutations in the pore reduce scrambling activity and yield markedly smaller autophagosomes, indicating that lipid scrambling by ATG9A is essential for membrane expansion. We propose ATG9A acts as a membrane-embedded funnel to facilitate lipid flipping and to redistribute lipids added to the outer leaflet of ATG9 vesicles, thereby enabling growth into autophagosomes.


Conflict of interest statement

Competing interests

The authors declare no competing interests.

Figures

Extended Data Fig. 1.
Conformational variability of ATG9A. a, Superposition of ATG9A structures in amphipols (gray) and nanodiscs (colored). b, Conservation mapping of ATG9A. c, The structure of ATG9A in LMNG micelles. d,e, Superpositions of ATG9A structures in nanodiscs (colored) and LMNG (gray and violet): overall superposition (d) and focused on a protomer (e). f,g, Top views of the nanodisc (f) and LMNG (g) structures visualizing the dilation of the central pore. h, CHAP analysis of the LMNG structure.
Extended Data Fig. 2.
Similarities between the N- and C-terminal halves of ATG9A. a,b, The bundles of α-helices flanking the TMH1–2 (a) and TMH3–4 (b) hairpins. c, Superposition of the bundles. d, Structural overlay of the N- and C-terminal halves generated by superposing TMH1/2 and TMH3/4. e, FATCAT flexible structural alignment of the N- and C-terminal halves. f, Sequence alignment between the N- and C-terminal halves of ATG9A.
Extended Data Fig. 3.
Structural alignments of ATG9A with ABCexps. a,b, Structures of YbtQ (a, PDB 6P6J) and MRP1 (b, PDB 5UJA) bound to their substrates. The TMH1–3s are colored violet. c, A cut-away view of the central pore of ATG9A. d,e, Superpositions of ATG9A with YbtQ (d) and MRP1 (e). ATG9A’s TMH3/TMH4 can be superimposed with TMH1/TMH2 from the identified ABCexp structures using as a guide for the helix register the conserved Asp (D398 in ATG9 with D53 in MsbA, D56 in YbtQ, D355 in MRP1). In all cases, ABCexps’ substrates locate to the central pore of ATG9A.
Extended Data Fig. 4.
MD simulation of the nanodisc structure. a, The inter-residue distances measured are indicated on the nanodisc structure. b–d, Analyses of the simulation. The top panels are structure snapshots at t = 894 ns. The middle panels show time-dependent changes of the three pore openings between three selected pairs of residues at the A-C (b), B-A (c), and C-B (d) chain interfaces. The bottom panels show the trajectory of individual lipids that penetrate through the interface during the simulation. Each trace shows the Z position of the phosphate head of a lipid of interest, normalized by the average z coordinate of the luminal (0) and cytosolic (1) leaflets. The simulation shows lipid movements induced by the dynamic behavior of the protein. The luminal sides of the A-C and B-A interfaces (blue and orange lines in b and c) open early (t = ~100–200 ns), followed by insertions of the headgroups of the lipids #59 and #42 from the luminal leaflet through the A-C and B-A interfaces, respectively (b, c, cyan lines, t = ~300–450 ns). As these headgroups move toward the cytosolic side, the lipids #5 and #61 in the luminal leaflet insert their headgroups into the pore through the A-C and B-A interfaces, respectively (b, c). Subsequently, the cytosolic side of the A-C and B-A interfaces open (b, c, green lines), and at the A-C interface, the lipid #258 in the cytosolic leaflet entered the pore. Conversely, the C-B interface remained closed longer with respect to the A-C and B-A interfaces, but it eventually started to open after t = ~700 ns, allowing lipid #2 in the luminal leaflet to insert its headgroup into the luminal side of the pore (d). All the lipids mentioned here become laterally orientated following the placement of their headgroups into the pore. Source data for plots are available online.
Extended Data Fig. 5.
Dithionite permeation assays. a,b, Top panels show the schemes of the experiments with no protein (a) and ATG9A (b). 26μM NBD-phosphoethanolamine (PEA), which was synthesized by conjugating NBD-chloride and PEA and purified by agarose gel electrophoresis, was included in the (proteo)liposome reconstitution mixtures. After reconstitutions, NBD-PEA was removed by dialysis. Fluorescence was recorded as described for the dithionite lipid scramblase assays. 30 mM dithionite was added to the reaction mixtures at t = 100s. The initial drops of fluorescence indicate that the residual amounts of NBD-PEA at the outside of the (proteo)liposomes were quenched. Between the two experiments, the addition of dithionite quenched the same amount of fluorescence and left the same amount of fluorescence, indicating that the same amount of NBD-PEA was included in the (proteo)liposomes. Fluorescence remained almost unchanged after reaching plateaus quickly. At 600s, 0.1 % TritonX-100 was added to the reaction mixtures to dissolve the membranes for full quenching. The same amount of fluorescence was lost between the two experiments, confirming that the same amounts of NBD-PEA were included in liposomes and proteoliposomes. Thus, the ATG9A proteoliposomes were impermeable to dithionite. The experiments were repeated three times. All results are shown in different colors. Source data are available online.
Extended Data Fig. 6.
BSA back extraction lipid scrambling assays. a, Schematic for the BSA back extraction-based lipid scrambling assay. NBD-lipids are preferentially extracted by fatty acid-free BSA. Upon extraction, the fluorescence of BSA-bound NBD-lipids is reduced by ~ 50%. b, The results with reconstituted liposomes and ATG9A-containing proteoliposomes. 1.5 mg/ml BSA was added to each reaction at t = 100s. BSA extracts NBD-lipids only from the outer leaflet of the membranes. Thus, in the absence of scrambling, ~50% of NBD-lipids on the outer leaflet lose their fluorescence by ~50%, reducing the total fluorescence by ~25%. In the presence of ATG9A, an additional ~15% of fluorescence was lost upon BSA addition, which indicates that NBD-lipids that were originally in the inner leaflet were exposed to BSA upon flipping. Source data are available online.
Extended Data Fig. 7.
GFP-LC3-RFP autophagic flux assays with ATG9A mutants. a, Locations of the mutations on the ATG9A nanodisc structure. Hydrophilic and hydrophobic amino acids were replaced with hydrophobic and hydrophilic ones, respectively. b,c, Flow cytometry autophagy flux assays. GFP/RFP fluorescence ratios of Torin 1-streated ATG9A KO HeLa cells stably expressing GFP-LC3-mRFP and ATG9A-FLAG mutants are plotted. Data shown in (b) and (c) are the results of the first and second rounds of mutant screenings, respectively. Data of cell populations (N=4800 for b and N=2500 for c) are presented as box plots. The box limit, the horizontal line, and the whisker show the first and third quartiles, the median, and the minimum and maximum values, respectively. No outliers are shown. The assay was repeated for the mutants shown in Figure 4, and they were reproducible. The data shown in blue and green are of mutations in the lateral cavity and central pore, respectively. d,e, Western blotting of ATG9A KO HeLa cells stably expressing ATG9A-FLAG mutants. Source data for the box plots are available online.
Extended Data Fig. 8.
Autophagosome formation in ATG9A mutant-expressing cells. a,b, ATG9A KO HeLa cells (a) and MEFs (b) stably expressing GFP-LC3-mRFP and ATG9A-FLAG mutants were observed by fluorescence microscopy. GFP fluorescence was monitored. In (a) additional mutants M26 (T412W) and M32 (M8+M26) are shown. ATG9A KO HeLa ells and WT ATG9A-FLAG-expressing cells are the same image as shown in Figure 4. Images were acquired after 3h starvation. M26 yielded typical GFP-LC3 puncta while M32 generated smaller autophagosomes. The results are similar to those of M28 (T419W) and M33 (M8+M28), which were selected for followed-up 3D CLEM and biochemical studies, as shown in Figure 4. (b) MEFs were starved for 1 h, and GFP fluorescence was monitored. In ATG9A KO MEFs, GFP-LC3 forms larger puncta than typical autophagosomes. Expression of WT ATG9A-FLAG, as well as M26 and M28, generated ring-shaped autophagosomes, while M8/M32/M33-expressing cells yielded markedly smaller GFP-puncta. These observations are consistent with the results with HeLa cells, leading to the conclusion that the observed effects of the mutations in ATG9A are cell type-independent.
Fig. 1.
Fig. 1.. The structure of ATG9A.
a, Model of autophagosome formation. Black and gray lines indicate monolayers of a lipid bilayer (membrane). b, Cytosolic (left) and side (right) views of the unsharpened cryo-EM map of ATG9A embedded in the MSP2N2 nanodiscs. c, Side cut-away views of ATG9A colored with electrostatic potential. Magenta and green dotted lines are cytosolic and luminal membrane surfaces determined by the PPM server. Positively and negatively charged surfaces are indicated by blue and red colors, respectively. d, The transmembrane topology of ATG9A. e, A cytosolic view of the structure. Cytosolic parts are not shown to visualize the membrane-domain clearly. A monomer is colored in rainbow and the other two monomers are shown in blue, white and gray. f, The structure of the protomer. g, A side view of the ATG9A trimer. h, Central pore-forming residues. The pore surface was calculated by CHAP and is colored to show hydrophobicity of the pore as indicated. i, Superposition of the protomers of the nanodisc and LMNG structures.
Figure 2.
Figure 2.. Dissection of the ATG9A architecture.
a, The N- and C-terminal fragment structures of ATG9A. The fragments are shown in similar orientations. b, Superposition of RMH1 and RMH2 helices and their aligned sequences. c, Diagram of the primary structure of ATG9A with matches to ABC transporters. d, MsbA structure bound to LPS (PDB 6BPP). Only the monomer is shown for clarity. e–g, Superpositions of MsbA TMH1/2 onto TMH1/2 (e) and TMH3/4 (f, g) of ATG9A. For MsbA, only TMH1–3 and the bound LPS are shown for clarity. Shown in g is a cut-away view of the central pore of ATG9A with the superposed MsbA and LPS.
Figure 3.
Figure 3.. Conformational stability of ATG9A.
a, Comparisons of the cryo-EM structures (nanodisc on the left and LMNG on the right) with snapshots (t = 50 and 894 ns) of the MD simulation of the nanodisc structure. For the nanodisc structure, modeled lipids of interest are shown. MD snapshots are shown with the lipids that enter the lateral cavities. Lipids that enter the central pore are not shown for clarity. The snapshots t = 50 and 894 ns are representative of closed and open conformations, respectively. b, Solvation of the central pore and the lateral cavities. The snapshot of the MD simulation at t =50 ns (still closed) is shown with water molecules as red spheres. c,d, Lipid molecules (spheres) penetrate into the central pore through the protomer-protomer interface. Side (c) and top (d) views at t = 894 ns are shown with penetrating lipids (numbered). Analyses of the trajectories of these lipids are presented in Extended Data Fig. 4. The lipids bound in the lateral cavities at t = 894 ns are in orientations similar to the one observed in the cryo-EM nanodisc structure.
Figure 4.
Figure 4.. Functional studies of ATG9A.
a, Schematic of in vitro lipid scramblase assay with ATG9A. Results of experiments using various NBD-lipid probes are shown. Each trace is the average of three experiments with proteoliposomes reconstituted independently using the same batch of liposomes. b, Quantitative autophagic flux assays. ATG9A KO HeLa cells stably expressing the GFP-LC3-mRFP probe and ATG9A mutants were stimulated by Torin 1, an inhibitor of mTOR. Autophagic activity of each cell was quantified as the ratio between GFP and mRFP fluorescence. Data of cell populations (N=2500 for each cell line) are presented as box plots. The box limit, the horizontal line, and the whisker show the first and third quartiles, the median, and the minimum and maximum values, respectively. No outliers are shown. Data shown are a subset of the second-round screening presented in Extended Data Fig. 7 and were reproducible in at least another independent experiment. M8: K321L/R322L/E323L, M28: T419W, M33: M8+M28. c, GFP fluorescence images of starved (3 h) ATG9A KO HeLa cells stably expressing the GFP-LC3-mRFP probe and ATG9A-FLAG mutants. The bottom panels are expanded images of the boxed area in the top images. Data shown are representative of at least two independent experiments with similar results. d, 3D CLEM analyses of WT/M8/M33-expressing cells. e, Size distributions of autophagosomes in WT/M8/M33-expressing cells. N is the total number of closed membranes identified in each whole-cell and was used to calculate the fraction of the membranes that belong to each bin. Data are representative of at least two experiments for mutants. f, Lipid scrambling activities of ATG9A mutant proteins. Traces show the average of four experiments with independently reconstituted proteoliposomes using one batch of NBD-PE-containing liposomes. g, Relative lipid scrambling activity of ATG9A. Differences in the fluorescence values at t = 200 from that of the protein-free trace were normalized against WT. Individual data points are shown along with mean and s.d. from 6 independent experiments, each using a separate batch of liposomes. Source data for graphs are available online.
Figure 5.
Figure 5.
Models. a,b, Model of the scramblase activity of ATG9A. The side view of the closed and open conformations of ATG9A (a). A cutaway view (b) of the open conformation. Water molecules were depicted as red dots. c, Model of phagophore expansion. ATG2 transports lipids (black) from the ER. Vesicle lacking ATG9A is unable to expand (top). A phagophore with ATG9A is able to expand upon re-distribution of transported lipids (black) between leaflets of the bilayer by ATG9A.

Similar articles

Cited by

References

    1. Levine B & Kroemer G Biological Functions of Autophagy Genes: A Disease Perspective. Cell 176, 11–42 (2019). - PMC - PubMed
    1. Jiang P & Mizushima N Autophagy and human diseases. Cell Res 24, 69–79 (2014). - PMC - PubMed
    1. Lamb CA, Yoshimori T & Tooze SA The autophagosome: origins unknown, biogenesis complex. Nat Rev Mol Cell Biol 14, 759–774 (2013). - PubMed
    1. Yamamoto H et al. Atg9 vesicles are an important membrane source during early steps of autophagosome formation. J Cell Biol 198, 219–233 (2012). - PMC - PubMed
    1. De Tito S, Hervas JH, van Vliet AR & Tooze SA The Golgi as an Assembly Line to the Autophagosome. Trends Biochem Sci 45, 484–496 (2020). - PubMed

Methods-only References

    1. Herzik MA Jr., Wu M & Lander GC Achieving better-than-3-Å resolution by single-particle cryo-EM at 200 keV. Nat Methods 14, 1075–1078 (2017). - PMC - PubMed
    1. Suloway C et al. Automated molecular microscopy: the new Leginon system. J Struct Biol 151, 41–60 (2005). - PubMed
    1. Zheng SQ et al. MotionCor2: anisotropic correction of beam-induced motion for improved cryo-electron microscopy. Nat Methods 14, 331–332 (2017). - PMC - PubMed
    1. Lander GC et al. Appion: an integrated, database-driven pipeline to facilitate EM image processing. J Struct Biol 166, 95–102 (2009). - PMC - PubMed
    1. Rohou A & Grigorieff N CTFFIND4: Fast and accurate defocus estimation from electron micrographs. J Struct Biol 192, 216–221 (2015). - PMC - PubMed

Publication types

MeSH terms

LinkOut - more resources