Comparative Study
. 2020 Oct 20;12(10):3197.
doi: 10.3390/nu12103197.

A High-Fat Diet Increases Gut Microbiota Biodiversity and Energy Expenditure Due to Nutrient Difference

Affiliations
Comparative Study

A High-Fat Diet Increases Gut Microbiota Biodiversity and Energy Expenditure Due to Nutrient Difference

Botao Wang et al. Nutrients. .

Abstract

A high-fat diet (HFD) can easily induce obesity and change the gut microbiota and its metabolites. However, studies on the effects of high-fat diets on the host have drawn inconsistent results. In this study, the unexpected results showed that the refined HFD increased gut microbiota diversity and short-chain fatty acids (SCFAs), causing an increase in energy metabolism. Further analysis revealed these changes were caused by the different fiber content in these two diets. Male C57BL/6J mice (4-5 weeks old) were fed either HFD or refined low-fat diet (LFD) for 14 weeks. The metabolic rates, thermogenesis, gut microbiome, and intestinal SCFAs were tested. The HFD triggered obesity and disturbed glucose homeostasis. Mice fed HFD ingested more fiber than mice fed LFD (p < 0.0001), causing higher intestinal SCFA concentrations related to the increased abundances of specific bacteria in the HFD group. Also, the HFD increased metabolic heat and up-regulated thermogenesis genes uncoupling protein 1(Ucp-1), peroxisome proliferator-activated receptor-γ coactivator-1α (Pgc-1α) expression in the brown adipose tissue (BAT). It was revealed by 16S rRNA gene sequencing that the HFD increased gut microbial diversity, which enriched Desulfovibrionaceae, Rikenellaceae RC9 gut group, and Mucispirillum, meanwhile, reduced the abundance of Lactobacillus, Bifidobacterium, Akkermansia, Faecalibaculum, and Blautia. The predicted metabolic pathways indicated HFD increased the gene expression of non-absorbed carbohydrate metabolism pathways, as well as the risks of colonization of intestinal pathogens and inflammation. In conclusion, the HFD was obesogenic in male C57BL/6J mice, and increased fiber intake from the HFD drove an increase in gut microbiota diversity, SCFAs, and energy expenditure. Meanwhile, the differences in specific nutrient intake can dissociate broad changes in energy expenditure, gut microbiota, and its metabolites from obesity, raising doubts in the previous studies. Therefore, it is necessary to consider whether differences in specific nutrient intake will interfere with the results of the experiments.

Keywords: SCFAs; energy expenditure; fiber; glucose homeostasis; gut microbiota; high-fat diet; low-fat diet; obesity.


Conflict of interest statement

The authors declare no conflict of interest.

Figures
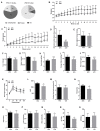
Figure 1
Figure 1
Effects of high-fat diet (HFD) and low-fat diet (LFD) on mouse physiology and glucose control. (A) Composition of dietary nutrition. (B) Weekly body weight of mice fed an HFD or LFD. (C) Weekly body weight gain by mice fed an HFD or LFD. (DG) Weight of different tissues at 14th week. (H) Mean daily food intake. (I) Mean daily energy intake. (J) Fiber intake. (K) Blood glucose concentrations of oral glucose tolerance test (OGTT). (L) The area under the curve (AUC) of blood glucose concentrations. (M) Fasting blood glucose concentrations. (NS) Concentrations of blood biochemical indices, namely total cholesterol (TC), triacylglycerol (TG), low-density lipoprotein cholesterol (LDL-C), high-density lipoprotein cholesterol (HDL-C), alanine aminotransferase (ALT), and aspartate aminotransferase (AST). Mean values ± standard deviation (S.D.) are plotted. Asterisks indicate significant differences (unpaired two-tailed Student’s t-test, * p < 0.05, ** p < 0.01, *** p < 0.001, **** p < 0.0001, n = 8 mice per group).
Figure 2
Figure 2
HFD enhanced energy expenditure and lipid metabolism. (A) The relative rates of carbohydrate versus fat oxidation (R.Q.) in the light and dark. (B) Metabolic heat in the light and dark. (C) Consumption of O2 in the light and dark. (D) Production of CO2 in the light and dark. (E) Relative expression of thermogenesis genes uncoupling protein 1(Ucp-1), peroxisome proliferator-activated receptor-γ coactivator-1α (Pgc-1α), peroxisome proliferator-activated receptor-alpha (Ppar-α), and peroxisome proliferator-activated receptor-gamma (Ppar-γ) in the BAT. (F) Relative expression of lipid metabolism genes patatin-like phospholipase domain-containing protein 2 (Atgl), hormone-sensitive lipase (Hsl), acylglycerol lipase (Mgl), and fatty acid synthase (Fasn) in the liver. Mean values ± S.D. are plotted. Asterisks indicate significant differences (unpaired two-tailed Student’s t-test, * p < 0.05, ** p < 0.01, *** p < 0.001, **** p < 0.0001, n = 7–8 mice per group).
Figure 3
Figure 3
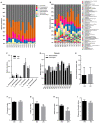
Effect of diets on cecal microbiota composition. (A,B) Microbiota composition by phylum and genus in the cecum of the HFD and the LFD mice. (C) The relative abundance of gut microbiota by phylum. (D) The relative abundance of Bacteroidetes and Firmicutes. (E) Firmicutes:Bacteroidetes ratio for the HFD and the LFD groups. (FI) Alpha-diversity indices of gut microbiota for the HFD and the LFD groups. Mean values ± S.D. are plotted. Asterisks indicate significant differences (unpaired two-tailed Student’s t-test, ** p < 0.01, *** p < 0.001, n = 7–8 mice per group).
Figure 4
Figure 4
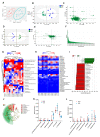
Different diets resulted in different gut microbial clusters and different dominant bacteria in the cecum. (A) Principal coordinate analysis (PCoA) of gut microbiota for the HFD and the LFD groups (PCoA 1 = 53.5%, PCoA 2 = 17.3%). (B) Principal component analysis (PCA) score scatter plots for gut microbiota for the HFD and the LFD (PC 1 = 41.9%, PC 2 = 19.0%). (C) PCA loading scatter plot of gut microbiota for the HFD and the LFD groups. (D) The orthogonal partial least square-discriminate analysis (OPLS-DA) score scatter-plot of gut microbiota for the HFD and the LFD groups (PC 1 = 39.3%, PC 2 = 14.3%). (E) The OPLS-DA loading scatter plot of gut microbiota for the HFD and the LFD groups. (F) Values of variable importance for the projection (VIP) for the predictive components (VIP predictive) of gut microbiota. (G) Heatmap of the proportion of the 23 operational taxonomic units (OTUs) determined as dominant bacteria, with rows clustered by microbiota similarity according to the Euclidean distance, and columns clustered by operational taxonomic units (OTUs) that occur more often together. (H) Heatmap of the statistical analysis of taxonomic and functional profiles (STAMP) showed significant differences in the microbiota of the HFD and the LFD groups. (I) Linear discriminant analysis (LDA) scores of gut microbiota for the HFD and the LFD groups. (J) Cladograms representing the LDA effect size (LEfSe) results for the HFD and the LFD groups. (K,L) Dot plots representing the proportional abundance of OTUs from LEfSe results. Mean values ± S.D. are plotted. Asterisks indicate significant differences (unpaired two-tailed Student’s t-test, * p < 0.05, ** p < 0.01, *** p < 0.001, n = 7–8 mice per group).
Figure 5
Figure 5
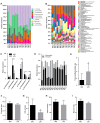
Effect of diets on colonic microbial composition. (A,B) Microbial composition by phylum and genus within the colon of mice fed an HFD or an LFD. (C) Relative abundances of gut microbiota by phylum. (D) The relative abundance of Bacteroidetes and Firmicutes. (E) Firmicutes:Bacteroidetes ratio for the HFD and the LFD. (FI) Alpha diversity indices of gut microbiota for the HFD and the LFD. Mean values ± S.D. are plotted. Asterisks indicate significant differences (unpaired two-tailed Student’s t-test, * p < 0.05, ** p < 0.01, n = 7–8 mice per group).
Figure 6
Figure 6
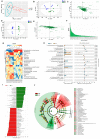
Different diets result in different gut microbiota clusters and different dominant bacteria in the colon. (A) PCoA of gut microbiota for the HFD and the LFD (PCoA 1 = 41.56%, PCoA 2 = 24.58%). (B) PCA score scatter plot of gut microbiota for the HFD and the LFD (PC 1 = 38.8%, PC 2 = 18.6%). (C) PCA loading scatter plot of gut microbiota for the HFD and the LFD. (D) The OPLS-DA score scatter plot of gut microbiota for the HFD and the LFD (PC 1 = 29.9%, PC 2 = 23.5%). (E) The OPLS-DA loading scatter plots of gut microbiota for the HFD and the LFD. (F) VIP predictive of gut microbiota. (G) Heatmap of the proportion of the 21 OTUs determined as dominant bacteria, with rows clustered by microbiota similarity using the Euclidean distance, and columns clustered by OTUs that occur more often together. (H) The extended error bar plot showed significantly different microbial communities existing between the HFD and the LFD groups. (I) LDA scores of gut microbiota for the HFD and the LFD group. (J) Cladograms were representing the LEfSe results for the HFD and the LFD groups. (n = 7–8 mice per group).
Figure 7
Figure 7
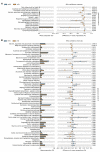
The predicted functions of the gut microbiome by Tax4Fun evaluated the differences in the Kyoto Encyclopedia of Genes and Genomes (KEGG) pathway. (A) The differences in the KEGG pathways between mice fed HFD and LFD in the cecum. (B) There were 217 pathways different between mice fed HFD and LFD. 59 pathways with a high mean proportion were selected for analysis. The extended error bar shows significant differences (two-sided Welch’s t-test with storey false discovery rate (FDR) for multiple test correction).
Figure 8
Figure 8
Effects of diets on intestinal short-chain fatty acid (SCFA) production. (A) Total SCFAs concentrations in the cecum. (B) Cecal concentrations of acetate, propionate, isobutyrate, butyrate, isovalerate, and valerate. (C) Relative proportions of acetate, propionate, and butyrate in the cecum. (D) Total SCFAs in the colon. (E) Colonic concentrations of acetate, propionate, isobutyrate, butyrate, isovalerate, and valerate. (F) Relative proportions of acetate, propionate, and butyrate in the colon. (G) Correlation of cecal dominant bacteria with SCFA concentrations. (H) Correlation of colonic dominant bacteria with SCFA concentrations. Mean values ± S.D. are plotted. Asterisks indicate significant differences were analyzed using unpaired two-tailed Student’s t-test (* p < 0.05, ** p < 0.01, *** p < 0.001, n = 7–8 mice per group), and Pearson correlation analysis was performed in (G,H).

Similar articles

Cited by

References

    1. Gregg E.W., Shaw J.E. Global Health Effects of Overweight and Obesity. N. Engl. J. Med. 2017;377:80–81. doi: 10.1056/NEJMe1706095. - DOI - PubMed
    1. Bjorge T., Haggstrom C., Ghaderi S., Nagel G., Manjer J., Tretli S., Ulmer H., Harlid S., Rosendahl A.H., Lang A., et al. BMI and weight changes and risk of obesity-related cancers: A pooled European cohort study. Int. J. Epidemiol. 2019;48:1872–1885. doi: 10.1093/ije/dyz188. - DOI - PubMed
    1. Cummings J.H., Engineer A. Denis Burkitt and the origins of the dietary fibre hypothesis. Nutr. Res. Rev. 2018;31:1–15. doi: 10.1017/S0954422417000117. - DOI - PubMed
    1. O’Keefe S.J. The association between dietary fibre deficiency and high-income lifestyle-associated diseases: Burkitt’s hypothesis revisited. Lancet Gastroenterol. Hepatol. 2019;4:984–996. doi: 10.1016/S2468-1253(19)30257-2. - DOI - PMC - PubMed
    1. King D.E., Mainous A.G., III, Lambourne C.A. Trends in dietary fiber intake in the United States, 1999–2008. J. Acad. Nutr. Diet. 2012;112:642–648. doi: 10.1016/j.jand.2012.01.019. - DOI - PubMed

Publication types

MeSH terms