. 2020 Oct 6;6(1):97.
doi: 10.1038/s41420-020-00333-8. eCollection 2020.

Parthenolide promotes the repair of spinal cord injury by modulating M1/M2 polarization via the NF-κB and STAT 1/3 signaling pathway

Affiliations

Parthenolide promotes the repair of spinal cord injury by modulating M1/M2 polarization via the NF-κB and STAT 1/3 signaling pathway

Tao Gaojian et al. Cell Death Discov. .

Abstract

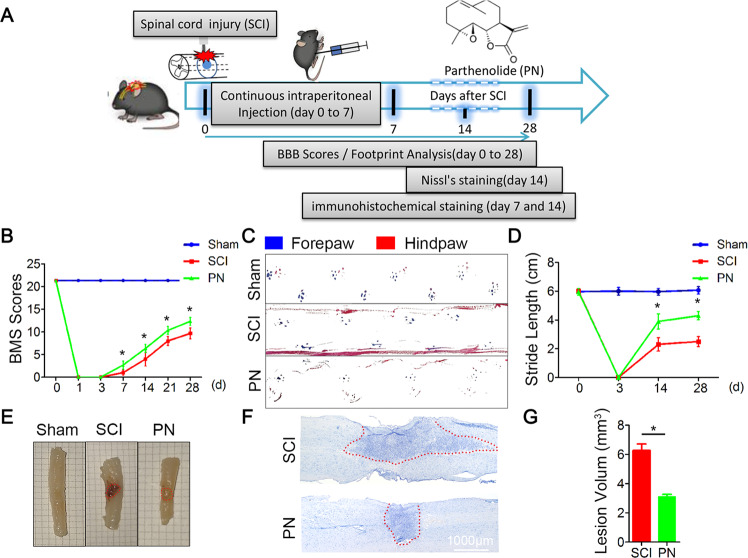
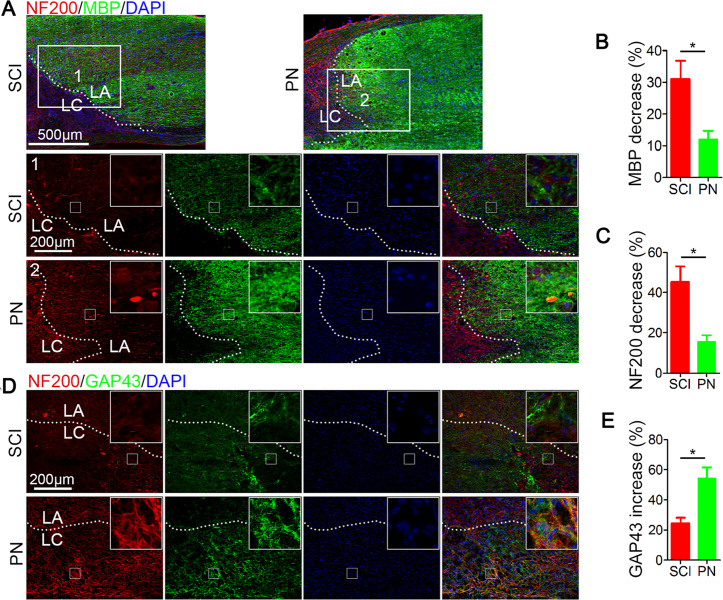
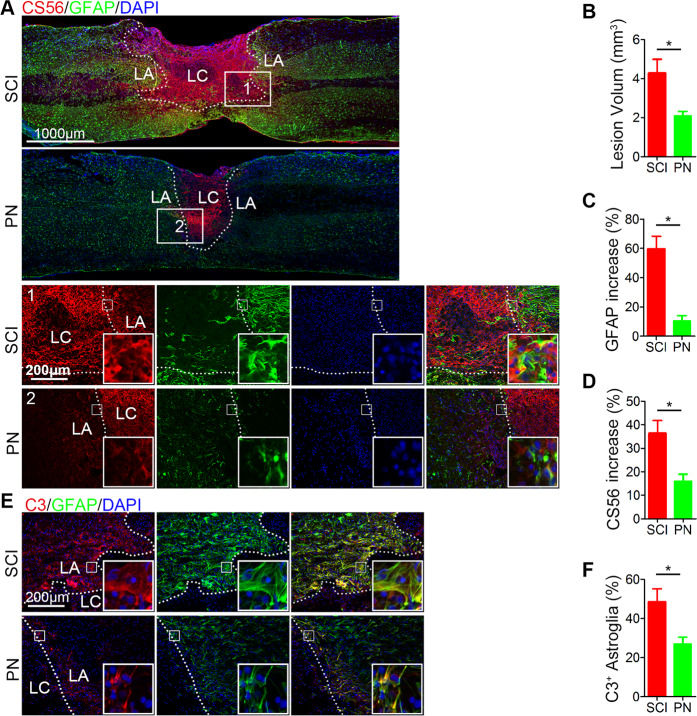
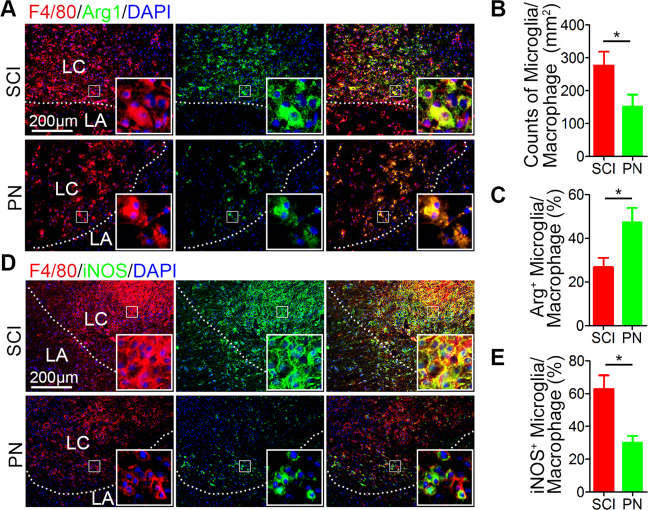
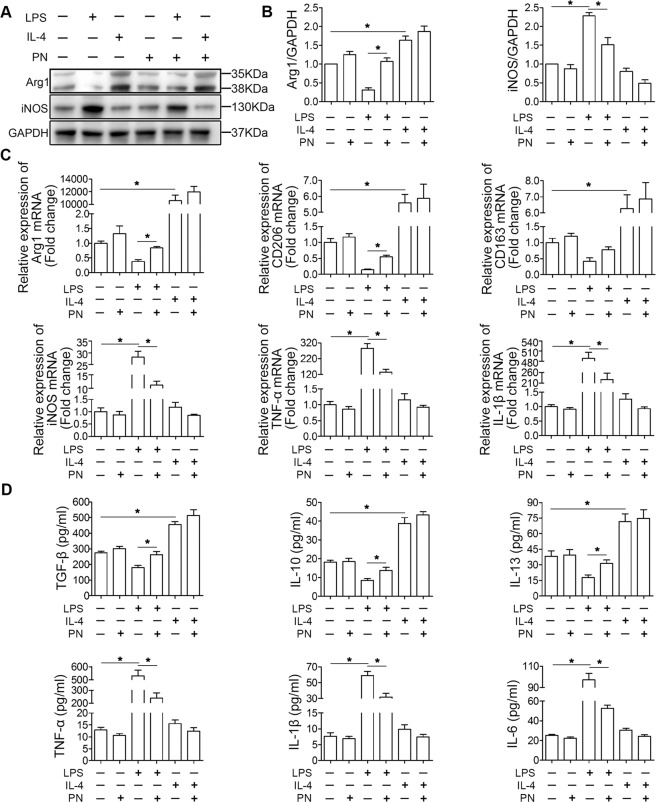
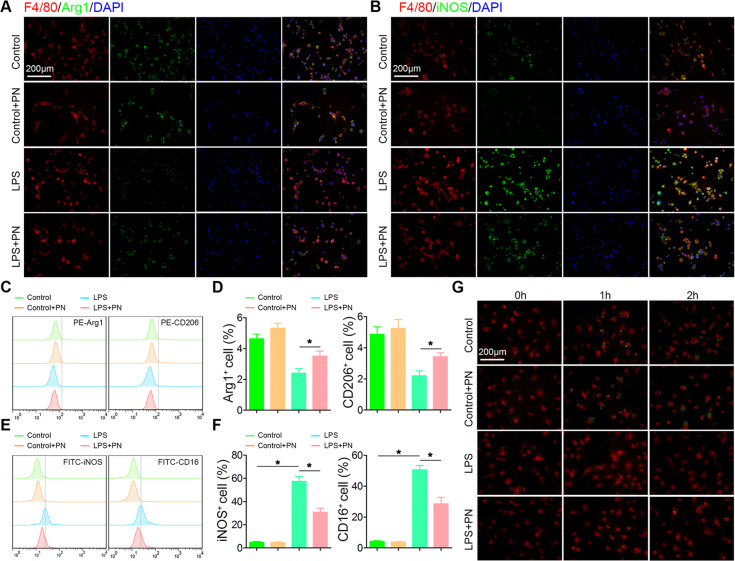
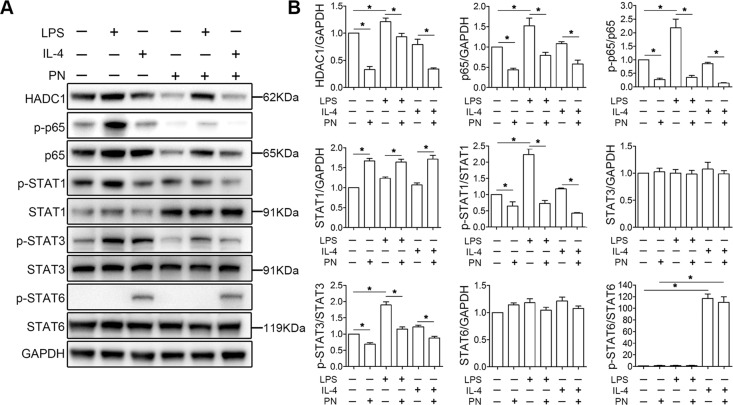
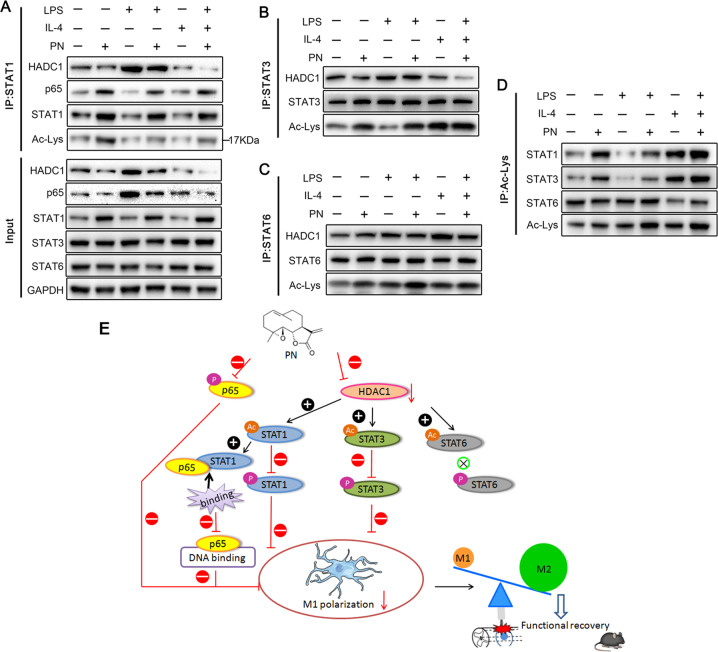
Spinal cord injury (SCI) is a severe neurological disease; however, there is no effective treatment for spinal cord injury. Neuroinflammation involves the activation of resident microglia and the infiltration of macrophages is the major pathogenesis of SCI secondary injury and considered to be the therapeutic target of SCI. Parthenolide (PN) has been reported to exert anti-inflammatory effects in fever, migraines, arthritis, and superficial inflammation; however, the role of PN in SCI therapeutics has not been clarified. In this study, we showed that PN could improve the functional recovery of spinal cord in mice as revealed by increased BMS scores and decreased cavity of spinal cord injury in vivo. Immunofluorescence staining experiments confirmed that PN could promote axonal regeneration, increase myelin reconstitution, reduce chondroitin sulfate formation, inhibit scar hyperplasia, suppress the activation of A1 neurotoxic reactive astrocytes and facilitate shift from M1 to M2 polarization of microglia/macrophages. To verify how PN exerts its effects on microglia/macrophages polarization, we performed the mechanism study in vitro in microglia cell line BV-2. PN could significantly reduce M1 polarization in BV2 cells and partially rescue the decrease in the expression of M2 phenotype markers of microglia/macrophage induced by LPS, but no significant effect on M2 polarization stimulated with IL-4 was observed. Further study demonstrated PN inhibited NF-κB signal pathway directly or indirectly, and suppressed activation of signal transducer and activator of transcription 1 or 3 (STAT1/3) via reducing the expression of HDAC1 and subsequently increasing the levels of STAT1/3 acetylation. Overall, our study illustrated that PN may be a promising strategy for traumatic SCI.

Keywords: Microglia; Spinal cord diseases.


Conflict of interest statement

Conflict of interestThe authors declare that they have no conflict of interest.

Figures

Fig. 1
Fig. 1. PN promoted neurological function recovery after SCI.
a Schematic diagram of experimental design. PN were intraperitoneally injected within 10 min after weight drop at the T10 level, and then continuously injected daily until 7 days after injury. b Basso, Beattie, and Bresnahan (BBB) limb function scores at different times after spinal cord contusion. c Representative footprints of an animal walking 14 days after SCI. Blue: forepaw print; red: hindpaw print. d Quantitative analysis of the footprint (c) in the two groups. e Gross morphology of spinal sections on day 14 postinjury. The boundary of the traumatic lesion area is indicated by the dashed lines. f Representative Nissl-stained sagittal section of spinal cord on day 14 postinjury. Scale bar, 1000 μm. g Quantitative analysis of lesion volume (f) in the two groups. All data are presented as means ± SEM (n = 5 mice per group). *P < 0.05.
Fig. 2
Fig. 2. PN suppressed demyelination and promoted axon regeneration after SCI.
a Representative images of NF200 (red) and MBP (green) immunohistochemical staining on day 14 after injury in spinal cord lesion areas. Two columns (1, and 2 respectively represent SCI group and PN group) are the enlarged images of the area around the damage boundary. Lesion core (LC) and lesion adjacent (LA) of the cavity is distinguished by the dashed lines. All cell nuclei were counterstained with DAPI (blue). Scale bar, 500 μm (upper) and 200 μm (below). b, c Semiquantification of MBP and NF200 intensity decrease in a. d Representative images of NF200 (red) and GAP43 (green) immunohistochemical staining on day 14 after injury in the two groups. All cell nuclei were counterstained with DAPI (blue). Scale bar, 200 μm. e Semiquantification of GAP43 intensity increase in d. All data are presented as means ± SEM (n = 5 mice per group). *P < 0.05.
Fig. 3
Fig. 3. PN inhibited the formation of astrocyte scar, reduced the production of CSPG and attenuated the activation of A1 astrocytes after SCI.
a Representative images of CSPG detected by CS56 (red) and GFAP (green) immunohistochemical staining on day 14 after injury in spinal cord lesion areas. Two columns (1, and 2 respectively represent SCI group and PN group) are the enlarged images of the area around the damage boundary. The cavity boundary is indicated by the dashed lines. All cell nuclei were counterstained with DAPI (blue). Scale bar, 1000 μm (upper) and 200 μm (below). b Quantitative analysis of lesion volume according to GFAP-positive scar (a) in the two groups. c, d Semiquantification of CS56 and GFAP intensity increase in (a). e Representative images of C3 (red) and GFAP (green) immunohistochemical staining on day 14 after injury in the two groups. All cell nuclei were counterstained with DAPI (blue). Scale bar, 200 μm. f Quantitative analysis of the ratio of C3+/GFAP+ cells in the lesion in (e). LA, lesion core; LA, lesion adjacent. All data are presented as means ± SEM (n = 5 mice per group). *P < 0.05.
Fig. 4
Fig. 4. PN inhibited microglia infiltration and shifted M1/M2 polarization after SCI.
a Representative images of F4/80 (red) and Arg1 (green) immunohistochemical staining on day 7 after injury in spinal cord lesion areas. The cavity boundary is indicated by the dashed lines. All cell nuclei were counterstained with DAPI (blue). Scale bar, 200 μm. b, c Quantitative analysis of the number of F4/80+ microglia/macrophages and the ratio of Arg1+/F4/80+ microglia/macrophages in the lesion in (a). d Representative images of F4/80 (red) and iNOS (green) immunohistochemical staining on day 7 after injury in spinal cord lesion areas. The cavity boundary is indicated by the dashed lines. All cell nuclei were counterstained with DAPI (blue). Scale bar, 200 μm. e Quantitative analysis of the ratio of iNOS+/F4/80+ microglia/macrophages in the lesion in d. LA, lesion core; LA, lesion adjacent. All data are presented as means ± SEM (n = 5 mice per group). *P < 0.05.
Fig. 5
Fig. 5. PN primarily suppressed the microglia M1 phenotype in BV2 cells in vitro.
a Representative western blot band showed the protein levels of Arg1 and iNOS, respectively representing M2- and M1-related gene in BV2 cells under LPS or IL-4 stimulation for 24 h in the presence or absence of PN (1 μM) was detected by western blot analysis. b Semi-quantitative analysis of inflammation-related protein levels in a, which were quantified and normalized to GAPDH. (n = 4/group). c The mRNA expression levels of M2- and M1-related genes were detected by RT-qPCR (n = 9/group). d The concentration of pro-inflammatory and anti-inflammatory cytokines secreted by BV2 cells detected by enzyme-linked immunosorbent assay (ELISA). (n = 6/group). All data are presented as means ± SEM. *P < 0.05.
Fig. 6
Fig. 6. PN inhibited M1 phenotype in BV2 cells in vitro.
a, b Representative images of F4/80 (red) and Arg1/iNOS(green) immunohistochemical staining of BV2 cells under LPS stimulation for 24 h in the presence or absence of PN (1 μM). (n = 6/group). All cell nuclei were counterstained with DAPI (blue). Scale bar, 200 μm. c, e Representative flow cytometry histograms of Arg1+, CD206+, iNOS+, or CD16+ BV2 cells under the same stimulation previously described in a. d, f Semi-quantitative analysis of Arg1+, CD206+, iNOS+, or CD16+ BV2 cells in c, e. (n = 6/group). All data are presented as means ± SEM. *P < 0.05. g Representative images of phagocytosis of pHrodo-Green-dye–labeled C. albicansin BV2 cells stained with F4/80 (red) followed the time course. (n = 6/group). Scale bar, 200 μm.
Fig. 7
Fig. 7. PN inhibited the expression of HDAC1, and suppressed NF-κB and STAT1/3 signal pathways.
a Representative western blot band showed the levels of total protein (HDAC1, p65, STAT1, STAT3, and STAT6) and phosphorylated protein for the indicated molecules (p65, STAT1, STAT3, and STAT6) in BV2 cells under LPS or IL-4 stimulation for 24 h in the presence or absence of PN (1 μM). b Semi-quantitative analysis of the levels of total protein (HDAC1, p65, STAT1, STAT3, and STAT6) and phosphorylated protein for the indicated molecules (p65, STAT1, STAT3, and STAT6) in a, which were quantified and normalized to GAPDH. (n = 4/group). All data are presented as means ± SEM. *P < 0.05.
Fig. 8
Fig. 8. PN increased the acetylation of STATs via decreasing the binding of STATs to HDAC1, and attenuated the interaction between STAT1 and p65.
a BV2 cells were subjected to LPS or IL-4 stimulation for 24 h in the presence or absence of PN (1 μM). Total cell lysates were coimmunoprecipitated with STAT1 and probed for HDAC1, p65, STAT1, and acetylated-lysine. b Total cell lysates of BV2 under the same stimulation previously described in a were coimmunoprecipitated with STAT3 and probed for HDAC1, STAT3, and acetylated-lysine. c Total cell lysates of BV2 under the same stimulation previously described in a were coimmunoprecipitated with STAT6 and probed for HDAC1, STAT6, and acetylated-Lysine. d Total cell lysates of BV2 under the same stimulation previously described in a were coimmunoprecipitated with acetylated-lysine and probed for STAT1, STAT3, and STAT6. (n = 4/group). e Schematic model showing the possible mechanism of PN shifting microglial/macrophages M1 polarization to M2 polarization after SCI. “+” or “−” stands for a promotion or inhibition effect, “×” stands for no influence.

Similar articles

Cited by

References

    1. McDonald JW, Sadowsky C. Spinal-cord injury. Lancet. 2002;359:417–425. doi: 10.1016/S0140-6736(02)07603-1. - DOI - PubMed
    1. Ahuja CS, et al. Traumatic spinal cord injury. Nat. Rev. Dis. Prim. 2017;3:17018. doi: 10.1038/nrdp.2017.18. - DOI - PubMed
    1. Zhou X, He X, Ren Y. Function of microglia and macrophages in secondary damage after spinal cord injury. Neural Regen. Res. 2014;9:1787–1795. doi: 10.4103/1673-5374.143423. - DOI - PMC - PubMed
    1. Anwar MA, Al Shehabi TS, Eid AH. Inflammogenesis of secondary spinal cord injury. Front. Cell. Neurosci. 2016;10:98. doi: 10.3389/fncel.2016.00098. - DOI - PMC - PubMed
    1. Noristani HN, et al. RNA-Seq analysis of microglia reveals time-dependent activation of specific genetic programs following spinal cord injury. Front. Mol. Neurosci. 2017;10:90. doi: 10.3389/fnmol.2017.00090. - DOI - PMC - PubMed