. 2020 Dec;52(12):1283-1293.
doi: 10.1038/s41588-020-00731-9. Epub 2020 Oct 19.

Interferons and viruses induce a novel truncated ACE2 isoform and not the full-length SARS-CoV-2 receptor

Affiliations

Interferons and viruses induce a novel truncated ACE2 isoform and not the full-length SARS-CoV-2 receptor

Olusegun O Onabajo et al. Nat Genet. 2020 Dec.

Abstract

Severe acute respiratory syndrome coronavirus 2 (SARS-CoV-2), which causes COVID-19, utilizes angiotensin-converting enzyme 2 (ACE2) for entry into target cells. ACE2 has been proposed as an interferon-stimulated gene (ISG). Thus, interferon-induced variability in ACE2 expression levels could be important for susceptibility to COVID-19 or its outcomes. Here, we report the discovery of a novel, transcriptionally independent truncated isoform of ACE2, which we designate as deltaACE2 (dACE2). We demonstrate that dACE2, but not ACE2, is an ISG. In The Cancer Genome Atlas, the expression of dACE2 was enriched in squamous tumors of the respiratory, gastrointestinal and urogenital tracts. In vitro, dACE2, which lacks 356 amino-terminal amino acids, was non-functional in binding the SARS-CoV-2 spike protein and as a carboxypeptidase. Our results suggest that the ISG-type induction of dACE2 in IFN-high conditions created by treatments, an inflammatory tumor microenvironment or viral co-infections is unlikely to increase the cellular entry of SARS-CoV-2 and promote infection.


Conflict of interest statement

Competing interests

The authors declare no competing interests.

Figures

Extended Data Fig. 1
Extended Data Fig. 1. ACE2 expression patterns in the mouse and human lung cells infected with the respiratory syncytial virus (RSV) and nasal washes from ferrets infected with SARS-CoV-2.
a, Sashimi plots of the Ace2 region in a lung RNA-seq dataset from mice mock/RSV-infected in triplicates. The expression of dAce2-Ex1c is not observed and Ace2 expression is not affected by the infection. b, Sashimi plots of the ACE2 region in H292, a human lung mucoepidermoid pulmonary carcinoma cell line. Expression of ACE2 from Ex1a and Ex1b is very low, while the dACE2 from Ex1c is expressed at baseline and is further induced by RSV infection. c, Representative IGV plots showing exon and exon-exon junction RNA-seq reads from nasal washes of mock/SARS-CoV-2-infected ferrets. The expression of dAce2-Ex1c is not observed. Note: The mouse and human/ferret ACE2/Ace2 genes are shown in opposite orientations, as presented in IGV. The positions corresponding to the human dACE2-Ex1c are marked in the mouse and ferret genomes. Datasets: PRJNA588982, PRJNA61503.
Extended Data Fig. 2
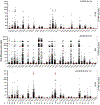
Extended Data Fig. 2. ACE2 and dACE2 expression in normal human tissues.
RNA-seq read counts for ACE2-Ex1a, ACE2-Ex1b, and dACE2-Ex1c in 27 human tissues. Dataset: PRJEB4337, n = 95.
Extended Data Fig. 3
Extended Data Fig. 3. ACE2 and dACE2 expression in tumor-adjacent normal tissues in TCGA.
Based on RNA-seq read counts, ACE2-Ex1b is detectable in multiple samples of several tissue types. dACE2-Ex1c expression is more restricted and most common in normal tissue adjacent to tumors of head and neck (HNSC), stomach (STAD), lung squamous carcinoma (LUSC), colon (COAD), and esophagus (ESCA).
Extended Data Fig. 4
Extended Data Fig. 4. ACE2 and dACE2 expression across 10,185 tumors of 33 types in TCGA.
Based on RNA-seq read counts, ACE2-Ex1b is most expressed in kidney tumors—kidney renal clear cell carcinoma (KIRC) and kidney renal papillary cell carcinoma (KIRP). Most samples expressing dACE2-Ex1c are squamous tumors of head and neck (HNSC) and the lungs (LUSC). Based on a ≥ 5 reads/sample threshold, ACE2-Ex1a is expressed in 12.6%, ACE2-Ex1b – in 38.0% and dACE2-Ex1c—in 16.8% of all tumors.
Extended Data Fig. 5
Extended Data Fig. 5. dACE2 and ACE2 expression in relation to IFNG expression in TCGA tumors and in cells treated with IFNγ.
a, Expression levels of all IFN genes annotated in TCGA tumors (n = 10,185) were acquired from cBioPortal (https://www.cbioportal.org/); expression of IFNL4 was not annotated in this dataset. At RSEM ≥ 1, only expression of IFNG is common (61% samples), with mean RSEM = 19.8 compared to other IFN genes (mean RSEM ≤ 1.3). b, and c, Pearson correlation coefficients (r) for dACE2 and ACE2 vs. IFNG expression across tumors. dACE2 showed significant positive correlations (r ≥ 0.2) with IFNG in 8 tumor types, while ACE2 showed mainly negative correlations and only one positive correlation in breast cancer (r = 0.15). Expression values for dACE2 and ACE2 were based on log2-normalized exon read counts (Ex1b and Ex1c) and for IFNG—on RSEM values. d, Treatment of cell lines with IFNγ (2 ng/ml for 24 hrs) induced expression of dACE2 but not ACE2 in T84 cells. The results are presented with means + /- SD for three biological replicates; P-values are for the unpaired, two-sided Student’s T-tests.
Extended Data Fig. 6
Extended Data Fig. 6. Unsupervised self-organizing map (SOM) analysis in TCGA-LUSC tumors.
a, Construction of the unsupervised SOM of TCGA-LUSC tumors (n = 501) based on Z-scores calculated for each of the 270 curated ISGs. Each hexagon includes a mean of 5 (range 1–14) tumors with similar ISG expression profiles. Colors denote clusters (1–6) of tumors with similar ISG expression profiles. b, Heatmap of the six SOM-defined clusters, visualized by plotting the expression levels of top 100 ISGs selected by the ranking of the initial set of 270 ISGs based on their contribution to these clusters. Cluster 5 includes 114 tumors with the highest ISG expression, whereas cluster 3 includes 72 tumors with the lowest ISG expression. c, and d, Volcano plots showing FDR-adjusted p-values and Pearson correlation coefficients (r), for two-sided tests, for expression of dACE2 and ACE2 in relation to the expression of the top 100 ISGs within cluster 5. In total, dACE2 was significantly (FDR p-value < 0.05) correlated with the expression of 20 ISGs and ACE2—with 5 ISGs.
Extended Data Fig. 7
Extended Data Fig. 7. Peptides encoded by dACE2-Ex1c are detected by protein sequencing in tumors.
a, Results of peptide query in PepQuery2 proteomics database of mass-spec data in 174 ovarian, 95 colon, and 105 breast tumors in TCGA7. Three peptides – MREAGWDK, EAGWDKGGR, and GGRILMCTK uniquely correspond to the 10 aa encoded by dACE2-Ex1c. The latter peptide results from the splicing of dACE2-Ex1c with its downstream exon. The total number of identified peptides, the number of samples with specific peptides, and corresponding parameters for a peptide-spectrum match (PSM) are shown in table format. b, Representative spectra of two peptides matching with the protein encoded by dACE2-Ex1c. M/z refers to the mass by charge ratio. The b-series and y-series ions showed the correct mapping of residues in the query aa sequence.
Extended Data Fig. 8
Extended Data Fig. 8. Transiently overexpressed ACE2-GFP and dACE2-GFP are detectable on the cell surface.
T24 cells were transiently transfected for 24 hrs with indicated constructs or not transfected (control) and then treated with (+) or without (−) biotin. Western blots with the C-terminal anti-ACE2 antibody detected a similar expression of both proteins in input lysates, but only in the biotin+ fraction after pull-down with streptavidin beads, showing much stronger expression of ACE2 compared to dACE2. GAPDH, a cytoplasmic protein, is undetectable in the pull-down fraction. The experiment was repeated three times, and representative results are shown. Source data: Unprocessed western blots for Extended Data Fig. 8.
Extended Data Fig. 9
Extended Data Fig. 9. ACE2-GFP levels are non-specifically increased in cells co-transfected with dACE2-Myc or TMEM129-Myc.
a, A representative flow cytometry plot showing gates for the T24 cells co-transfected with dACE2-Myc and ACE2-GFP, corresponding to Fig. 7d, and e. The gates were drawn to identify cells expressing dACE2-Myc, ACE2-GFP, or both proteins. b, and c, Mean fluorescence intensity (MFI) of ACE2-GFP expression in the T24 cells transiently co-transfected in triplicates with ACE2-GFP and dACE2-Myc b, or ACE2-GFP and TMEM129-Myc c, and gated as described in a. TMEM129 is a transmembrane protein, which serves as an independent control, showing that the increase in ACE2-GFP expression might be a non-specific effect due to transfection rather than due to dACE2 co-expression.
Extended Data Fig. 10
Extended Data Fig. 10. Immunofluorescence analysis of SARS-CoV-2 infection in the A549 cells.
a, and b, Quantification of dACE2 expression a, and ACE2 expression. b, in SARS-CoV-2 (MOI = 1) or mock-infected lung cancer cell line A549 transfected with GFP (used as a transient transfection control), dACE2-Myc, or stably expressing ACE2 (ACE2-stable cell line) and transfected with GFP. The results are presented with means for three biological replicates. c-h) Immunofluorescence images in cells corresponding to plots a, and b. Cells were fixed and stained 72 hours after infection—SARS-CoV-2 nuclear protein (white), nuclei—DAPI (blue). Representative images from one of three biological replicates are shown. Corresponding plots for viral load and % of infected cells are presented in Fig. 7f and g. Scale bars, 100 μM.
Fig. 1.
Fig. 1.. dACE2 is a novel truncated virally-induced isoform of ACE2.
a, UCSC genome browser view of the human ACE2 region (chrX:15,560,521–15,602,580, GRCh38/hg38) showing alternative first exons ACE2-Ex1a, ACE2-Ex1b and a novel Ex1c that creates a truncated ACE2 isoform designated as deltaACE2 (dACE2). The combination of various ENCODE epigenetic marks for human cells (H3K4me1, H3K4me3 and H3K27ac) shown as peaks and DNase I hypersensitivity sites (DHS) clusters shown as bars indicates that dACE2-Ex1c is located within a putative regulatory region that can affect gene expression. The DHS overlaying Ex1c is detected in 38 of 95 cell lines tested. b, RNA-seq Sashimi plots depict splicing patterns defining ACE2 and dACE2 isoforms in SeV/mock-infected T47D cells and uninfected RT-4 cells. The numbers on the Sashimi plots indicate the counts of exon-exon splicing reads. c, ACE2 is a single-span transmembrane protein with a signal peptide (SigP) of 17 aa and four functional domains – peptidase domain (PD, aa 18–615), collectrin-like domain (CLD, aa 616–740), transmembrane domain (TM, aa 741–761), and intracellular domain (ICD, aa 762–805). In dACE2, the signal peptide is not predicted; the peptidase domain starts from aa R357; the first 356 aa are replaced by 10 aa of a unique protein sequence; * and ** - cleavage sites of membrane-bound proteases ADAM17 and TMPRSS2, respectively. d, and e) Sequence alignments of the 5’UTR and protein sequences encoded by dACE2-Ex1c and part of the downstream exon in select primates. dACE2 is not predicted to be encoded in any non-primate species. Additional alignment analyses are shown in Supplementary Fig. 1a, b.
Fig. 2.
Fig. 2.. Evaluation of ACE2 and dACE2 promoters.
a, Promoters of ACE2 (P1 and P2) and dACE2 (P3) were analyzed for binding motifs of transcription factors relevant for IFN signaling. Promoters were defined within the −800/+100 bp windows from the corresponding transcription start sites (TSS). b, Schematics of Luciferase (Luc) reporter constructs. c, Luciferase activity in HepG2 cells transiently co-transfected with indicated Luciferase reporter constructs and Renilla (normalization control) and treated with 1 ng/ml of IFNβ or 2 ng/ml of IFNγ for 6 hrs. d, Luciferase activity driven by the promoter of IFIT1 (an ISG and positive control). Luciferase/Renilla ratios were normalized by corresponding mock-treated samples and presented as fold change to the negative control (empty promoterless pGL4.21 vector). P-values are for unpaired, two-sided Student’s T-tests. The experiment was conducted in 6 biological replicates per construct, and the results of one of three independent experiments are shown.
Fig. 3.
Fig. 3.. dACE2 is induced by IFNs in vitro.
a, Schematic representation of ACE2 and dACE2 transcripts and the position of the forward (F) and reverse (R) PCR primers to generate full-length dACE2 amplicons. b, Agarose gel showing an RT-PCR product of 1535 bp corresponding to full-length dACE2 in several cell lines with/without SeV infection. c, Heatmap of ACE2 and dACE2 expression and a positive control ISG (ISG15) measured by TaqMan expression assays in human cell lines infected with SeV for 12 hrs; colors represent expression differences as ddCt (log2) normalized by endogenous controls (GAPDH and ACTB) and comparing SeV-infected to uninfected samples. d, Expression of ACE2 and dACE2 and a positive control ISG MX1 in primary normal human bronchial epithelial (NHBE) cells from 5 healthy donors; NHBEs were untreated or treated with IFNα or IFNλ3 for 24 hrs. Data is presented as means and SD. P-values are for the paired Student’s T-tests. e, Expression of ACE2 and dACE2 and a positive control ISG IFIT1 in colon and ileum organoid cultures from one donor; the organoids were treated with IFNβ or a cocktail of IFNλ1–3 for 24 hrs in 3 biological replicates. The results are presented with means and SD; P-values are for the unpaired, two-sided Student’s T-tests. Full expression results are presented in Supplementary Table 2B–C.
Fig. 4.
Fig. 4.. dACE2 is induced in virally-infected human respiratory cells.
Expression patterns of ACE2, represented by Ex1a and Ex1b and dACE2, represented by Ex1c in a-c) uninfected and rhinovirus (RV)-infected human nasal epithelial cells and d-e) in uninfected and influenza H3N2-infected cells from human lung explants. a, RNA-seq Sashimi plots. b, and d, First exon-specific expression levels of ACE2 and dACE2 are presented by box-and-whisker plots as: mean (+), median (center line); box (25th to 75th interquartile range), whiskers (5–90 percentile range) and outliers (individual data points). FC – fold change compared to mock. P-values are for the non-parametric, two-sided Wilcoxon matched-pairs signed rank test. c, and e, Pearson correlation coefficients with p-values for two-sided tests for exon-specific expression levels of ACE2 and dACE2 with select ISGs and IFNs in the full datasets.
Fig. 5.
Fig. 5.. dACE2 expression is enriched in squamous epithelial tumors.
a, Bubble plot showing mean expression levels (RNA-seq read counts) and proportions of samples with dACE2-Ex1c in TCGA tumor-adjacent normal (AN) tissues and 33 tumor types. dACE2-Ex1c is expressed at relatively high levels and in many tumors of the bladder (BLCA), cervix (CESC), esophagus (ESCA), head and neck (HNSC), and lung squamous carcinoma (LUSC). b, RNA-seq counts of ACE2-Ex1a, ACE2-Ex1b and dACE2-Ex1c in tumor-adjacent normal (AN), squamous tumors (SQ) and non-squamous tumors (NSQ). The dACE2 expression is significantly higher in SQ compared to NSQ tumors of the same tissue origin and corresponding AN tissues. Specifically – dACE2-Ex1c is expressed similarly in AN tissues adjacent to LUSC and LUAD, while it is significantly higher in corresponding tumors and higher in LUSC than in LUAD, due to the clonal origin of these tumors from cells with differential expression of dACE2. The box-and-whisker plots represent mean (+), median (center line); box (25th to 75th interquartile range), whiskers (5–90 percentile range) and outliers (individual data points). P-values are for the non-parametric, two-sided Mann–Whitney U test.
Fig. 6.
Fig. 6.. dACE2 is induced by SARS-CoV-2 in human cell lines and organoid cultures.
Expression of ACE2, dACE2 and a control ISG IFIT1 in a, colon cancer cell lines Caco2 and T84 and a lung cancer cell line Calu3 (all in 3–4 biological replicates) and c, colon and ileum organoid cultures from 3 donors; b, and d, SARS-CoV-2 viral loads in corresponding cells. P-values are for the two-sided Student’s T-tests, unpaired tests for cell lines and paired tests for organoids. The results are presented with means and SD.
Fig. 7.
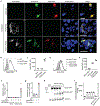
Fig. 7.. dACE2 is non-functional for binding SARS-CoV-2 spike protein RBD and as a carboxypeptidase.
a, Representative confocal images of T24 cells transiently overexpressing dACE2-Myc (white), ACE2-GFP (green) and treated with receptor-binding domain (RBD) of SARS-CoV-2 spike protein (red), nuclei (DAPI)-blue; bars=20μM. b-d) Representative flow cytometry histogram b, and mean fluorescence intensity (MFI) values from 3 biological replicates c, of spike-RBD binding to the surface of ACE2-GFP but not dACE2-Myc expressing T24 cells. Gating for cells expressing dACE2-Myc, ACE2-GFP, or both proteins, is shown in Extended Data Fig. 9a. e, plot depicting MFI of spike protein-RBD binding. The results are based on 3 biological replicates, shown one of two independent experiments. f, SARS-CoV-2 infectivity rates (%) in a lung cancer cell line A549 transfected with GFP, or dACE2-Myc, or stably expressing ACE2 (ACE2-stable) and transfected with GFP. g, SARS-CoV-2 viral load as ddCt values compared to mock, corresponding to plot f. Additional details are provided in Extended Data Fig. 10. h, A representative Western blot with an anti-ACE2 antibody that detects both recombinant ACE2-GFP and dACE2-GFP overexpressed in T24 cells. The amount of the ACE2-GFP lysate was kept constant, while the amount of dACE2-GFP cell lysate was increased and the difference in the lysate volume was compensated by the empty GFP vector. i, Results of carboxypeptidase assays using variable amounts lysates of cells (as described in plot H, showing that the activity of ACE2 is not affected by increasing amounts of dACE2. The results are based on 3 biological replicates and presented with means and SD. WB is showing the results of one representative replicate.

Update of

Similar articles

Cited by

References

    1. Hoffmann M et al. SARS-CoV-2 Cell Entry Depends on ACE2 and TMPRSS2 and Is Blocked by a Clinically Proven Protease Inhibitor. Cell 181, 271–280 e8 (2020). - PMC - PubMed
    1. Li W et al. Angiotensin-converting enzyme 2 is a functional receptor for the SARS coronavirus. Nature 426, 450–4 (2003). - PMC - PubMed
    1. Lukassen S et al. SARS-CoV-2 receptor ACE2 and TMPRSS2 are primarily expressed in bronchial transient secretory cells. EMBO J 39, e105114 (2020). - PMC - PubMed
    1. Ziegler CGK et al. SARS-CoV-2 Receptor ACE2 Is an Interferon-Stimulated Gene in Human Airway Epithelial Cells and Is Detected in Specific Cell Subsets across Tissues. Cell 181, 1016–1035 e19 (2020). - PMC - PubMed
    1. Chua RL et al. COVID-19 severity correlates with airway epithelium-immune cell interactions identified by single-cell analysis. Nat Biotechnol (2020). - PubMed

Publication types

MeSH terms