. 2020 Oct 1;105(10):2440-2447.
doi: 10.3324/haematol.2018.215210.

ATR addiction in multiple myeloma: synthetic lethal approaches exploiting established therapies

Affiliations

ATR addiction in multiple myeloma: synthetic lethal approaches exploiting established therapies

Oronza A Botrugno et al. Haematologica. .

Abstract

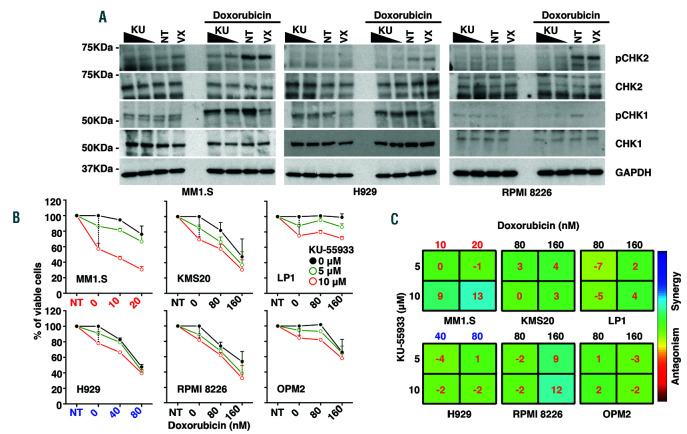
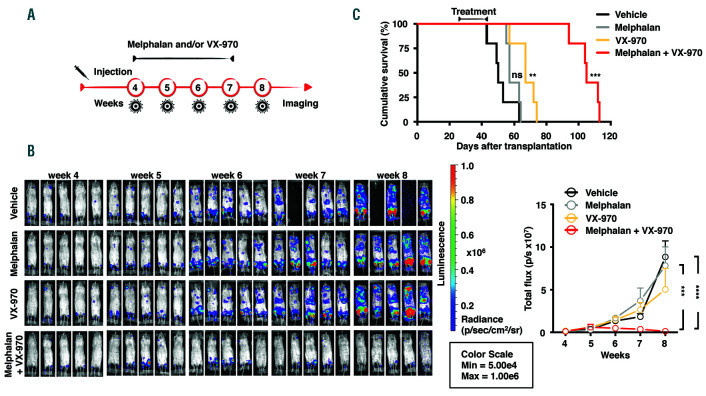
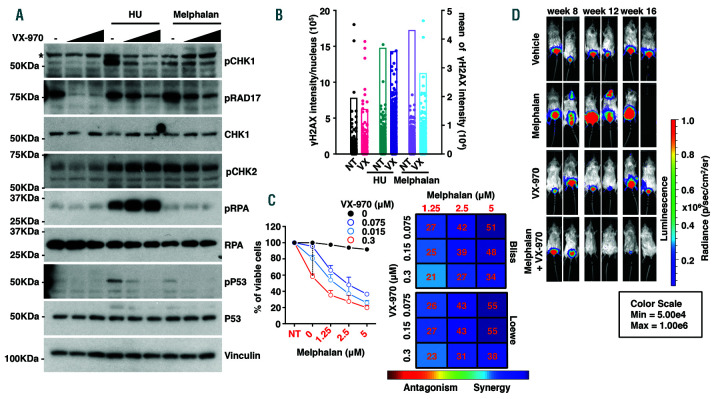
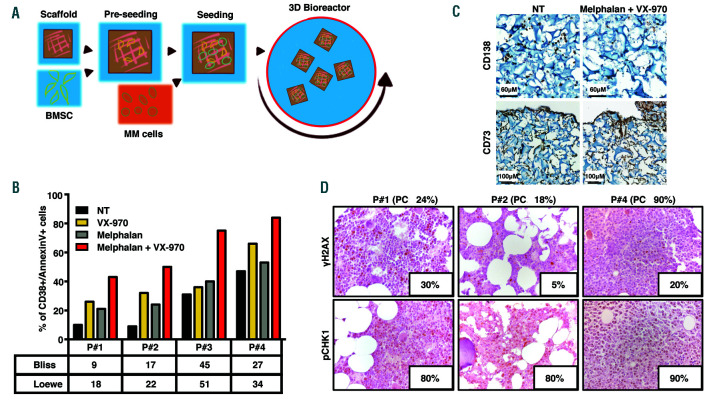
Therapeutic strategies designed to tinker with cancer cell DNA damage response have led to the widespread use of PARP inhibitors for BRCA1/2-mutated cancers. In the haematological cancer multiple myeloma, we sought to identify analogous synthetic lethality mechanisms that could be leveraged upon established cancer treatments. The combination of ATR inhibition using the compound VX-970 with a drug eliciting interstrand cross-links, melphalan, was tested in in vitro, ex vivo, and most notably in vivo models. Cell proliferation, induction of apoptosis, tumor growth and animal survival were assessed. The combination of ATM inhibition with a drug triggering double strand breaks, doxorucibin, was also probed. We found that ATR inhibition is strongly synergistic with melphalan, even in resistant cells. The combination was dramatically effective in targeting myeloma primary patient cells and cell lines reducing cell proliferation and inducing apoptosis. The combination therapy significantly reduced tumor burden and prolonged survival in animal models. Conversely, ATM inhibition only marginally impacted on myeloma cell survival, even in combination with doxorucibin at high doses. These results indicate that myeloma cells extensively rely on ATR, but not on ATM, for DNA repair. Our findings posit that adding an ATR inhibitor such as VX-970 to established therapeutic regimens may provide a remarkably broad benefit to myeloma patients.


Figures

Figure 1.
Figure 1.
VX-970 selectively attenuates ATR-CHK1 signaling axis elicited by DNA damaging agents in multiple myeloma cells. Exponentially growing MM1.S, H929, KMS20 and OPM2 cells were either left untreated (NT) or treated with increasing concentrations of VX-970 (0.15 and 0.3 µM). Treatment with VX-970 was initiated 1 hour (h) before the addition of hydroxyurea (HU, 2 mM) or melphalan (50 μM). After 3 h cells were harvested and analyzed by immunoblotting for the expression of the indicated proteins. Vinculin for MM1.S and GAPDH for the other cell lines, were used as loading controls. The asterisks indicate unspecific bands.
Figure 2.
Figure 2.
ATR inhibition by VX-970 sensitizes multiple myeloma cells to melphalan. (A) Multiple myeloma (MM) cells were seeded in 96-well plates and treated for 72 hours (h) with DMSO (as a control, untreated [NT]) or increasing concentrations of VX-970 either alone or in combination with the indicated doses of melphalan. Cell viability was assessed using CellTiter-Glo assay. Results are presented as the mean percentage of viable cells in treated samples, relative to DMSO control cells averaged from a minimum of three independent experiments (mean ± standard error of the mean [SEM]), each with three repetitions per condition. Proliferation curves for each cell line were generated using GraphPad Prism. The dotted vertical line indicates the response of MM cells to increasing concentrations of VX-970 alone. Filled black dots indicate the cellular response to melphalan alone. Results of the statistical analysis are reported in the Online Supplementary Table S2. We could not rule out the potential appearance of general toxicity at the highest concentrations used. (B) For each cell line the Bliss synergy matrices and the relative drug synergy scores were calculated using the Combenefit software. The colored areas in the matrix are indicative of the degree of synergy between the drug combinations. (A-B) Different color codes (black, blue and red) are indicative of the concentrations of melphalan used to treat the cells depending on their sensitivity to the drug. (C) MM1.S and H929-melphalan sensitive and OPM2-melphalan resistant cell lines were treated with the indicated concentrations of melphalan either alone or in combination with increasing concentrations of VX-970 (0.075, 0.15 and 0.3 µM). After 48 h, cells were harvested, and immunoblotted for the indicated antibodies. The levels of cleaved PARP and caspase-3 served as indicators of apoptosis. GAPDH was used as loading control.
Figure 3.
Figure 3.
ATM inhibition by KU-55033 alone or in combination with doxorubicin does not restrain proliferation in multiple myeloma cells. (A) Exponentially growing MM1.S, H929 and RPMI 8226 cells were either left untreated (NT) or treated with increasing concentrations of KU-55933 (KU, 5 and 10 µM) and VX-970 (VX, 0.15 µM). Treatment with both compounds initiated 1 hour (h) before the addition of doxorubicin (0.5 μM). After 3 h, cells were harvested and and the expression of the indicated proteins was analysed by immunoblotting. GAPDH was used as loading control. (B) MM cells were seeded in 96-well plates and treated for 72 h with DMSO (as a control, NT) or increasing concentrations of KU-55933 either alone or in combination with the indicated doses of doxorubicin. Cell viability was assessed using CellTiter-Glo assay. Results are presented as the mean percentage of viable cells in treated samples, relative to DMSO control cells averaged from a minimum of three independent experiments (standard error of the mean (SEM), each with three repetitions per condition. Proliferation curves for each cell line were generated using GraphPad Prism. The dotted vertical line indicates the response of MM cells to increasing concentrations of KU-55933 alone. Filled black dots indicate the cellular response to doxorubicin alone. Results of statistical analysis are reported in the Online Supplementary Table S3. (C) For each cell line the Bliss synergy matrices and the relative drug synergy scores were calculated using the Combenefit software. The colored areas in the matrix are indicative of the degree of synergy between the drug combinations. (B-C) Different color codes (red, blue and black) are indicative of the concentrations of doxorubicin used to treat the cells depending on their sensitivity to the drug.
Figure 4.
Figure 4.
VX-970 is effective as monotherapy and enhances the therapeutic efficacy of melphalan in an orthothopic mouse model of multiple myeloma. (A) Rag2−/−γc−/− mice were injected intravenously with 5x10⁶ MM1.S-Luc cells. The treatment started 4 weeks after injection, when the tumor burden became evident by bioluminescent imaging (BLI) (week 4). Mice were randomized into four treatment groups of five animals each: vehicle controls, melphalan 2 mg/kg, VX-970 60 mg/kg, or both. (B) BLI was performed every week during treatment (week 5, week 6 and week 7) to monitor tumor burden and one week after the stop of the treatment (week 8). On the left, representative IVIS SpectrumCT System images of the luciferase signals observed in mice of each treatment group taken at the indicated interval are shown. On the right, the graph shows the tumor burden increase quantified as total flux measured from bioluminescent images during the treatment period. Data represent the mean ± standard deviation (SD) of five mice in each treatment arm. Statistical analysis was performed by the two-way ANOVA and Tukey’s multiple comparison test (***P<0.0005, ****P<0.001). (C) Cumulative survival in each treatment arm was compared by Kaplan-Meier survival analysis. Statistical analysis was performed by log rank Mantel-Cox test (**P<0.01, ***P<0.001).
Figure 5.
Figure 5.
ATR inhibition by VX-970 sensitizes U266 cells to melphalan. (A) Exponentially growing U266 cells were either left untreated or treated with the indicated concentrations of VX-970. Treatment with VX-970 initiated 1 hour (h) before the addition of hydroyurea (HU, 2 mM) or melphalan (50 µM). After 3 h cells were harvested and analyzed by immunoblotting for the expression of the indicated proteins. Vinculin was used as a loading control. The asterisk indicates an unspecific band. (B) As in (A), cells were left untreated (NT) or treated with 0.15 µM VX-970 (VX) before the addition of HU (2 mM) or melphalan (50 µM) for 3 h. At the end of the treatment, cells were fixed and processed for imaging flow cytometry to detect the γH2AX signal for individual nucleus (left Y axis). The mean of γH2AX signal (right Y axis) for each treatment is reported. Results are representative of two independent experiments. (C) Cells were seeded in 96-well plates and treated for 72 h with DMSO (as a control, NT) or increasing concentrations of VX-970 either alone or in combination with the indicated doses of melphalan. Cell viability was assessed using CellTiter-Glo assay. Results are presented as the mean percentage of viable cells in treated samples, relative to DMSO control cells averaged from a minimum of three independent experiments (mean ± standard error of the mean [SEM]) each with three repetitions per condition. Proliferation curves on the left were generated using GraphPad Prism. The dotted vertical line indicates the response of the cells to increasing concentrations of VX-970 alone. Filled black dots indicate the cellular response to melphalan alone. The Bliss and the Loewe synergy matrices and the relative drug synergy scores calculated using the Combenefit software are reported on the right of the proliferation profile. The colored areas in the matrix are indicative of the degree of synergy between the drug combinations. Results of statistical analysis are reported in the Online Supplementary Table S2. (D) Rag2−/−γc−/− mice were injected intravenously with 5x10⁶ U266-Luc cells. The treatment started 8 weeks after injection, when the tumor burden became evident by BLI (week 8). Mice were randomized into four treatment groups of five animals each: vehicle controls, melphalan 2 mg/kg, VX-970 60 mg/Kg, or both. Treatments were scheduled as reported in the Online Supplementary Figure S10A. BLI was performed every week during the treatment to monitor the tumor burden. Representative IVIS SpectrumCT System images of the luciferase signals observed in mice of the treatment groups taken before beginning of the treatment (week 8) and 1 and 5 weeks after the stop of the treatment (week 12 and week 16).
Figure 6.
Figure 6.
ATR inhibition by VX-970 synergizes with melphalan in inducing apoptosis in multiple myeloma patient cells independently of the level of DNA damage. (A) Schematic representation of the experimental procedure in the 3D bioreactor. (B-C) CD138+ primary cells from multiple myeloma (MM) patients were seeded in gelatin scaffolds pre-seeded with CD73+ bone marrow stromal cells (BMSC) and cultured in the 3D bioreactor system either in untreated conditions (NT) or in the presence of VX-970 (0.3 µM), melphalan (1.2 µM), or a combination of both drugs. (B) Seventy-two hours after the beginning of the treatment, cells retrieved from scaffolds were stained with Annexin V and anti-CD38 antibody before flow cytometric (FACS) analysis. The table underneath the graph summarizes the Bliss and Loewe synergy scores calculated for the combined treatments in each patient. Due to the limited number of cells that could be recovered from MM patient bone marrow (BM) samples, it was possible to assay just one concentration for each drug, in each patient. (C) Representative immunohistochemical (IHC) analyses performed on scaffolds populated with primary MM cells and retrieved at the end of the culture period, showing the distribution of CD138+ MM and CD73+ BMSC cells and the effect of the co-treatment specifically on MM cells. (D) Representative IHC images form the BM biopsies of MM patients analyzed for γH2AX and pCHK1 expression (original magnification 40X; samples presented are the same used for experiment in (B)). The inset in each panel indicates the percentage of tumor cells positive for the indicated marker. The percentage of neoplastic plasma cells (PC) is shown above each panel.

Similar articles

Cited by

References

    1. Puigvert JC, Sanjiv K, Helleday T. Targeting DNA repair, DNA metabolism and replication stress as anti-cancer strategies. FEBS J. 2016; 283(2):232-245. - PubMed
    1. Iglehart JD, Silver DP. Synthetic lethality - a new direction in cancer-drug development. N Engl J Med. 2009; 361(2):189-191. - PubMed
    1. Kaelin WG. The concept of synthetic lethality in the context of anticancer therapy. Nat Rev Cancer. 2005;5(9):689-698. - PubMed
    1. Fu D, Calvo JA, Samson LD. Balancing repair and tolerance of DNA damage caused by alkylating agents. Nat Rev Cancer. 2012;12(2):104-120. - PMC - PubMed
    1. Bryant HE, Schultz N, Thomas HD, et al. . Specific killing of BRCA2-deficient tumours with inhibitors of poly (ADPribose) polymerase. Nature. 2005; 434(7035):913-917. - PubMed

Publication types

Grants and funding

Funding Funding for this research was provided by Associazione Italiana per la Ricerca sul Cancro (AIRC; Investigator Grants and Special Program Molecular Clinical Oncology, 5 per mille no. 9965 to GT).