. 2021 Jan 4;218(1):e20201414.
doi: 10.1084/jem.20201414.

SHP2 inhibition diminishes KRASG12C cycling and promotes tumor microenvironment remodeling

Affiliations

SHP2 inhibition diminishes KRASG12C cycling and promotes tumor microenvironment remodeling

Carmine Fedele et al. J Exp Med. .

Abstract

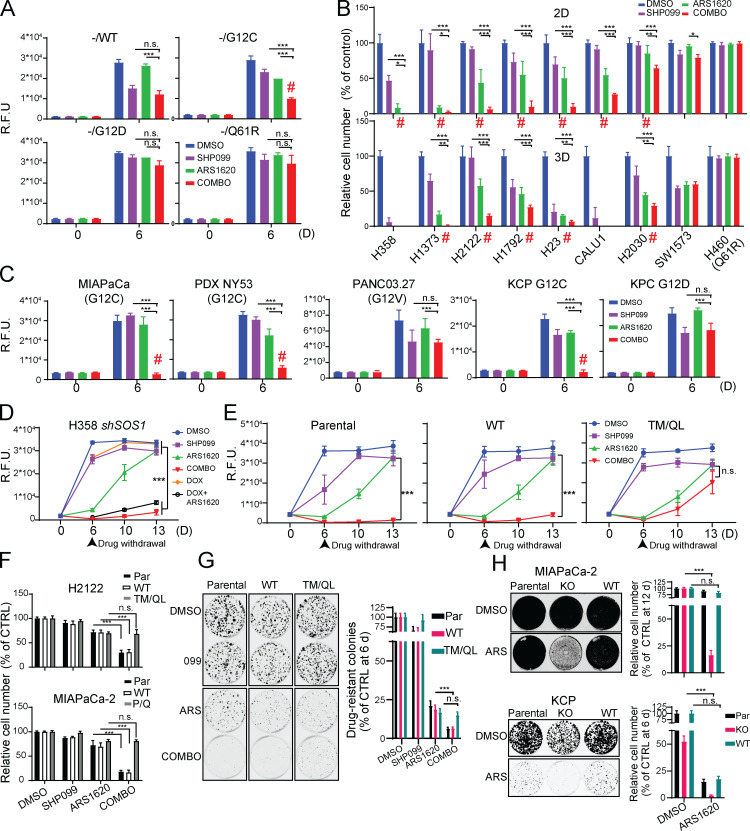
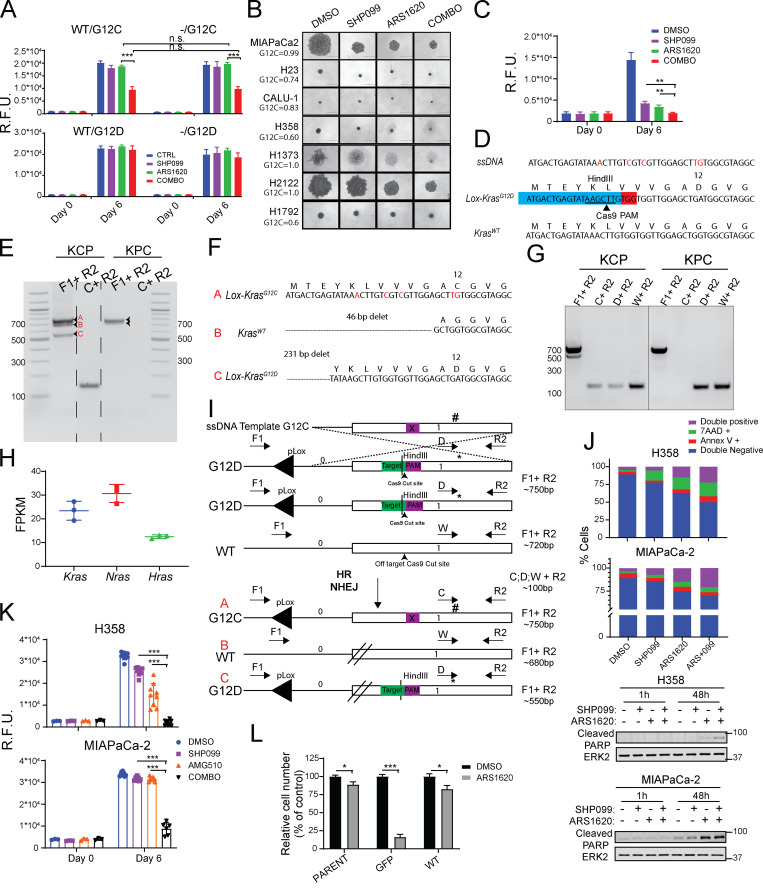
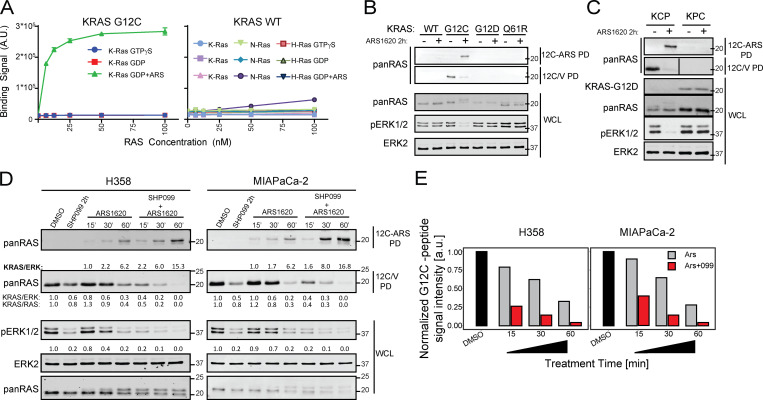
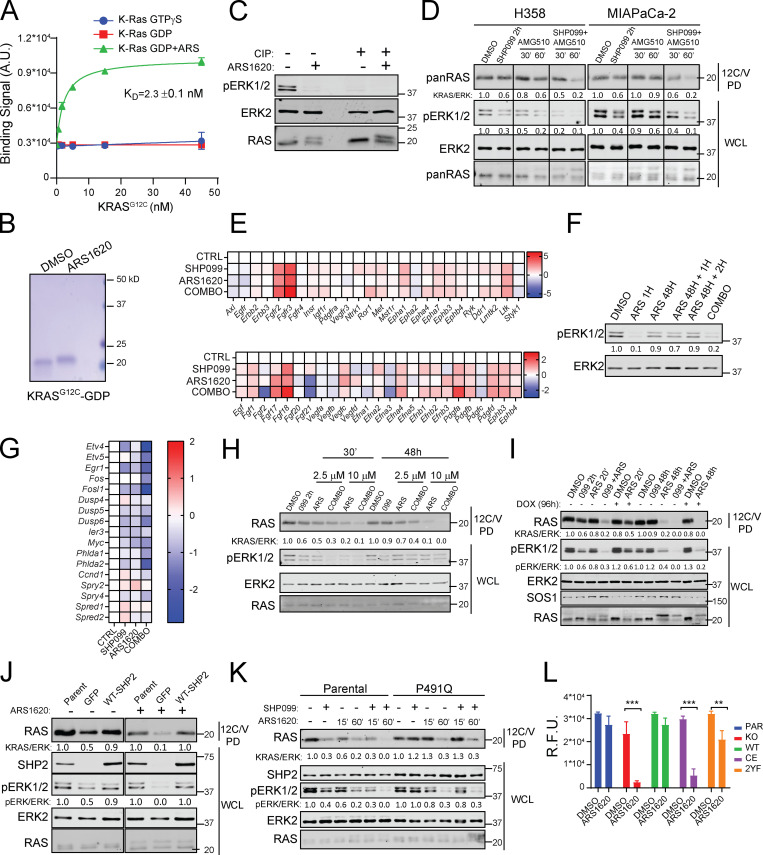
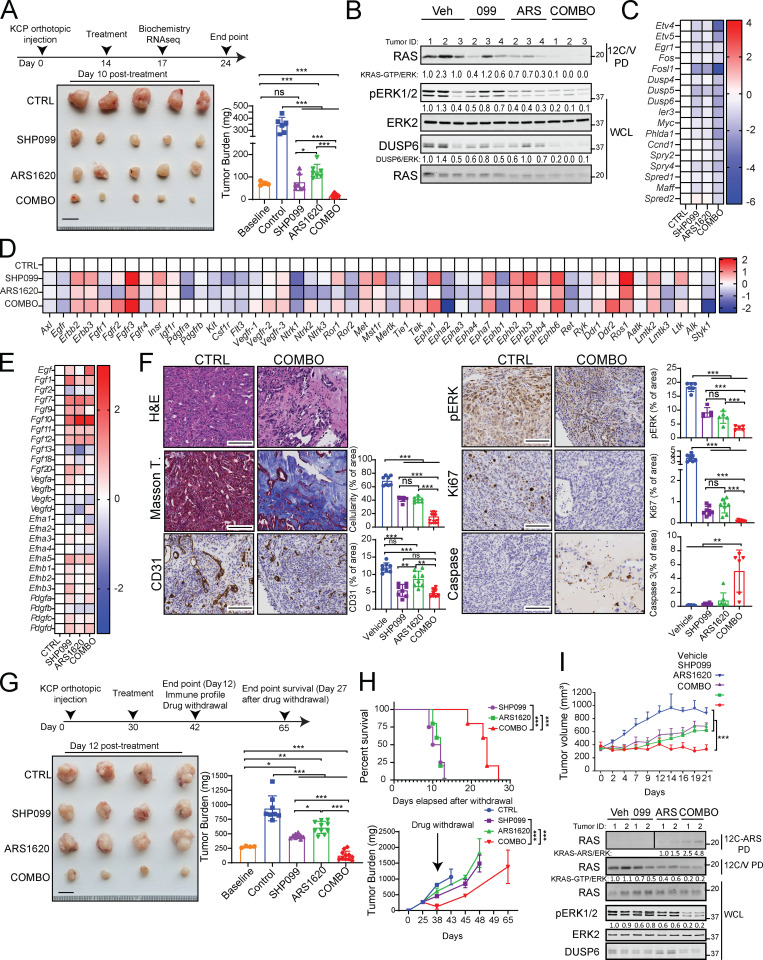
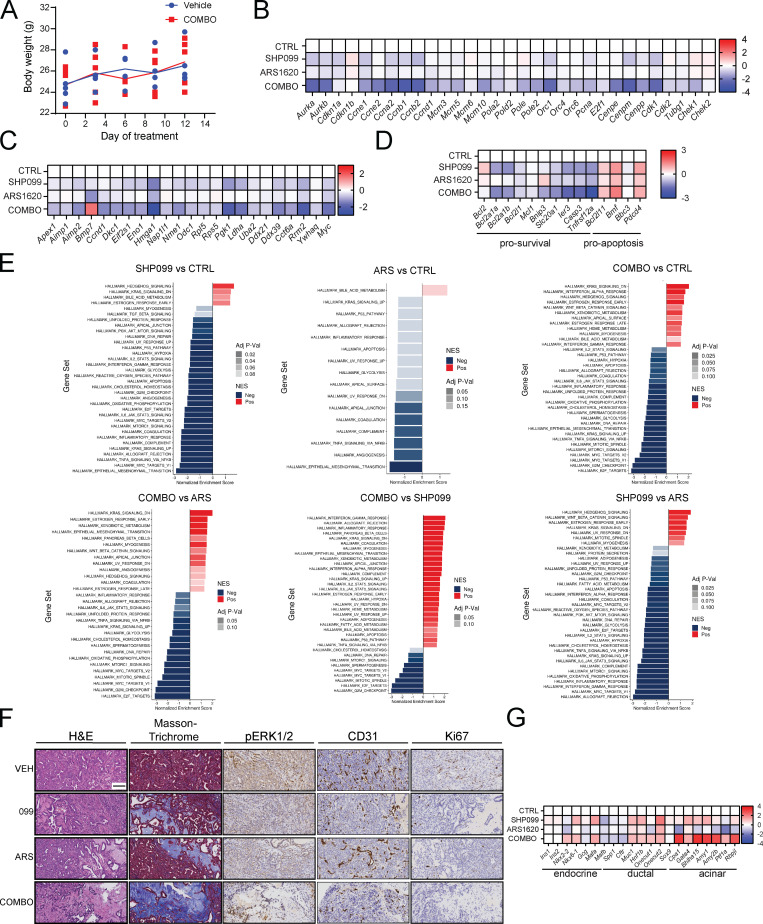
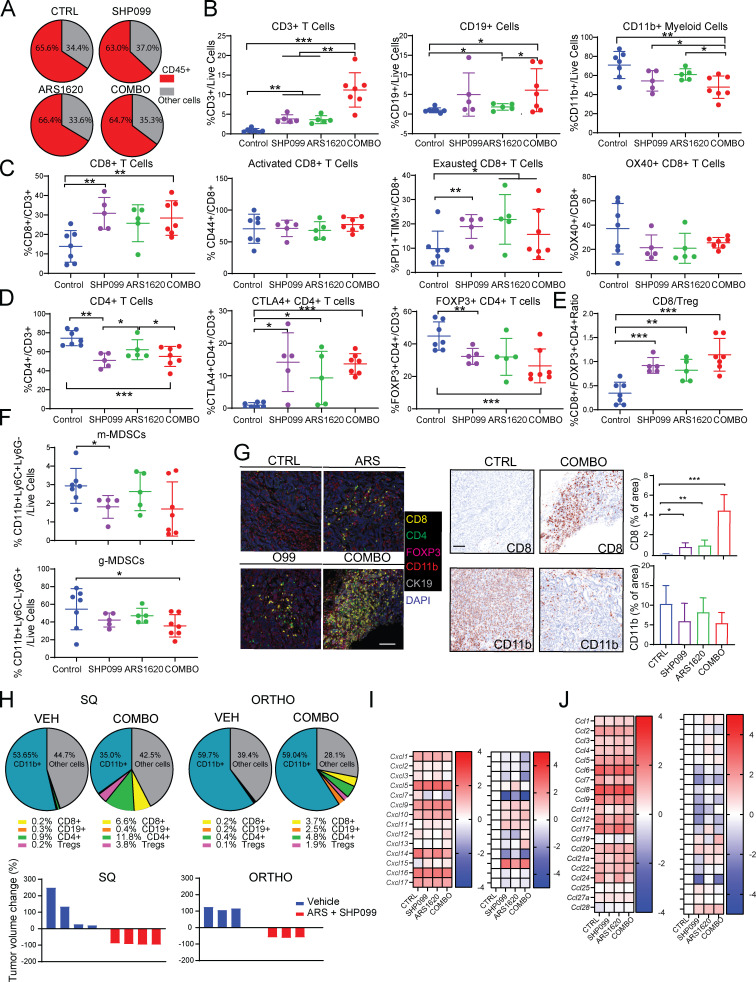
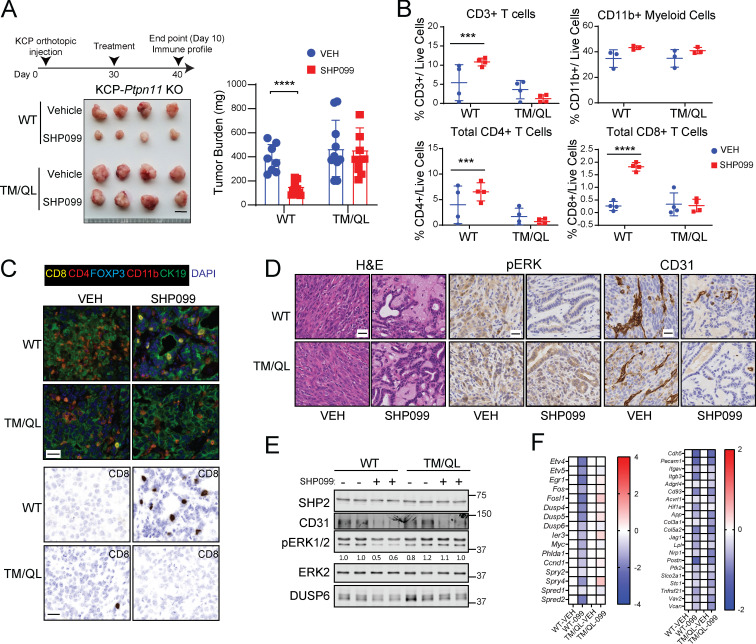
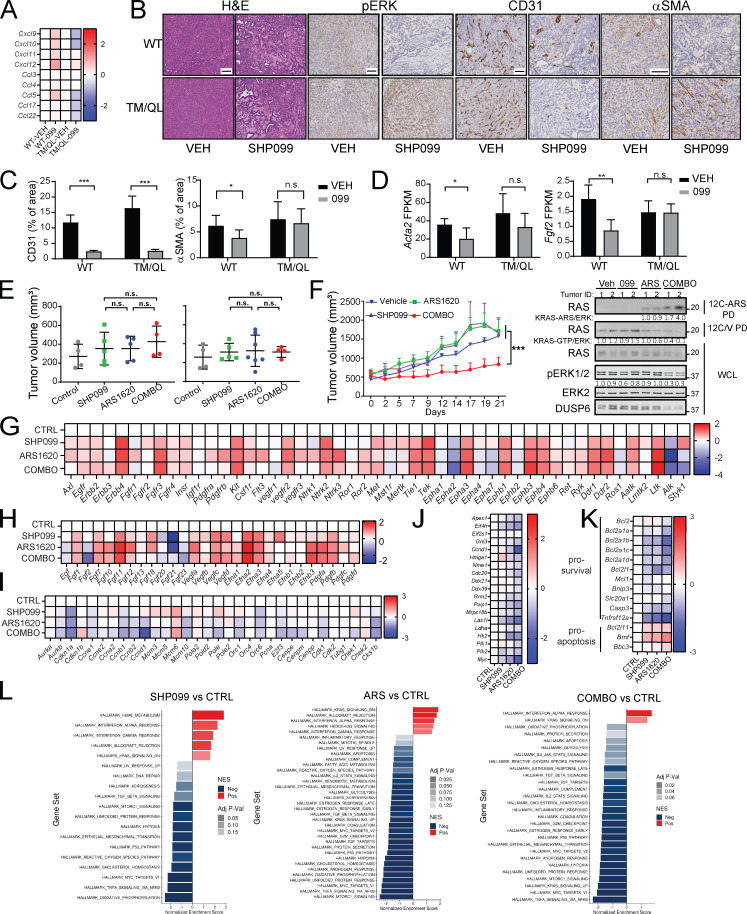
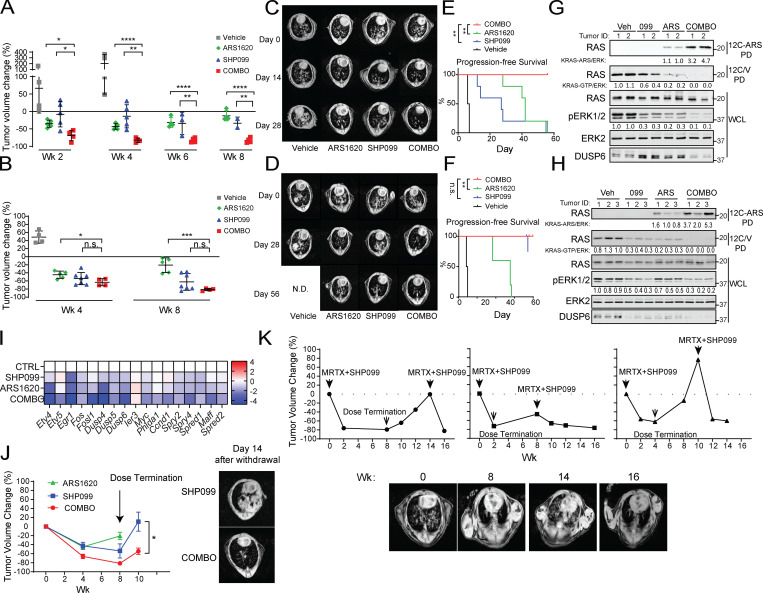
KRAS is the most frequently mutated human oncogene, and KRAS inhibition has been a longtime goal. Recently, inhibitors were developed that bind KRASG12C-GDP and react with Cys-12 (G12C-Is). Using new affinity reagents to monitor KRASG12C activation and inhibitor engagement, we found that an SHP2 inhibitor (SHP2-I) increases KRAS-GDP occupancy, enhancing G12C-I efficacy. The SHP2-I abrogated RTK feedback signaling and adaptive resistance to G12C-Is in vitro, in xenografts, and in syngeneic KRASG12C-mutant pancreatic ductal adenocarcinoma (PDAC) and non-small cell lung cancer (NSCLC). SHP2-I/G12C-I combination evoked favorable but tumor site-specific changes in the immune microenvironment, decreasing myeloid suppressor cells, increasing CD8+ T cells, and sensitizing tumors to PD-1 blockade. Experiments using cells expressing inhibitor-resistant SHP2 showed that SHP2 inhibition in PDAC cells is required for PDAC regression and remodeling of the immune microenvironment but revealed direct inhibitory effects on tumor angiogenesis and vascularity. Our results demonstrate that SHP2-I/G12C-I combinations confer a substantial survival benefit in PDAC and NSCLC and identify additional potential combination strategies.


Conflict of interest statement

Disclosures: C.J.R. Foster reported grants from the National Institutes of Health during the conduct of the study. K-K. Wong reported "other" from G1 Therapeutics, Zentalis Therapeutics, and Epiphanes Therapeutics outside the submitted work, and has consulting/sponsored research agreements with the following: AstraZeneca, Janssen, Pfizer, Novartis, Merck, Ono, and Array (consulting and sponsored research); MedImmune, Mirati (which developed MRTX 1257), Takeda, TargImmune, and BMS (sponsored research only). B.G. Neel reported "other" from Navire Pharma, Northern Biologics, Ltd, Arvinas, Inc, Regeneron, Amgen, Inc, Mirati Therapeutics, Gilead Therapeutics, and Moderna outside the submitted work. In addition, B.G. Neel has a patent to PCT 63031457 pending. No other disclosures were reported.

Figures

Figure 1.
Figure 1.
SHP2 inhibition enhances KRASG12C inhibitor effects in PDAC and NSCLC cell lines. (A–C) Reconstituted RAS-less MEF (A), human NSCLC (B), and human or mouse PDAC (C) cell lines were treated as indicated (key at upper right). Cell viability was assessed at 6 d by PrestoBlue assay. (D) Cell viability assays on H358 NSCLC cells expressing DOX-inducible shSOS1 (shSOS), treated as indicated. Drugs were withdrawn after 6 d (arrowhead), and regrowth was quantified. (E) Cell viability assays on H358 NSCLC cells expressing SHP099-resistant PTPN11 mutant (T253M/Q257L) or WT PTPN11 (WT), treated as indicated. Drugs were withdrawn after 6 d (arrowhead), and regrowth was quantified. (F) PrestoBlue assays of H2122 and MIAPaCa-2 cells expressing SHP099-resistant PTPN11 (T253M/Q257L or P491Q respectively) or WT PTPN11 (WT) after 6-d treatment. CTRL, control; PAR, parental. (G) Colony assays (6 d) on KCP cells expressing TM/QL or WT PTPN11 (WT). (H) Colony assays on PTPN11-KO or WT-PTPN11-reconstituted MIAPaCa-2 (12 d, top) or KCP (6 d, bottom) cells. Representative results are shown from a minimum of three biological replicates per condition each with triplicate determinations for each value. Drug doses were SHP099 10 µM, ARS 10 µM, COMBO = SHP099 10 µM + ARS 10 µM. Data represent mean ± SD; *, P < 0.05; **, P < 0.01; ***, P < 0.001; one-way ANOVA followed by Tukey’s multiple comparison test. Red # symbols indicate synergy of by Bliss independent analysis. n.s., not significant; R.F.U., relative fluorescence units.
Figure S1.
Figure S1.
SHP2 inhibition enhances KRASG12C-inhibitor effects in PDAC and NSCLC cell lines. (A) Cell viability was assessed by PrestoBlue assay at 6 d in Kraswt/KRASG12C and Kras−/−/KRASG12C MEFs. (B) Micrographs of spheroid cultures of KRASG12C-expressing cells treated as indicated for 6 d. Numbers at left indicate KRASG12C allele fraction. Scale bars, 1,000 µm. (C) Cell viability, assessed by PrestoBlue assay, at 0 and 6 d of MIAPaCa-2 spheroid cultures. (D) Schematic showing strategy used to generate the Lox-KrasG12C allele from the pancreatic KCP 1203 cells, which carry a Lox-KrasG12D allele and a pancreas-specific Cre. KCP 1203 cells were cotransfected with a vector expressing Cas9 and a Kras-targeted sgRNA, together with a ssODN template bearing the new mutation. (E) PCR products using F1 + R2 primers to discriminate between mutant Kras (∼750 bp) and WT-Kras (∼720 bp) and C1 + R2 to detect the presence of the new G12C mutation in the KCP (G12C) clone, compared with parental KPC 1203 (G12D) cells. Primer forward F1 flanks the Lox region in intron 0, primer reverse R2 anneals the end of exon 1, and forward C1 specifically anneals on exon 1 in the presence of the new generated G12C mutation. (F) Sanger sequencing of TOPO-cloned PCR products (A–C in red) from E. (G) Allele-specific PCR using forward primers WT (W), G12D (D), and G12C (C) and reverse R2 in KCP G12C clone and parental KPC 1203 (G12D) cells. (H) Fragments per kilobase of exon per million reads mapped (FPKM) for Kras alleles in KCP cells. (I) Summary of genetic events that generated the new Lox-KrasG12C allele starting from parental KCP 1203 cells. (J) Cell death after 48 h of drug treatment, quantified by flow cytometry and Annexin V/7AAD staining (top), and immunoblot for cleaved PARP in lysates from MIAPaCa-2 and H358 cells, treated as indicated (bottom). (K) Viability of MIAPaCa-2 and H358 cells, assessed by PrestoBlue assay, after 6 d of treatment with DMSO, SHP099, AMG510 (0.1 µM) or COMBO. (L) PrestoBlue assays (6 d) on parental MIAPaCa-2 cells and PTPN11-KO MIAPaCa-2 cells reconstituted with GFP or WT PTPN11 (WT). For all experiments, drug doses were SHP099 10 µM, ARS 10 µM, and AMG510 0.1 µM. Data represent mean ± SD; *, P < 0.05; **, P < 0.01; ***, P < 0.001; one-way ANOVA with Tukey’s multiple comparison test. Data represent average of at least three biological replicates with triplicate determinations of each point in each replicate. n.s., not significant; HR, homologous recombination; NHEJ, non-homologous end joining; R.F.U., relative fluorescence units.
Figure 2.
Figure 2.
SHP099 increases KRASG12C-ARS adducts. (A) 12C-ARS Fab binding to KRASG12C (left) or WT RAS isoforms (right) with/without ARS and GTPγS or GDP. (B and C) Immunoblots of cell lysates and 12C/V MB- or 12C-ARS Fab PDs from RAS-less MEFs reconstituted with the indicated mutants (B) and KCP cells (C), treated as indicated. (D) Immunoblots of cell lysates and 12C/V MB- or 12C-ARS Fab PDs from H358 and MIAPaCa-2 cells, treated as indicated. (E) ARS-adduct formation in samples from C, quantified by LC-MS/MS. ARS and SHP099 concentrations were 10 µM in all panels. Representative results are shown from a minimum of three biological replicates per condition.
Figure S2.
Figure S2.
SHP099 increases KRASG12C-ARS adducts and acts upstream of RAS to block G12C-I–evoked ERK pathway reactivation. (A) 12C-ARS Fab binding to KRASG12C with/without ARS and GTPγS or GDP. (B) Coomassie-stained SDS-PAGE of purified, recombinant KRASG12C, preincubated with DMSO or ARS for 2 h. (C) Immunoblots of WCLs from H358 cells, treated with ARS for 2 h or left untreated, with or without incubation with calf-intestinal phosphatase (CIP). Note that CIP treatment eliminates the pERK signal but does not affect migration of KRAS, arguing against phosphorylation as the cause of the KRAS mobility shift. (D) Immunoblots of WCLs and 12C/V MB PDs from H358 and MIAPaCa-2 cells after treatment with DMSO, SHP099, AMG510, or COMBO, as indicated. For all experiments, drug doses were: SHP099 10 µM, ARS 10 µM, AMG510 0.1 µM. (E) Time-dependent increases in RTK (top) and RTK ligand (bottom) gene expression in KCP cells treated for 48 h with DMSO (CTRL), SHP099, ARS, or COMBO, as determined by RNA-seq (colors indicate log2FC). (F) ERK reactivation, as shown by immunoblot of lysates from MIAPaCa-2 cells treated with DMSO, ARS, or ARS + SHP099 (COMBO) for the indicated times. (G) ERK-dependent gene expression in KCP cells, as assessed by RNA-seq. (H–K) Immunoblots of WCLs and 12C/V MB PDs from KCP cells (H); H358 cells expressing DOX-inducible SOS1 shRNA (shSOS), ±DOX, as indicated (I); parental MIAPaCa-2 cells or MIAPaCa-2 cells PTPN11-KO expressing GFP or reconstituted with WT-PTPN11, treated with ARS for 48 h (J); or MIAPaCa-2 cells expressing SHP099-resistant PTPN11 mutant (P491Q) or WT PTPN11 (WT) treated as described for the indicated times (K). (L) PrestoBlue assays, performed on PTPN11-KO or PTPN11-KO MIAPaCa-2 cells reconstituted with WT, C459E (CE), or Y542F + Y580F (2YF) PTPN11, after 6 d of treatment with ARS or DMSO. For all experiments, drug doses were SHP099 10 µM or ARS 10 µM. Data represent mean ± SD; significance was assessed by multiple unpaired Student’s t test (two tailed). At least two biological replicates with triplicate determinations for each point in each replicate were performed. PAR, parental; R.F.U., relative fluorescence units.
Figure 3.
Figure 3.
SHP2-I acts upstream of RAS to abrogate G12C-I–evoked ERK–MAPK pathway reactivation. (A) Heat map showing increases in RTK/RTK ligand gene expression in MIAPaCa-2 (M) and H358 (H) cells after the indicated treatments for 48 h, determined by qRT-PCR. (B) Immunoblots of WCLs from KRASG12C-expressing cells, treated as indicated in 2D or 3D conditions. (C) ERK-dependent gene expression (ETV1, ETV4, ETV5, and DUSP6), as assessed by qRT-PCR, in KRASG12C lines treated as indicated. (D) SHP099 blocks RAS/ERK reactivation after 48-h ARS treatment of H358 and MIAPaCa-2 cells, as assessed by 12C/V MB PD. (E) Immunoblots of WCL and 12C/V MB PDs from parental or PTPN11-KO MIAPaCa-2 cells treated as indicated. (F) Immunoblots of WCL and 12C/V MB PDs from KCP cells or Ptpn11-KO KCP cells with or without reconstitution with WT-PTPN11, treated as indicated. (G) SHP2, pERK, and ERK immunoblots from MIAPaCa-2 and H358 cells ectopically expressing WT SHP2 (WT) or an SHP099-resistant mutant (P491Q or T253M/Q257L, respectively), treated as indicated. (H) Colony assays (12 d) on parental, PTPN11 KO MIAPaCa-2, or PTPN11 KO MIAPaCa-2 cells reconstituted with WT, phosphatase-inactive C459E (CE), or C-terminal tyrosine phosphorylation site-defective Y542F+Y580F (2YF) PTPN11 mutants, treated as indicated. (I) Immunoblots of WCLs and 12C/V MB PDs from parental, PTPN11-KO MIAPaCa-2, or PTPN11 KO cells reconstituted with WT, C459E (CE), or Y542F+Y580F (2YF) PTPN11, treated as indicated. All data are representative of at least two independent biological replicates. Drug doses were SHP099 10 µM and ARS 10 µM. Data represent mean ± SD; *, P < 0.05; **, P < 0.01; ***, P < 0.001; one-way ANOVA followed by Tukey’s multiple comparison test. Numbers under blots indicate relative intensities, compared with untreated controls, quantified by LI-COR. A.U. and a.u., arbitrary units; ns, not significant.
Figure 4.
Figure 4.
Combined ARS/SHP2 inhibition is highly efficacious in PDAC models in vivo. (A) Scheme showing establishment of pancreas tumors by orthotopic injection of KCP cells into syngeneic mice, followed by treatment with vehicle (n = 6), SHP099 (n = 7), ARS (n = 7), or both drugs (COMBO; n = 9). Tumor weight was quantified in a cohort of mice at day 0 (baseline; n = 4) and in treated mice at day 10. Scale bar, 1 cm. (B) Immunoblots of KCP-derived tumor lysates showing effects of the indicated treatments on KRASG12C-GTP, pERK, and DUSP6 levels. (C–E) ERK-dependent (C), RTK (D), and RTK ligand (E) gene expression, assessed by RNA-seq, in KCP tumors treated for 3 d as in A (colors indicate log2FC, n = 3 per each group). (F) H&E, Masson Trichome, CD31, pERK, Ki67, and cleaved caspase-3 staining and quantification in KCP tumors from mice after 10 d of treatment, as indicated (n = 3 per each group). Scale bars, 100 µm. (G) Scheme showing establishment and treatment of larger KCP tumors. Tumor weight was quantified in one cohort before treatment, another cohort after 12 d of treatment, and after drug withdrawal, at day 27, as indicated. Data were pooled from two independent experiments. Scale bars, 1 cm. (H) Kaplan–Meier curves of KCP tumor-bearing mice after withdrawal of the indicated drugs (top). Tumor growth curves after withdrawal of the indicated treatment at day 12 (bottom). Data were pooled from two independent experiments. (I) Response of SQ NY53 PDXs to the indicated treatments (n = 6/group). For all experiments, doses were SHP099 (75 mg/kg body weight, daily), ARS (200 mg/kg body weight, daily), or both drugs (daily). Veh, vehicle. Data represent mean ± SD; *, P < 0.05; **, P < 0.01; ***, P < 0.001; one-way ANOVA with Tukey’s multiple comparison test. For Kaplan–Meier curves, a log-rank test was used. Numbers under blots indicate relative intensities compared with untreated controls, quantified by LI-COR. ns, not significant.
Figure S3.
Figure S3.
ARS/SHP099 combination is efficacious in PDAC model in vivo. (A) ARS/SHP099 regimen is well tolerated in KCP-derived orthotopic tumors, with no significant decrease in body weight after 12 d of treatment (n = 4). (B–D) Cell cycle (B), MYC target (C), and apoptosis (D) gene expression in KCP-derived orthotopic tumors after vehicle (n = 3), SHP099 (n = 3), ARS (n = 3), or COMBO (n = 3) treatment for 3 d, as determined by RNA-seq (colors indicate log2FC). (E) Pathway analysis using MSigDB Hallmark genes, ranked by fold change between the indicated groups. (F) H&E, Masson trichrome, CD31, pERK, and Ki67 staining of sections from KCP tumors treated for 10 d with vehicle (VEH), SHP099, ARS, or COMBO (20× magnification). Scale bar, 100 µm. (G) Pancreatic epithelial lineage–specific gene expression in control (CTRL) and treated KCP-derived orthotopic tumors, determined by RNA-seq (colors indicate log2FC, n = 3). For all experiments, drug doses were SHP099 75 mg/kg body weight (daily), ARS 200 mg/kg body weight (daily), or both drugs (daily).
Figure 5.
Figure 5.
ARS/SHP099 combination provokes an antitumor immune program in syngeneic PDAC model. (A) Pie charts showing %CD45+ (immune) cells and %CD45- (cancer plus stromal) cells in KCP tumors after 12 d of treatment, as in Fig. 4. (B) Frequencies of infiltrating CD3+ T cells, CD19+ B cells, and CD11b+ myeloid cells. (C) Frequencies of infiltrating CD8+ T cells and respective subpopulations. (D) Frequencies of infiltrating CD4+ T cells and respective subpopulations. (E) Ratio of infiltrating CD8+ T cells to FOXP3+ regulatory CD4+ T cells. (F) Frequencies of infiltrating MDSCs. Data were verified in at least two independent experiments for each subset. (G) Multiplex IF/IHC analysis of KCP tumors, stained with the indicated markers and quantified (n = 3 per each group). Scale bar, 100 µm. For B–G, tumors were analyzed at day 12 after the indicated treatments. CTRL, control. (H) Pie charts showing immune cell (CD45+) composition (top) and tumor volume (bottom) in SQ versus orthotopic (ORTHO) KCP tumors, treated with vehicle (VEH) or ARS + SHP099 (COMBO) for 10 d (n = 3–4/group). Note the greater response of SQ tumors. (I and J) CXCL (I) and CCL (J) chemokine expression in KCP tumors after 3 d of treatment, as assessed by RNA-seq (colors are log10 of raw counts averages and log2FC [left], n = 3 per group [right]). Data represent mean ± SD; *, P < 0.05; **, P < 0.01; ***, P < 0.001; one-way ANOVA with Tukey’s multiple comparison test.
Figure 6.
Figure 6.
ARS/SHP099 efficacy is enhanced by anti–PD-1 in the PDAC model. (A) Syngeneic mice bearing KCP tumors treated with vehicle + isotype IgG (200 µg/mouse three times/week; n = 6), SHP099 (75 mg/kg body weight, daily) + anti–PD-1 (200 µg/mouse three times/week; n = 5), ARS (200 mg/kg body weight, daily) + anti–PD-1 (200 µg/mouse three times/week; n = 5), ARS+SHP099 (COMBO; daily) + isotype IgG (200 µg/mouse three times/week; n = 9), or COMBO (daily) + anti–PD-1 (200 µg/mouse three times/week; n = 9), as depicted. Tumor weights were measured at day 0 (baseline) and day 12. Rightmost panel shows expanded scale for the indicated treatments from the middle panel. (B) H&E, Masson trichrome, and Ki67 staining and quantification of sections from orthotopic KCP tumors, analyzed after treatments in A. Bottommost panel shows expanded scale for the indicated treatments from the panel above (n = 3 per group). Scale bars, 10 µm. (C) Multiplex IF analysis of KCP tumors, after 12-d treatment as indicated, stained with the indicated markers and quantified at right (n = 3 per group). Scale bar, 50 µm. Data represent mean ± SD; *, P < 0.05; **, P < 0.01; ***, P < 0.001; ****, P < 0.0001; one-way ANOVA with Tukey’s multiple comparison test.
Figure 7.
Figure 7.
Tumor cell–autonomous and nonautonomous effects of SHP2 inhibition in PDAC. (A) Tumors were established in syngeneic mice by orthotopic injection of Ptpn11-KO KCP cells reconstituted with WT or SHP099-resistant TM/QL mutant and treated with vehicle or SHP099 (75 mg/kg body weight, daily), as depicted. Tumor weights were measured at day 10. Scale bar, 1 cm. (B) Tumor-infiltrating immune cells from experiment in A (n = 4). (C) Multiplex IF/IHC analysis of representative tumors from A. Scale bars, 20 µm. (D) H&E, pERK, and CD31 staining of representative KCP tumors from A (n = 6). Scale bars, 10 µm. (E) Immunoblot showing CD31, pERK, and DUSP6 levels in representative tumors. (F) ERK-dependent and angiogenesis gene expression, as assessed by RNA-seq, in KCP tumors from A (n = 5; colors indicate log2FC). Data were pooled from two independent experiments. Data represent mean ± SD; ***, P < 0.001; ****, P < 0.0001; significance was assessed by multiple unpaired Student’s t test (two tailed).
Figure S4.
Figure S4.
Tumor cell–autonomous and –nonautonomous effects of SHP2 inhibition and ARS/SHP099 efficacy in NSCLC GEMMs. (A) Expression of chemokines potentially involved in T cell immigration in tumors from Ptpn11-KO KCP cells reconstituted with WT or SHP099-resistant TM/QL mutant, treated for 10 d with vehicle (n = 5) or SHP099 (75 mg/kg body weight daily; n = 5). (B) H&E, pERK, CD31, and αSMA staining of sections from KCP tumor, established as in Fig. 7 A (n = 3/group). Scale bars, 100 µm. (C) CD31 and αSMA quantification from sections KCP tumors established as in B. (D) FKPM for Acta2 (top) and Fgf2 (bottom) in RNA from KCP tumors established as in Fig. 7 A (n = 5/group). (E) Baseline tumor volumes for KCP (left) and KC (right) mice before accrual to the indicated treatments. (F) Growth of H2122 cell–derived xenografts (left) and immunoblots (right) of tumor lysates and 12C/V MB or 12C-ARS Fab PDs from mice treated as indicated (n = 4/group). (G–J) Time-dependent expression of RTK (G), RTK ligand (H), cell cycle (I), MYC target (J), and apoptotic (K) genes in LSL-KRASG12C-Tp53R270H tumors after vehicle (n = 3), SHP099 (n = 3), ARS (n = 3), or COMBO (n = 3) treatment for 3 d, as assessed by RNA-seq (colors indicate log2FC). (L) Pathway analysis of MSigDB Hallmark genes ranked by fold change between the indicated groups. Data represent mean ± SD; *, P < 0.05; **, P < 0.01; ***, P < 0.001; Student’s t test (two tailed). n.s., not significant; NES, normalized enrichment score.
Figure 8.
Figure 8.
ARS/SHP099 combination is also efficacious in NSCLC GEMMs. (A and B) Tumor volume in LSL-KRASG12C-Trp53R270H (A) and LSL-KRASG12C (B) NSCLC GEMMs, quantified by MRI, after treatment with vehicle, SHP099, ARS, or both (COMBO) at the indicated times. (C and D) Representative magnetic resonance images showing lungs from LSL-KRASG12C-Trp53R270H (C) and LSL-KRASG12C (D) NSCLC GEMMs before and after treatment, as indicated. (E and F) Kaplan–Meier curves for LSL-KRASG12C-Trp53R270H (E) and LSL-KRASG12C (F) models after the indicated treatments. (G and H) Immunoblots of lysates and 12C/V-MB or 12C-ARS Fab PDs from LSL-KRASG12C-Trp53R270H (G) and LSL-KRASG12C (H) tumors after 3 d of treatment. (I) ERK-dependent gene expression, as assessed by RNA-seq, in tumors from LSL-KRASG12C-Trp53R270H mice, treated for 3 d, as indicated (colors indicate log2FC). (J) LSL-KRASG12C tumor volume after treatment and drug withdrawal, as indicated (left); representative magnetic resonance images 14 d after drug withdrawal are shown at right. Data were pooled from two independent experiments. (K) Tumor growth curves (top) from three LSL-KRASG12C-Trp53R270H mice after MRTX1257 + SHP099 treatment, drug withdrawal, and rechallenge, as indicated. Representative magnetic resonance images (bottom) of the mouse in the left panel above at the indicated times. Doses were SHP099 75 mg/kg body weight (daily) and MRTX1257 50 mg/kg body weight (daily). Data represent mean ± SD; *, P < 0.05, **, P < 0.01, ***, P < 0.001; one-way ANOVA with Tukey’s multiple comparison test. For the curves in E and F, significance was evaluated by log-rank test; *, P < 0.05; **, P < 0.01; ***, P < 0.001. n.s., not significant; N.D., not determined.
Figure S5.
Figure S5.
ARS/SHP099 also evokes antitumor immune response in NSCLC GEMMs. (A) Quantification of tumor volumes in LSL-KRASG12C NSCLC GEMMs after treatment with vehicle (n = 5), SHP099 (75 mg/kg, daily; n = 7), ARS (200 mg/kg, daily; n = 5), ARS + SHP099 (daily; n = 4), MRTX1257 (50 mg/kg, daily; n = 2), or MRTX1257 + SHP099 (daily, n = 3) at the indicated times. (B) Pie charts showing immune cell populations in LSL-KRASG12C tumors, treated as indicated for 6 d. (C) Multiplex IF/IHC analysis of LSL-KRASG12C- and LSL-KRASG12C; Tp53R270H tumors, treated as indicated for 3 d, and stained with the indicated markers (n = 3/group). Scale bars, 100 µm. (D and E) Infiltrating myeloid cells in LSL-KRASG12C ( D) and LSL-KRASG12C-Tp53R270H (E) tumors analyzed after 6 d of treatment. Data pooled from at least two independent experiments. (F) CD31 staining of sections from LSL-KRASG12C–derived and LSL-KRASG12C-Tp53R270H–derived tumors after 3 d of treatment, as indicated (n = 3/group). Scale bars represent 100 µm and 10 µm for 10× and 40× magnification, respectively. Data represent mean ± SD; *, P < 0.05; **, P < 0.01; ***, P < 0.001; Student’s t test (two tailed). n.s., not significant.
Figure 9.
Figure 9.
ARS/SHP099 provokes an antitumor immune program in syngeneic NSCLC model. (A) Pie chart showing the percentage of CD45+ and CD45 cells in LSL-KRASG12C tumors after 6 d of treatment, as indicated (data are presented as the average of each treatment). (B–E) Frequencies of infiltrating immune cells in LSL-KRASG12C tumors analyzed at day 6 of the indicated treatments. (F) Frequencies of indicated infiltrating immune cells in LSL-KRASG12C-Trp53R270H tumors after 6 d of the indicated treatments. Data represent mean ± SD; *, P < 0.05; **, P < 0.01; ***, P < 0.001; one-way ANOVA with Tukey’s multiple comparison test. Data were pooled from at least two independent experiments.

Similar articles

Cited by

References

    1. Ahmed T.A., Adamopoulos C., Karoulia Z., Wu X., Sachidanandam R., Aaronson S.A., and Poulikakos P.I.. 2019. SHP2 Drives Adaptive Resistance to ERK Signaling Inhibition in Molecularly Defined Subsets of ERK-Dependent Tumors. Cell Rep. 26:65–78.e5. 10.1016/j.celrep.2018.12.013 - DOI - PMC - PubMed
    1. Ahronian L.G., and Corcoran R.B.. 2017. Strategies for monitoring and combating resistance to combination kinase inhibitors for cancer therapy. Genome Med. 9:37 10.1186/s13073-017-0431-3 - DOI - PMC - PubMed
    1. Aird W.C. 2012. Endothelial cell heterogeneity. Cold Spring Harb. Perspect. Med. 2 a006429 10.1101/cshperspect.a006429 - DOI - PMC - PubMed
    1. Anderson G.R., Winter P.S., Lin K.H., Nussbaum D.P., Cakir M., Stein E.M., Soderquist R.S., Crawford L., Leeds J.C., Newcomb R., et al. . 2017. A Landscape of Therapeutic Cooperativity in KRAS Mutant Cancers Reveals Principles for Controlling Tumor Evolution. Cell Rep. 20:999–1015. 10.1016/j.celrep.2017.07.006 - DOI - PMC - PubMed
    1. Araki T., Nawa H., and Neel B.G.. 2003. Tyrosyl phosphorylation of Shp2 is required for normal ERK activation in response to some, but not all, growth factors. J. Biol. Chem. 278:41677–41684. 10.1074/jbc.M306461200 - DOI - PubMed

Publication types

MeSH terms

Substances