. 2020 Oct 9;6(41):eaaz9124.
doi: 10.1126/sciadv.aaz9124. Print 2020 Oct.

A 3D atlas of the dynamic and regional variation of pancreatic innervation in diabetes

Affiliations

A 3D atlas of the dynamic and regional variation of pancreatic innervation in diabetes

Alexandra Alvarsson et al. Sci Adv. .

Abstract

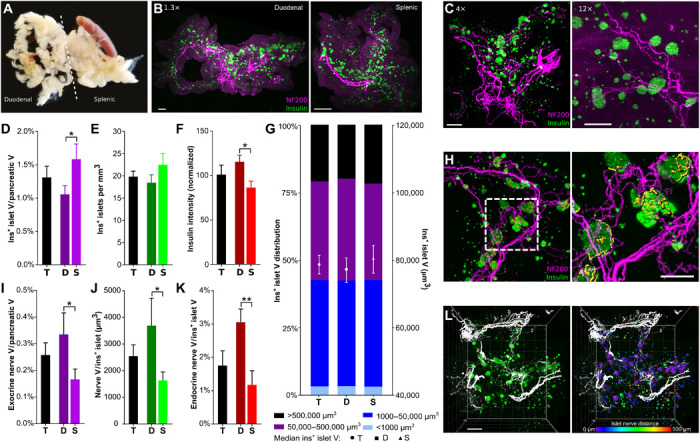
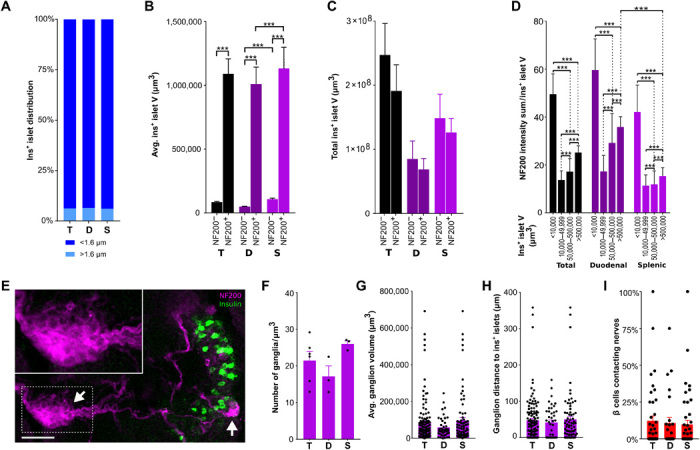
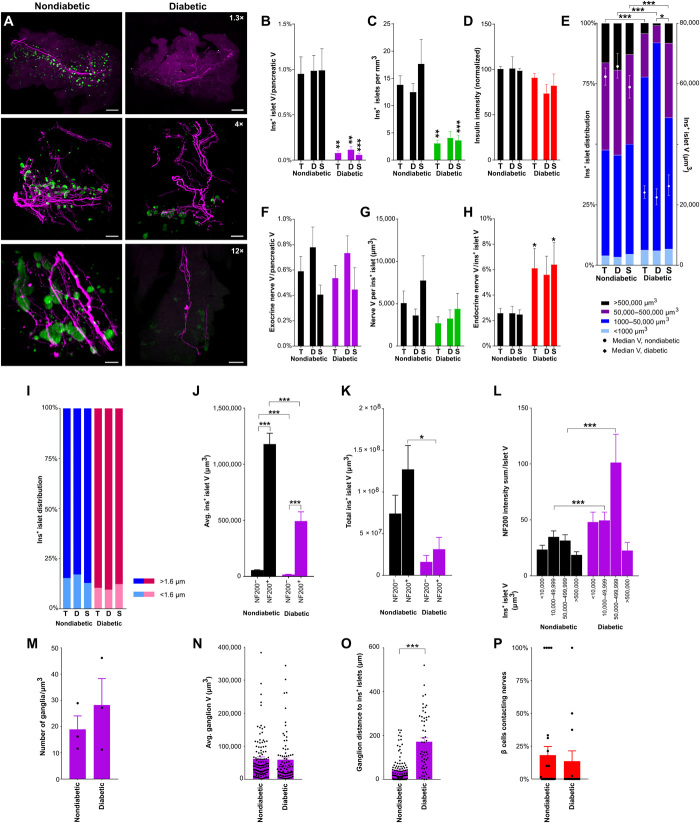
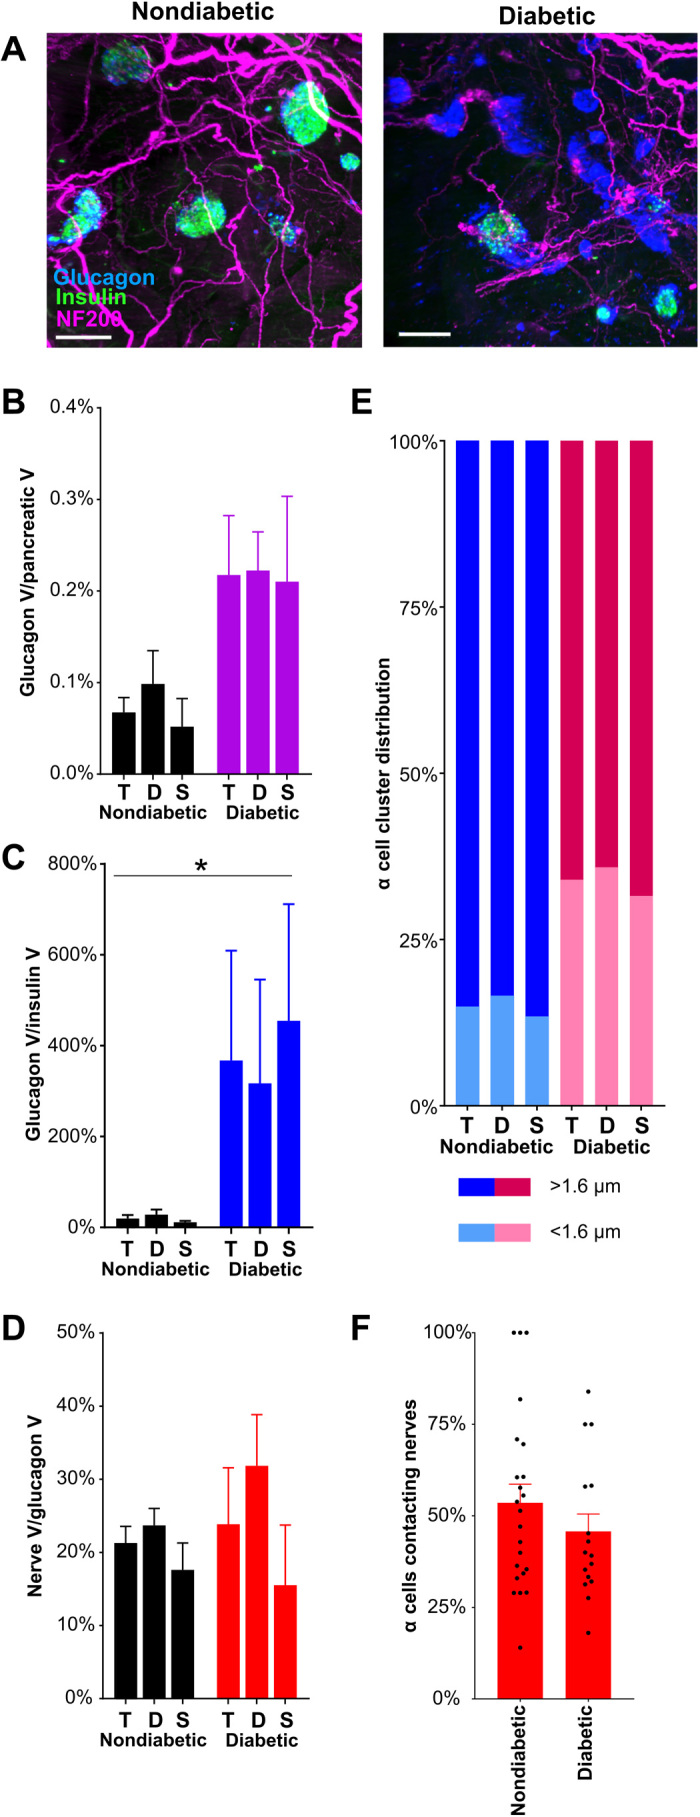
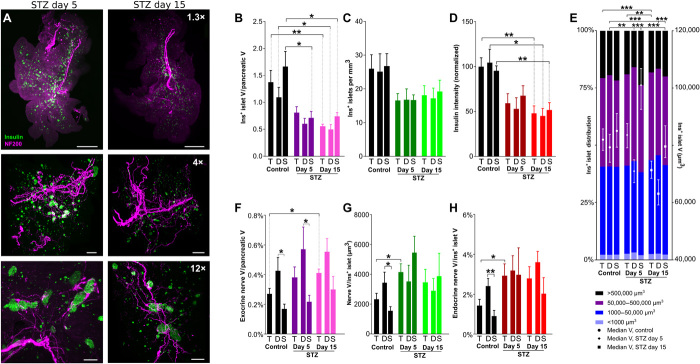
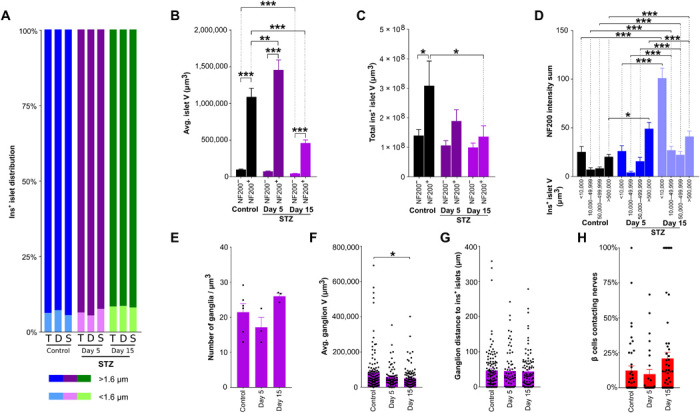
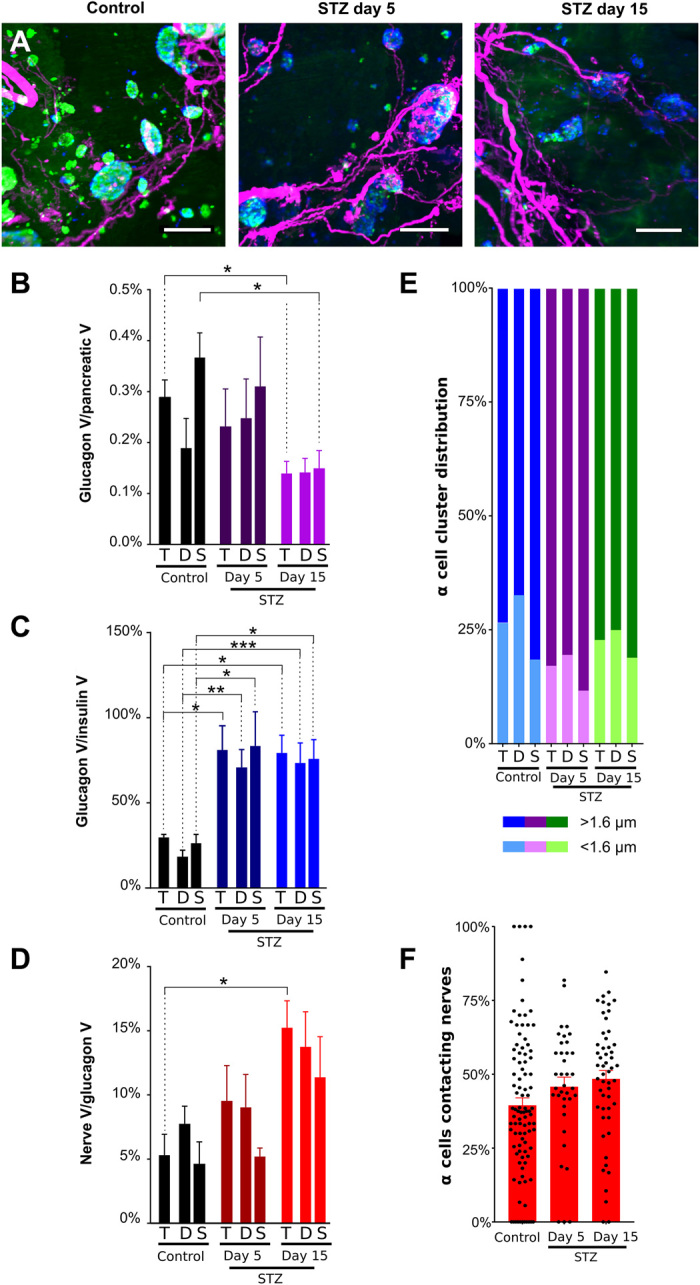
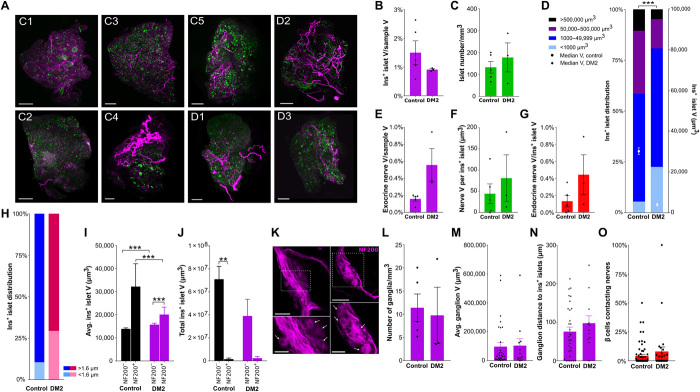
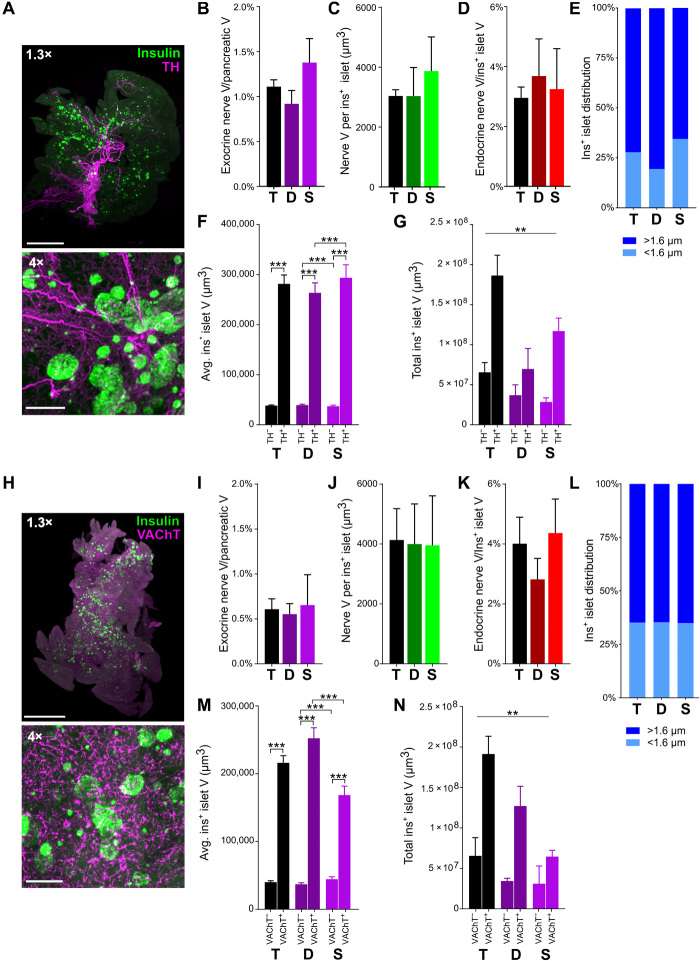
Understanding the detailed anatomy of the endocrine pancreas, its innervation, and the remodeling that occurs in diabetes can provide new insights into metabolic disease. Using tissue clearing and whole-organ imaging, we identified the 3D associations between islets and innervation. This technique provided detailed quantification of α and β cell volumes and pancreatic nerve fibers, their distribution and heterogeneity in healthy tissue, canonical mouse models of diabetes, and samples from normal and diabetic human pancreata. Innervation was highly enriched in the mouse endocrine pancreas, with regional differences. Islet nerve density was increased in nonobese diabetic mice, in mice treated with streptozotocin, and in pancreata of human donors with type 2 diabetes. Nerve contacts with β cells were preserved in diabetic mice and humans. In summary, our whole-organ assessment allows comprehensive examination of islet characteristics and their innervation and reveals dynamic regulation of islet innervation in diabetes.


Figures

Fig. 1
Fig. 1. β cell distribution and pancreatic innervation in C57BL/6 mice.
(A) Pancreatic dissection. Photo credit: A.A., Icahn School of Medicine at Mount Sinai. (B) Duodenal (left) and splenic (right) pancreas, maximum projection (1.3×). Scale bars, 500 μm. (C) Pancreata, maximum projection at 4× (left) and 12× (right). Scale bars, 500 and 200 μm. (D) β cell volume. (E) Insulin+ islets per cubic millimeter. (F) Insulin intensity (normalized to whole pancreas). (G) Insulin+ islet volume distribution (left axis) and median volume (right axis). Islets per group: 27,092/12,260/14,832. (H) 3D projection of insulin, NF200+ exocrine innervation, and NF200+ surfaces within insulin+ islets (yellow). (I) Exocrine nerve volume. (J) Endocrine nerve volume per insulin+ islet. (K) Endocrine nerve volume/islet volume. (L) Left: 3D model of pancreatic innervation (NF200, white) and insulin (green). Right: Distance transformation analysis with islet surfaces pseudocolored based on distance from the nearest nerve surface. Scale bar, 500 μm. Boxed area magnified in the right panel. Scale bar, 200 μm. Data are shown as means ± SEM or median ± 95% confidence interval as indicated. Analyses by unpaired t test, *P < 0.05 and **P < 0.01. T, total; D, duodenal; S, splenic. N = 7 (D to G) and N = 5 (I to K).
Fig. 2
Fig. 2. Interactions between β cells and innervation in C57BL/6 mice.
(A) Distribution of insulin+ islets (<1.6 and >1.6 μm from the nearest nerve). Islets per group: 25,310/10,030/15,280. (B) Mean insulin+ islet volume ± NF200+ innervation; islets per group: 11,869/929/4690/325/7179/604. (C) Total insulin+ islet volume ± NF200+ innervation. (D) NF200 intensity sum normalized for insulin+ islet volume; islets per group: 5174/4530/2264/687/2196/1788/701/330/2978/2742/1563/357. (E) Intrapancreatic ganglia (NF200, magenta) and β cells (insulin, green). Arrows mark ganglia. Scale bar, 50 μm. (F) NF200+ intrapancreatic ganglia per cubic millimeter. (G) Intrapancreatic ganglia volume. Ganglia per group: 123/43/80. (H) Distance between intrapancreatic ganglia and insulin+ islets. Ganglia per group: 123/43/80. (I) β cells contacting nerves per islet. Islets per group: 69/40/29. Data are shown as means ± SEM or median ± 95% confidence interval as indicated. Analyses by Kruskal-Wallis test with Dunn’s test (B to D) or unpaired t test (F to I), ***P < 0.001. T, total; D, duodenal; S, splenic. N = 5 (A to D), N = 3 (F to H), and N = 4 (I).
Fig. 3
Fig. 3. β cell distribution and innervation in nondiabetic and diabetic nonobese diabetic (NOD) mice.
(A) Pancreata from nondiabetic and diabetic NOD mice [maximum projection at 1.3× (top), 4× (middle), and 12× (bottom); scale bars, 2000, 500, and 200 μm]. (B) β cell volume. (C) Insulin+ islets per cubic millimeter of pancreatic tissue. (D) Insulin intensity (normalized against total pancreas, nondiabetic). (E) Insulin+ islet volume distribution (left axis) and median volume (right axis). Islets per group: 11,404/6285/5119/4057/2203/1854. (F) Exocrine nerve volume. (G) Endocrine nerve volume per insulin+ islet. (H) Endocrine nerve volume by islet volume. (I) Distribution of insulin+ islets located <1.6 and >1.6 μm from the nearest nerve. (J) Mean insulin+ islet volume ± NF200+ innervation. Islets per group: 8815/857/4296/436. (K) Total insulin+ islet volume ± NF200+ innervation. (L) NF200 intensity sum normalized for insulin+ islet volume. Islets per group: 4941/3341/1209/383/2862/1586/189/73. (M) Intrapancreatic ganglia per cubic millimeter. (N) Intrapancreatic ganglia volume. Ganglia per group: 112/82. (O) Distance between intrapancreatic ganglia and insulin+ islets. Ganglia per group: 111/54. (P) β cells contacting nerves per islet. Islets per group: 28/14. Data are shown as means ± SEM or median ± 95% confidence interval where indicated. Analyses by one-way ANOVA with Tukey’s test (B to D and F to G), Kruskal-Wallis with Dunn’s test (H and J to L), or unpaired t test between diabetic and nondiabetic groups (H). *P < 0.05, **P < 0.01, and ***P < 0.001. T, total; D, duodenal; S, splenic. N = 7 nondiabetic and N = 7 diabetic (B to E, P); N = 8 nondiabetic and N = 7 diabetic (F to L); N = 6 nondiabetic and N = 6 diabetic (M to O).
Fig. 4
Fig. 4. α cell distribution and innervation in nondiabetic and diabetic NOD mice.
(A) Maximum projections of light-sheet images of pancreatic samples from nondiabetic and diabetic NOD mice stained for insulin (green), NF200 (magenta), and glucagon (blue) and imaged at ×4 magnification. Scale bars, 200 μm. (B) α cell volume corrected for pancreatic volume in NOD mice. (C) Glucagon+ α cell volume as a percentage of insulin+ β cell volume in NOD mice. (D) NF200+ nerve volume within glucagon+ α cell clusters in NOD mice. (E) Glucagon+ α cell cluster volume (left axis) and median nerve distance (right axis) in NOD mice. (F) Percentage of α cells contacting nerves per islet. Number of islets: 23/16. Data are shown as mean ± SEM or as median ± 95% confidence interval where indicated. Analyses by one-way ANOVA with Tukey’s test (D) or Kruskal-Wallis with Dunn’s test (B, C, and E). *P < 0.05. T, total; D, duodenal; S, splenic. N = 3 nondiabetic and N = 3 diabetic NOD mice.
Fig. 5
Fig. 5. β cell distribution and pancreatic innervation with development of diabetes in STZ-treated mice.
(A) Pancreata at days 5 (left) and 15 (right) after STZ treatment, maximum projections at 1.3× (top), 4× (middle), and 12× (bottom). Scale bars: 1000, 500, and 200 μm. (B) β cell volume. (C) Insulin+ islets per cubic millimeter. (D) Insulin intensity (normalized against total pancreas, control). (E) Insulin+ islet volume distribution (left axis) and median volume (right axis). Islets per group: 10,479/4682/5797/10,091/5162/4929/14,380/7543/6837. (F) Exocrine nerve volume. (G) Endocrine nerve volume per insulin+ islet. (H) Endocrine nerve by islet volume. Data are shown as mean ± SEM or as median ± 95% confidence interval where indicated. Analyses by one-way ANOVA with Tukey’s test for comparison between control, STZ day 5, and STZ day 15, and unpaired t test for comparison between duodenal and splenic pancreas (B to D and F to H) or Kruskal-Wallis with Dunn’s test (E); *P < 0.05, **P < 0.01, and ***P < 0.001. T, total; D, duodenal; S, splenic. N = 5 control, N = 6 STZ day 5, and N = 7 STZ day 15 (B to E); N = 6 control, N = 5 STZ day 5, and N = 5 STZ day 15 (F to H).
Fig. 6
Fig. 6. Interactions between β cells and innervation with development of diabetes in STZ-treated mice.
(A) Distribution of insulin+ islets located <1.6 and >1.6 μm from the nearest nerve. (B) Mean volume for insulin+ islets ± NF200+ innervation. Islets per group: 10,199/929/5300/366/9837/1022. (C) Total volume for insulin+ islets ± NF200+ innervation. (D) Intensity of NF200 immunolabeling normalized for insulin+ islet volume. Islets per group: 3013/2762/1837/605/2842/1791/1057/336/5800/3274/1500/386. (E) Ganglia per cubic millimeter. (F) Volume of intrapancreatic ganglia. Ganglia per group: 114/73/97. (G) Distance between intrapancreatic ganglia and insulin+ islets. Ganglia per group: 114/73/97. (H) Percentage of β cells contacting nerves per islet. Islets per group: 69/28/69. Data are shown as means ± SEM or as median ± 95% confidence interval where indicated. Analyses by Kruskal-Wallis with Dunn’s test (B to D) for comparison between control, STZ day 5, and STZ day 15, and unpaired t test for comparison between duodenal and splenic pancreas (E to H). *P < 0.05, **P < 0.01, and ***P < 0.001. T, total; D, duodenal; S, splenic. N = 6 control, N = 5 STZ day 5, and N = 5 STZ day 15 (A to D); N = 6 control, N = 3 STZ day 5, and N = 3 STZ day 15 (E to H).
Fig. 7
Fig. 7. α cell distribution and innervation with development of diabetes in STZ-treated mice.
(A) Pancreata at days 5 (left) and 15 (right) after STZ treatment. Insulin, green; NF200, magenta; glucagon, blue. Imaged at ×4 magnification. Scale bars, 200 μm. (B) Quantification of α cell volume corrected for pancreatic volume in STZ-treated mice. (C) Quantification of glucagon+ α cell volume as a percentage of insulin+ β cell volume in STZ-treated mice. (D) Quantification of NF200+ nerve volume within glucagon+ α cell clusters in STZ-treated mice. (E) Glucagon+ α cell cluster volume (left axis) and median nerve distance (right axis) in STZ-treated mice. (F) Percentage of α cells contacting nerves per islet. Islet number: 98/37/53. Data are shown as means ± SEM or as median ± 95% confidence interval where indicated. Analyses by one-way ANOVA with Tukey’s test (C to D) or Kruskal-Wallis with Dunn’s test (B and E). *P < 0.05, **P < 0.01, and ***P < 0.001. T, total; D, duodenal; S, splenic. N = 6 control, N = 4 STZ day 5, and N = 6 STZ day 15.
Fig. 8
Fig. 8. β cell distribution and innervation in human pancreatic samples.
(A) Maximum projections of pancreatic samples from human donors without (C1 to C5) and with type 2 diabetes (DM2; D1 to D3) at 1.3×. Scale bars, 1000 μm. (B) β cell volume. (C) Insulin+ islets per cubic millimeter. (D) Insulin+ islet volume distribution (left axis) and median volume (right axis). (E) Exocrine nerve volume. (F) Endocrine nerve volume per insulin+ islet. (G) Endocrine nerve volume corrected for insulin+ islet volume. (H) Distribution of insulin+ islets located at <1.6 and >1.6 μm from nerves. Islets per group: 28,315 control and 6790 DM2. (I) Mean volume of insulin+ islets ± NF200+ innervation. Islets per group: 25,519/236/7448/345. (J) Total volume of insulin+ islets ± NF200+ innervation. (K) Intrapancreatic ganglia (NF200, magenta; confocal, 20×). Boxed areas magnified in lower panels with cell bodies indicated by arrows. Scale bars, 50 μm (top) and 25 μm (bottom). (L) Ganglia per cubic millimeter. (M) Volume of intrapancreatic ganglia. Ganglia per group: 31/12. (N) Distance between intrapancreatic ganglia and insulin+ islets. Ganglia per group: 31/12. (O) β cells contacting nerves per islet. Islets per group: 73/28. Data are shown as means ± SEM or as median ± 95% confidence interval where indicated. Analyses by unpaired t test (B to G and L to M), Mann-Whitney test (H), or Kruskal-Wallis with Dunn’s test (I to J). *P < 0.05, **P < 0.01, and ***P < 0.001. T, total; D, duodenal; S, splenic. N = 5 control and N = 3 DM2.
Fig. 9
Fig. 9. β cell distribution and sympathetic and parasympathetic innervation in C57BL/6 mice.
(A) Maximum projections of TH and insulin. Scale bars, 2000 μm at 1.3× and 200 μm at 4×. (B) TH+ exocrine nerve volume. (C) TH+ endocrine nerve volume per insulin+ islet. (D) TH+ endocrine nerve volume by insulin+ islet volume. (E) Distribution of insulin+ islets located at <1.6 and >1.6 μm from TH+ nerves. Islets per group: 10,610/4773/5837. (F) Mean insulin+ islet volume for insulin+ islets with and without TH+ innervation. Islets per group: 8542/3314/4699/1320/3843/1994. (G) Total volume for insulin+ islets with and without TH+ innervation. (H) Maximum projections of VAChT and insulin. Scale bars, 2000 μm at 1.3× and 200 μm at 4×. (I) VAChT+ exocrine nerve volume. (J) VAChT+ endocrine nerve volume per insulin+ islet. (K) VAChT+ endocrine nerve volume corrected for insulin+ islet volume. (L) Distribution of insulin+ islets located at <1.6 and >1.6 μm from VAChT+ nerves. Islets per group: 12,661/7165/5496. (M) Mean volume for insulin+ islets with and without VAChT+ innervation. Islets per group: 8542/3314/4699/1320/3843/1994. (N) Total volume for insulin+ islets with and without VAChT+ innervation. Data are shown as means ± SEM or as median ± 95% confidence interval where indicated. Analyses by unpaired t test (B to E and I to L) or Kruskal-Wallis with Dunn’s test (F, G, M, and N). **P < 0.01 and ***P < 0.001. T, total; D, duodenal; S, splenic. N = 5.

Similar articles

Cited by

References

    1. Aamodt K. I., Powers A. C., Signals in the pancreatic islet microenvironment influence β-cell proliferation. Diabetes Obes. Metab. 19, 124–136 (2017). - PMC - PubMed
    1. Ahrén B., Autonomic regulation of islet hormone secretion—Implications for health and disease. Diabetologia 43, 393–410 (2000). - PubMed
    1. Rodriguez-Diaz R., Abdulreda M. H., Formoso A. L., Gans I., Ricordi C., Berggren P.-O., Caicedo A., Innervation patterns of autonomic axons in the human endocrine pancreas. Cell Metab. 14, 45–54 (2011). - PMC - PubMed
    1. J. Gerald, J. Taborsky, Handbook of Physiology (Oxford Univ. Press, American Physiological Society, 2001).
    1. Stanley S. A., Kelly L., Latcha K. N., Schmidt S. F., Yu X., Nectow A. R., Sauer J., Dyke J. P., Dordick J. S., Friedman J. M., Bidirectional electromagnetic control of the hypothalamus regulates feeding and metabolism. Nature 531, 647–650 (2016). - PMC - PubMed

Publication types

LinkOut - more resources