. 2020 Dec;21(12):1506-1516.
doi: 10.1038/s41590-020-00814-z. Epub 2020 Oct 7.

Extrafollicular B cell responses correlate with neutralizing antibodies and morbidity in COVID-19

Affiliations

Extrafollicular B cell responses correlate with neutralizing antibodies and morbidity in COVID-19

Matthew C Woodruff et al. Nat Immunol. 2020 Dec.

Abstract

A wide spectrum of clinical manifestations has become a hallmark of the severe acute respiratory syndrome coronavirus 2 (SARS-CoV-2) COVID-19 pandemic, although the immunological underpinnings of diverse disease outcomes remain to be defined. We performed detailed characterization of B cell responses through high-dimensional flow cytometry to reveal substantial heterogeneity in both effector and immature populations. More notably, critically ill patients displayed hallmarks of extrafollicular B cell activation and shared B cell repertoire features previously described in autoimmune settings. Extrafollicular activation correlated strongly with large antibody-secreting cell expansion and early production of high concentrations of SARS-CoV-2-specific neutralizing antibodies. Yet, these patients had severe disease with elevated inflammatory biomarkers, multiorgan failure and death. Overall, these findings strongly suggest a pathogenic role for immune activation in subsets of patients with COVID-19. Our study provides further evidence that targeted immunomodulatory therapy may be beneficial in specific patient subpopulations and can be informed by careful immune profiling.


Conflict of interest statement

Competing interests

F.E.-H.L. is the founder of MicroB-plex and has research grants with Genentech. W.T.H. has consulted for ViveBio, AARP and Biogen; has received research support from Fujirebio; and has a patent on CSF-based diagnosis of FTLD-TDP. M.S.D. is a consultant for Inbios, Vir Biotechnology and NGM Biopharmaceuticals and is on the scientific advisory board of Moderna. The Diamond laboratory has received unrelated funding support in sponsored research agreements from Moderna, Vir Biotechnology and Emergent BioSolutions. J.E.C. has served as a consultant for Pfizer, Novavax, Lilly and Luna Biologics; is a member of the scientific advisory boards of CompuVax and Meissa Vaccines; and is Founder of IDBiologics. The Crowe laboratory at Vanderbilt University Medical Center has received unrelated funding support in sponsored research agreements from Moderna, Sanofi-Aventis and IDBiologics.

Figures

Extended Data Fig. 1 |
Extended Data Fig. 1 |. Cellularity of COVID-19 patient blood samples.
a, Calculated total PBMC yield per mL of patient blood from HD, or donors with COVID-19. b, Frequency of CD19+ B cells of CD45+ cells in HD vs donors with COVID-19.
Extended Data Fig. 2 |
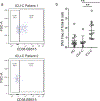
Extended Data Fig. 2 |. DN3 cells are expanded in the ICu-C cohort.
a, CD38 expression by DN3 cells in two ICU-C patients. b, DN3 frequency of total CD19+ B cells in HD, OUT-C, and ICU-C cohorts.
Extended Data Fig. 3 |
Extended Data Fig. 3 |. COVID-19 infection comparisons with African American HD cohorts.
Critical indicators of EF response activation were compared between the current HD cohort (recruited for this study), historically collected HD cohorts of AA descent (AA-HD), and patients groups as in [Figs. 2 and 3]. a, ASC frequency of total CD19+ B cells in HD, AA HD, OUT-C, and ICU-C cohorts. b, usM frequency of total CD19+ B cells in HD, AA HD, CoV-B, and CoV-A cohorts. (a) DN2:DN1 ratios in HD, AA HD, CoV-B, and CoV-A cohorts.
Extended Data Fig. 4 |
Extended Data Fig. 4 |. Cartoon of EF vs. follicular response pathway intermediates.
Center table summarizes documented features of EF responses in primary infection and highlights open questions about the formation of memory and long-lived ASC responses as a result of pathway activation to be answered in follow up studies.
Fig. 1 |
Fig. 1 |. B cell characterization in acute COVID-19 infection by high-dimensional FCM.
af, PBMCs from HD (n = 17), OUT-C (n = 7) or ICU-C (n = 10) patients were analyzed by FCM. Representative patient samples were selected for display (OUT-C: day 4 after symptom onset; ICU-C: day 7 after symptom onset). a, Primary population gating of representative patient samples. b, ASC sub-gating (CD138+ ASC and CD138 ASC) of representative patient samples. c, Transitional B cell sub-gating (CD21lo Tr and CD21hi Tr) of representative patient samples. d, Double-negative B cell sub-gating (DN1, DN2 and DN3) of representative patient samples. e, Naive B cell sub-gating (resting naive (rN) and aN) of representative patient samples. f, Memory B cell sub-gating (mM, usM, dM and sM) of representative patient samples displayed a decrease in usM in ICU-C. dM, IgD-only memory; mM, IgM-only memory; usM, unswitched memory.
Fig. 2 |
Fig. 2 |. UMAP projections of compiled COVID-19 FCM dataset.
a, UMAP projection of composite patient samples. Composite sample was derived from 1,000 representative cells from patients analyzed with spectral panel V2 (Methods; HD: n = 12; OUT-C: n = 7; ICU-C: n = 10). bd, Outlined regions represent the 90% equal probability contouring from the indicated classification. b, Patient disease status overlaid on the composite UMAP projection from a. c, Primary populations as gated in Fig. 1a and Table 1 overlaid on the composite UMAP projection from a. d, Secondary populations as gated in Fig. 1b–f and Table 1 overlaid on the composite UMAP projection from a. e, Heat maps of select marker expression overlaid on composite UMAP projection from a. bd, Outlined regions contain 90% of cells derived from the indicated classification.
Fig. 3 |
Fig. 3 |. Unique B cell utilization by ICU patients and outpatients with COVID-19.
a, Overlay of patient disease status on the composite UMAP projection as in Fig. 2a (HD: n = 12; OUT-C: n = 7; ICU-C: n = 10). Regions of overlapping density are subtracted to display ROIs indicating unique population use. b, Top: magnification of ROI 1 from a. Bottom: indicated secondary populations overlaid on a magnification of region 1 from a. c, aN frequency of CD19+ B cells in HD (n = 17), ICU-C (n = 10) or OUT-C (n = 7) cohorts. d, DN2 frequency of CD19+ B cells in HD, ICU-C or OUT-C cohorts. e, T-bet expression in indicated secondary populations from ICU-C patients by intracellular FCM (n = 4). MFI, median fluorescence intensity. f, Representative histograms of T-bet expression as in e. APC, antigen-presenting cell. g, ASC frequency of CD19+ B cells in HD, ICU-C or OUT-C cohorts. h, CD138+ ASC frequency of CD19+ B cells in HD, ICU-C or OUT-C cohorts. i, CD138+ ASC frequency of total ASCs in HD, ICU-C or OUT-C cohorts. j, Tr frequency of CD19+ B cells in HD, ICU-C or OUT-C cohorts. k, CD21lo Tr frequency of CD19+ B cells in HD, ICU-C or OUT-C cohorts. l, Histograms of indicated marker expression by FCM. ck, Statistical significance was determined using ANOVA with Tukey’s multiple-comparisons testing between all groups. *P ≤ 0.05; **P ≤ 0.01; ***P ≤ 0.001; ****P ≤ 0.0001. Summary statistics (ck): mean ± standard deviation (s.d.).
Fig. 4 |
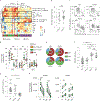
Fig. 4 |. Severe COVID-19 correlates with SLE-like activation of the EF pathway.
a, Heat map of secondary population frequency z-scores by outpatient (purple; n = 7), ICU (green; n = 6) or deceased (red; n = 4) patients who tested positive for COVID-19. Multivariate clustering of patients by Ward’s method is represented by dendrograms. Clusters were designated as CoV-A and CoV-B for downstream analysis. Black boxes highlight transitional B cells or populations previously (DN2, aN) or currently (DN3) implicated in EF responses. The red box and dagger indicate patients analyzed by single-cell V(D)J analysis in Fig. 5. preMZ, precursors of marginal zone B cells. b, Patient sample collection times following symptom onset in CoV-A (n = 9) and CoV-B (n = 8) clusters. c, Representative plots of DN population composition in HD, CoV-A, CoV-B and SLE patient groups. d, DN composition analysis in HD (n = 17), CoV-A (n = 9), CoV-B (n = 8) and SLE (n = 7) patient groups. e, Outer ring represents the mean DN population composition of patient groups. Inner ring represents the mean DN2:DN1 ratios of patient groups. f, DN2:DN1 ratios in HD, CoV-A, CoV-B and SLE patient groups. g, usM frequency of CD19+ B cells in HD (n = 17), CoV-A (n = 9) and CoV-B (n = 8) groups. h, Homing receptor surface expression in follicular (rN and DN1) versus EF (aN and DN2) populations observed in CoV-A (n = 9) patients. b, Differences between groups were analyzed by a two-tailed Student’s t-test. d–h, Statistical significance was determined using ANOVA with Tukey’s multiple-comparisons testing between groups. *P ≤ 0.05; **P ≤ 0.01; ***P ≤ 0.001; ****P ≤ 0.0001; NS, not significant. Summary statistics (bg): mean ± s.d.
Fig. 5 |
Fig. 5 |. ASC compartment displays low levels of SHM across diverse isotypes.
a, Isotype usage in naive B cells and ASCs through single-cell V(D)J analysis of ICU-C patient samples (Figs. 4a and 6i; day 12 after symptom onset). b, Circos plot from ASCs in a connecting observed clonotypes containing cellular members in both unswitched (IgM) and switched compartments. c, Sample clonality of ICU patient ASCs assessed through single-cell (scVDJ patient 1) or bulk (bVDJ patients 2 and 3) V(D)J repertoire sequencing. d, Representative lineage trees from patient 1 displaying evidence of SHM. e, Distribution of average clonotype mutation frequencies by isotype in patient 1. f, Percentage of clonotypes in each isotype that display exclusively germline IgHV sequences. g, Representative clonotypes using IGHV4–34 with intact AVY hydrophobic patches in patient 1. h, Concentrations of serum 9G4-idiotype antibodies in HD (n = 52), OUT-C (n = 6) or ICU-C (n = 9) cohorts. Red coloring and dagger indicate the patient analyzed by single-cell V(D)J analysis (ag). Statistical significance was determined using ANOVA with Tukey’s multiple-comparison testing between groups. ***P ≤ 0.001; ****P ≤ 0.0001. Summary statistics: mean ± s.d.
Fig. 6 |
Fig. 6 |. EF response intensity is correlated with inflammatory biomarkers and high neutralizing antibody titers.
a, CXCL10 (IP-10) plasma concentration in HD (n = 13), CoV-A (n = 8) or CoV-B (n = 5) cohort. The asterisk denotes the highest value exceeding the testing range and was identified to be a statistical outlier (P < 0.00001). P-value reporting in parentheses indicates testing with outlier removed. b, IL-6 plasma concentration of HD (n = 13), CoV-A (n = 8) or CoV-B (n = 5) cohort. c, CRP concentration in the plasma of HD (n = 13), CoV-A (n = 8) or CoV-B (n = 5) cohort. d, Linear regression of CRP values as a function of IP-10 plasma levels (with outlier removed). e, Linear regression of CRP values as a function of IL-6 plasma levels. f, Linear regression of log(CRP) values as a function of DN2 B cell frequency of total DN B cells. g, RBD-specific responses grouped by indicated isotype in HD (n = 13), ICU-C (n = 10) or OUT-C (n = 7) cohort. h, RBD-specific responses as a function of time in HD, ICU-C or OUT-C cohort. Solid lines represent quadratic regression; shaded areas denote 95% confidence intervals of quadratic regression. i, Regression analyses of in vitro viral neutralization as a function of patient serum dilution in HD (n = 3), CoV-A (n = 4) or CoV-B (n = 3) clusters. Dagger indicates patient analyzed by single-cell V(D)J analysis (Fig. 5a–g). ac,g, Statistical significance was determined using ANOVA with Tukey’s multiple-comparisons testing between groups. ag, *P ≤ 0.05; **P ≤ 0.01; ***P ≤ 0.001; ****P ≤ 0.0001. Summary statistics: median (ac); mean ± s.d. (g).

Update of

Similar articles

Cited by

References

    1. Chen X et al. Detectable serum SARS-CoV-2 viral load (RNAaemia) is closely correlated with drastically elevated IL-6 level in critically ill COVID-19 patients. Clin. Infect. Dis 10.1093/cid/ciaa449 (2020). - DOI - PMC - PubMed
    1. Henderson LA et al. On the alert for cytokine storm: immunopathology in COVID-19. Arthritis Rheumatol. 10.1002/art.41285 (2020). - DOI - PMC - PubMed
    1. Group RC et al. Dexamethasone in hospitalized patients with COVID-19—preliminary report. N Engl. J. Med 10.1056/NEJMoa2021436 (2020). - DOI - PubMed
    1. Tang Y et al. Cytokine storm in COVID-19: the current evidence and treatment strategies. Front. Immunol 11, 1708 (2020). - PMC - PubMed
    1. Harrison C Focus shifts to antibody cocktails for COVID-19 cytokine storm. Nat. Biotechnol 38, 905–908 (2020). - PubMed

Publication types