. 2020 Sep 30;3(1):541.
doi: 10.1038/s42003-020-01243-2.

Topologically selective islet vulnerability and self-sustained downregulation of markers for β-cell maturity in streptozotocin-induced diabetes

Affiliations

Topologically selective islet vulnerability and self-sustained downregulation of markers for β-cell maturity in streptozotocin-induced diabetes

Max Hahn et al. Commun Biol. .

Abstract

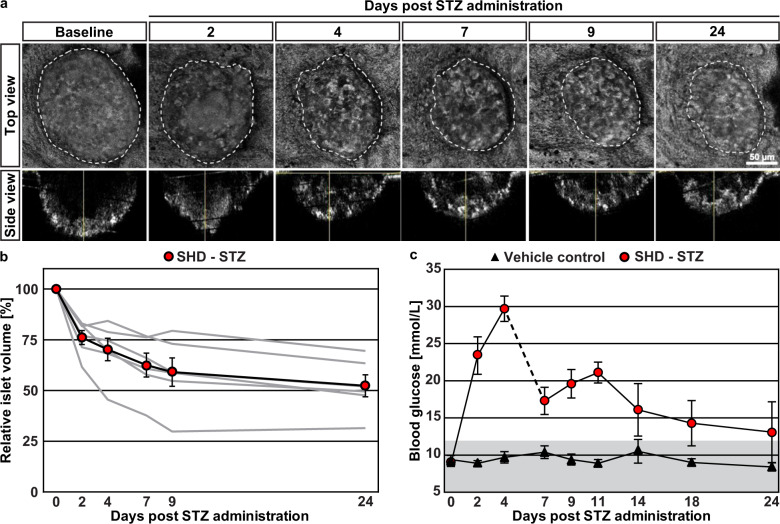
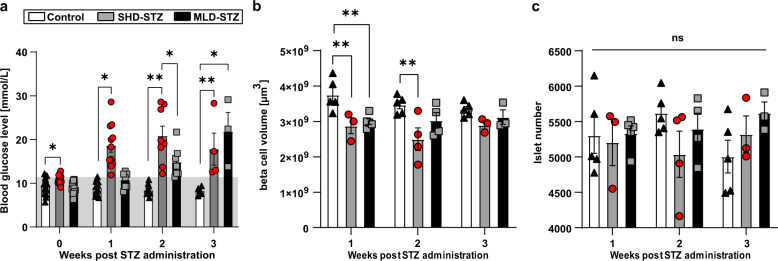
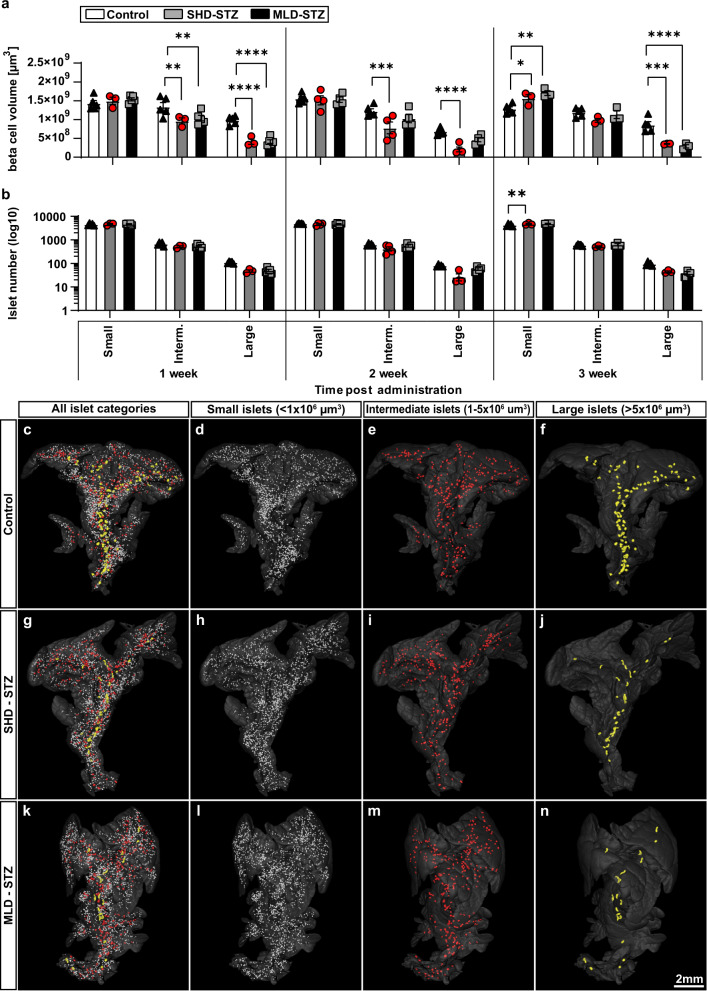
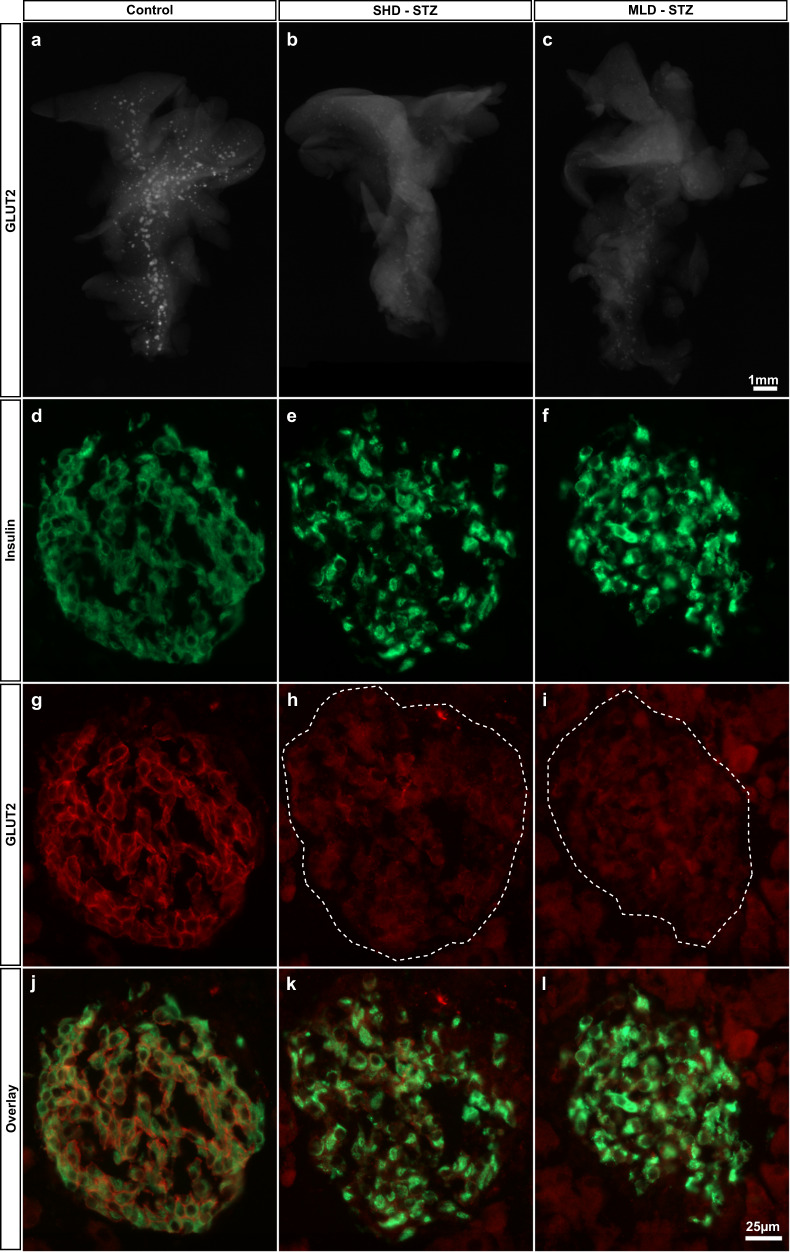
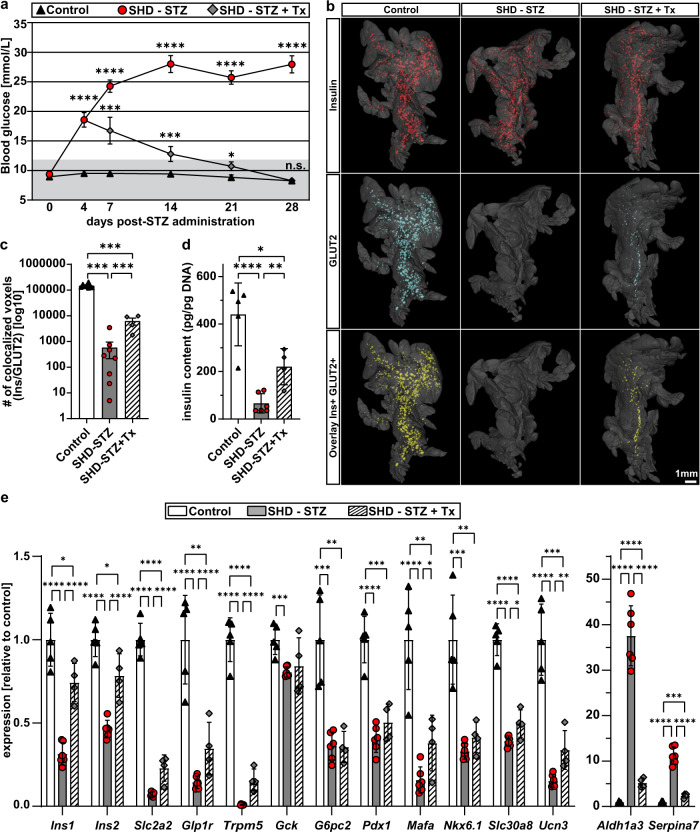
Mouse models of Streptozotocin (STZ) induced diabetes represent the most widely used preclinical diabetes research systems. We applied state of the art optical imaging schemes, spanning from single islet resolution to the whole organ, providing a first longitudinal, 3D-spatial and quantitative account of β-cell mass (BCM) dynamics and islet longevity in STZ-treated mice. We demonstrate that STZ-induced β-cell destruction predominantly affects large islets in the pancreatic core. Further, we show that hyperglycemic STZ-treated mice still harbor a large pool of remaining β-cells but display pancreas-wide downregulation of glucose transporter type 2 (GLUT2). Islet gene expression studies confirmed this downregulation and revealed impaired β-cell maturity. Reversing hyperglycemia by islet transplantation partially restored the expression of markers for islet function, but not BCM. Jointly our results indicate that STZ-induced hyperglycemia results from β-cell dysfunction rather than β-cell ablation and that hyperglycemia in itself sustains a negative feedback loop restraining islet function recovery.


Conflict of interest statement

Author P.O.B. is founder and CEO of Biocrine AB, Sweden and author E.I. is consultant for Biocrine AB. All other authors declare no competing interests.

Figures

Fig. 1
Fig. 1. Streptozotocin-induced β-cell destruction kinetics revealed by longitudinal in vivo imaging of islet grafts.
a Individual islets transplanted into the ACE were imaged by in vivo confocal microscopy at several time points. Backscatter imaging allowed to capture volumetric data of islet grafts. Following a baseline assessment 1 month after transplantation, host mice received a single high dose of Streptozotocin (SHD-STZ, 200 mg/kg) to induce β-cell ablation. Displayed are maximum projection images of confocal stacks from the same islet graft over time. b Quantification of islet graft volumes for each time point reveals a gradual decrease following β-cell destruction. Data are displayed per mouse (gray lines) and as the average (black line, n = 6 mice). c Blood glucose values of STZ and sham treated mice over time. To prevent excessive weight loss as a consequence of hyperglycemia, the SHD-STZ group received ~100 additional islets in the non-transplanted eye at day 6. Gray shading in (c) represents normoglycemic levels, as defined by blood glucose concentration ≤12 mmol/L. Error bars represent SEM.
Fig. 2
Fig. 2. Mice with STZ-induced hyperglycemia display a modest reduction in BCM and unchanged islet numbers.
a Blood glucose levels following SHD-STZ and MLD-STZ administration. n = 15 (week 0), n = 15 (week 1), n = 10 (week 2), and n = 5 (week 3). b Average BCM (defined here as β-cell volume, see text) in entire pancreata from hyperglycemic STZ-treated mice compared to untreated controls. Given the tomographic method of detection, BCM here corresponds to the volume of islet β-cells. c Average islet number in entire pancreata from hyperglycemic STZ-treated mice compared to untreated controls. In (b, c) n = 5 in controls at 1–3 weeks, n = 3 at 1 and 3 weeks and n = 4 at 2 weeks in SHD-STZ, n = 5 at 1 week, n = 4 at 2 weeks and n = 3 at 3 weeks in MLD-STZ. Gray shade in (a) represent normoglycemic levels, as defined by blood glucose concentration ≤12 mmol/L. Error bars represent SEM. * represents P ≤ 0.05, ** represents P ≤ 0.01.
Fig. 3
Fig. 3. STZ-induced β-cell mass reduction is primarily attributed to reduction of large islets.
a, b Graphs displaying the average volume (a) and number (b) of islets falling within arbitrarily selected size categories of small (<1 × 106 µm3), medium (1–5 × 106 µm3) and large (>5 × 106 µm3) islets of Langerhans of hyperglycemic mice at 1, 2, and 3 weeks post-administration of SHD-STZ (Gray) MLD-STZ (Black) administration compared to untreated control (White) at 1, 2, and 3 weeks post-STZ administration, respectively. cn Representative iso-surface rendered OPT images (splenic lobe only) of control pancreata (cf) and 3 weeks post SHD-STZ (gj) and MLD-STZ (kn) administration. Islet β-cell volumes have been pseudo colored to delineate small (<1 × 106 µm3) (d, h, l, white), medium (e, i, m, red, 1–5 × 106 µm3), and large (f, j, n, yellow, >5 × 106 µm3) islets. In a, b n = 5 in controls at 1–3 weeks, n = 3 at 1 and 3 weeks and n = 4 at 2 weeks in SHD-STZ, n = 5 at 1 week, n = 4 at 2 weeks and n = 3 at 3 weeks in MLD-STZ. Error bars represent SEM. *, **, ***, and **** represent P ≤ 0.05, ≤0.01, ≤0.001, and ≤0.0001 respectively.
Fig. 4
Fig. 4. Large islets of STZ-treated mice display a disturbed and elongated morphology.
ac OPT images of splenic lobes of control (a), SHD-STZ (b) and MLD-STZ (c) pancreata 3 weeks post-STZ administration. Dashed boxes in (ac) indicate the locations imaged by light sheet fluorescence microscopy (LSFM), displaying representative centrally-located large (a′–c′) and peripherally located small islets (a″–c″). LSFM images are shown as maximum intensity projections, from representative OPT samples (n = 3 pancreata per group). Note, samples were LSFM-scanned at different exposure times and are not intended for signal intensity comparisons.
Fig. 5
Fig. 5. STZ administration results in a pancreas-wide downregulation of GLUT2 expression.
ac Representative OPT projection images showing GLUT2 expression in the intact splenic lobe of the pancreas of control (a), SHD-STZ (b) and MLD-STZ (c) hyperglycemic animals 3 weeks post-STZ administration. OPT images are representative of n = 5, 4, and 3 pancreata for control, hyperglycemic SHD-STZ, and hyperglycemic MLD-STZ conditions, respectively. dl Immunohistochemical staining for insulin (df, green), GLUT2 (gi, red), and insulin+GLUT2 (jl) of pancreata from control (d, g, j), hyperglycemic SHD-STZ (e, h, k) and MLD-STZ (f, i, l) animals 3 weeks post-administration of STZ confirms the downregulation of GLUT2 in STZ-treated animals. In (h, i), the islet is indicated by a broken line.
Fig. 6
Fig. 6. STZ administration leads to a decline in markers for β-cell function and maturity.
ad PDX1 (a, b) and MafA (c, d) immunohistochemistry on frozen pancreas sections showing islets from control (a, c) and from SHD-STZ (b, d) treated mice. Images are representative of three mice in each group. e, f Transmission electron microscopy images of islets isolated from control (e) and SHD-STZ mice (f), representative of islets from three mice per group. Note the apparent reduction of dense granules containing crystallized insulin in the islet from the SHD-STZ-treated animal. g Relative expression of genes associated to β-cell function, maturity and dedifferentiation determined by qRT-PCR of isolated islets from control and SHD-STZ mice (n = 5 and 7 mice for control and SHD-STZ, respectively). All samples were collected 3 weeks post-STZ administration. Error bars represent SD. *, **, ***, and **** represent P ≤ 0.05, ≤0.01, ≤0.001, and ≤0.0001 respectively.
Fig. 7
Fig. 7. Pancreas-wide GLUT2 downregulation following STZ-induced hyperglycemia is partially recovered by islet transplantation into the ACE.
a Blood glucose levels were measured during a period of 28 days after SHD-STZ (150 mg/kg) or vehicle injection. Four days after STZ administration, hyperglycemic mice were either syngeneically transplanted with ~100–150 islets into the ACE to restore normoglycemia (SHD-STZ + Tx), or left untransplanted (SHD-STZ). n (animals) = 13 for control, n = 15 for SHD-STZ, and n = 8 for SHD-STZ + Tx. Pancreata were harvested 28 days post-STZ administration for ex vivo OPT imaging or islet isolation. Gray shading represents normoglycemic levels, as defined by blood glucose concentration ≤ 12 mmol/L. b Analysis of GLUT2 expression in pancreatic islets reveals a partial recovery of GLUT2 expression in transplanted mice. Representative OPT renderings show pancreatic splenic lobes labeled for insulin (red), glucose transporter GLUT2 (blue), and overlay images (co-staining indicated by yellow color) in vehicle treated controls (n = 7), SHD-STZ (n = 8), and SHD-STZ + Tx (n = 4). c Quantitative assessment of the number of co-localizing voxels based on insulin and GLUT2 in control, SHD-STZ and SHD-STZ + Tx pancreata respectively. d Whole islet insulin content from isolated islets, normalized to DNA content. e Relative expression of genes associated to β-cell function, maturity and dedifferentiation determined by qRT-PCR on cDNA from isolated islets. d, e n = 5, 6, and 4 mice for vehicle control, SHD-STZ, SHD-STZ + Tx, respectively. Error bars represent SEM (a, c) or SD (d, e). *, **, ***, and ****represent P ≤ 0.05, ≤0.01, ≤0.001, and ≤0.0001 respectively.
Fig. 8
Fig. 8. Schematic model outlining processes leading to development of STZ-induced diabetes in mice.
According to our whole organ data, the reduction of BCM may be moderate in STZ diabetic mice subject to both SHD-STZ and MLD-STZ administration. Hence processes other than β-cell destruction are likely to constitute key determinative factors for the development of hyperglycemia, including a negative spiral of self-sustained β-cell impairment and a concomitant organ-wide downregulation of GLUT2 and other markers of β-cell function. By transplanting islets into the ACE, normoglycemia, and thereby endogenous β-cell functionality is partly restored (see “Discussion” for details).

Similar articles

Cited by

References

    1. Ahlqvist E, et al. Novel subgroups of adult-onset diabetes and their association with outcomes: a data-driven cluster analysis of six variables. Lancet Diabetes Endocrinol. 2018;6:361–369. - PubMed
    1. Lenzen S. The mechanisms of alloxan- and streptozotocin-induced diabetes. Diabetologia. 2008;51:216–226. - PubMed
    1. Tjalve H, Wilander E, Johansson EB. Distribution of labelled streptozotocin in mice: uptake and retention in pancreatic islets. J. Endocrinol. 1976;69:455–456. - PubMed
    1. Radenkovic M, Stojanovic M, Prostran M. Experimental diabetes induced by alloxan and streptozotocin: the current state of the art. J. Pharmacol. Toxicol. Methods. 2016;78:13–31. - PubMed
    1. King AJ. The use of animal models in diabetes research. Br. J. Pharmacol. 2012;166:877–894. - PMC - PubMed

Publication types

MeSH terms