. 2020 Oct;586(7827):120-126.
doi: 10.1038/s41586-020-2746-2. Epub 2020 Sep 23.

Functional genomic landscape of cancer-intrinsic evasion of killing by T cells

Affiliations

Functional genomic landscape of cancer-intrinsic evasion of killing by T cells

Keith A Lawson et al. Nature. 2020 Oct.

Abstract

The genetic circuits that allow cancer cells to evade destruction by the host immune system remain poorly understood1-3. Here, to identify a phenotypically robust core set of genes and pathways that enable cancer cells to evade killing mediated by cytotoxic T lymphocytes (CTLs), we performed genome-wide CRISPR screens across a panel of genetically diverse mouse cancer cell lines that were cultured in the presence of CTLs. We identify a core set of 182 genes across these mouse cancer models, the individual perturbation of which increases either the sensitivity or the resistance of cancer cells to CTL-mediated toxicity. Systematic exploration of our dataset using genetic co-similarity reveals the hierarchical and coordinated manner in which genes and pathways act in cancer cells to orchestrate their evasion of CTLs, and shows that discrete functional modules that control the interferon response and tumour necrosis factor (TNF)-induced cytotoxicity are dominant sub-phenotypes. Our data establish a central role for genes that were previously identified as negative regulators of the type-II interferon response (for example, Ptpn2, Socs1 and Adar1) in mediating CTL evasion, and show that the lipid-droplet-related gene Fitm2 is required for maintaining cell fitness after exposure to interferon-γ (IFNγ). In addition, we identify the autophagy pathway as a conserved mediator of the evasion of CTLs by cancer cells, and show that this pathway is required to resist cytotoxicity induced by the cytokines IFNγ and TNF. Through the mapping of cytokine- and CTL-based genetic interactions, together with in vivo CRISPR screens, we show how the pleiotropic effects of autophagy control cancer-cell-intrinsic evasion of killing by CTLs and we highlight the importance of these effects within the tumour microenvironment. Collectively, these data expand our knowledge of the genetic circuits that are involved in the evasion of the immune system by cancer cells, and highlight genetic interactions that contribute to phenotypes associated with escape from killing by CTLs.


Conflict of interest statement

Competing interests C.M.S., Z.P.F., J.A.K., S.M., D.M.S., C.J.S., V.D.J., L.T., R.S., J.E.G., G.A.S., G.A.K. and C.K. are employees of and have ownership interest in Agios Pharmaceuticals. This project was funded in part through a sponsored research agreement awarded to J.M. from Agios Pharmaceuticals. J.M. is a shareholder in Northern Biologics and Pionyr Immunotherapeutics, and is an advisor and shareholder of Century Therapeutics and Aelian Biotechnology. A.F. has received honoraria from Amgen, Abbvie, Janssen, Astellas, Sanofi, Bayer and TerSera (advisory boards and invited speakers), and research funds through a sponsored research agreement with Celsius Therapeutics. The remaining authors declare no competing interests.

Figures

Extended Data Fig. 1 |
Extended Data Fig. 1 |. Assessment of core and context-specific mouse fitness genes with the mTKO library.
a, Overlap of mouse core essential genes (mCEG0) and non-essential genes (mNEG), indicated in purple and green, respectively, that are orthologous to the corresponding human gene sets, as determined from either the Li or Söllner datasets. b, Mean fold change distributions of core essential genes (mCEG0) or non-essential genes (mNEG0) across the indicated screens at mid and end time points, where fold change is calculated as log2(normalized read counts from early or late time points) −log2(normalized T0 read counts). c, Precision-recall plots derived using the reference essential (mCEG0) and non-essential (mNEG) gene sets for the indicated screens. d, Number of genes with BF >5 at mid and late time points across all screens. e, Number of essential genes (BF >5) across the six cell lines assayed with the mTKO library. Genes in the mCEG0 or mNEG gene sets described in part A are indicated as purple or green stacks in their respective bars. f, Selected biological processes enriched or depleted in the mTKO core essential genes as defined by the mCEG1 gene set (FDR <5%). g, General biological properties of the mTKO core essential genes, plotted as fold-change of the mCEG1 gene set relative to reference non-essential genes. One sided Fisher’s exact test was used for calculating P values of disease genes and two-sample Kolmogorov-Smirmov test for other features. h, Overlap of mCEG1 genes with other reference essential gene lists from human, yeast and whole-organism mouse knockout studies. i, Correlation and unsupervised clustering of genotype-specific essential gene profiles across all cell lines and time points. j, BF scores for top 5 genotype-specific essential genes for each cell line. k, Pathways enriched at FDR < 5% uniquely in fewer than three cell lines, as identified by GSEA analysis on rank-ordered essential genes from each screen. l, Principal component analysis of transcriptomic data for replicate samples from each cell line.
Extended Data Fig. 2 |
Extended Data Fig. 2 |. Supplementary analysis of cancer-intrinsic CTL-evasion genes.
a, Rank-ordered NormZ scores at the end time point for all six CTL killing screens. Hits at FDR < 5% are highlighted in yellow (resistor genes) and blue (sensitizer genes). The top 10 resistor and sensitizer genes are indicated. Dots size inversely scaled by FDR. b, Number of drugZ sensitizing and suppressor hits at FDR <5% for each screen. c, Gene-level NormZ scores for Jak1, Jak2, B2m, Ifngr1 and Ifngr2 across all screens. Green box highlights FDR < 5% window for suppressor hits. d, Enrichment map showing resistance and sensitization pathways enriched in three or more cell lines using GSEA (FDR < 5%). e, Precision (that is, functional enrichment) versus genome coverage for gene pairs included in the co-similarity network at various hit thresholds (that is, number of times a gene is a hit at FDR < 5%). Precision is defined as the number of gene pairs co-annotated to a pathway for a given filtered dataset divided by the total number of co-annotated gene pairs in the Bader lab pathway database. Genome coverage is defined as the number of genes included in the filtered dataset over the total number of genes in the mouse genome. For each plotted dataset, consecutive circles represent 1,000 gene pairs. Triangles are shown for datasets with fewer than 1,000 gene pairs. For “all data” dataset, only the first 3,000 gene pairs are shown. f, The conditional log-likelihood score (LLS) of the first 1,000 gene pairs for each derived network at a given hit threshold.g, h, Enrichment for co-annotated gene pairs included in the co-similarity network derived from genes significant in at least three screens and time points using the KEGG and CORUM databases. i, Functional enrichment for co-annotated gene pairs within clusters across various cluster number thresholds. j, Correlation matrix depicting the mean Pearson correlation coefficient of all pairwise cluster combinations. Mean PCC were calculated across all individual gene pairs PCC in a given cluster. Representative pathways enriched in a cluster are shown at right (FDR < 1%). If no pathways were significantly enriched, the cluster number is displayed.
Extended Data Fig. 3 |
Extended Data Fig. 3 |. Supplementary analysis of core cancer-intrinsic CTL-evasion genes.
a, Differential log2-fold change results for secondary validation screens. CTL killing screens in six cell lines using a mini sgRNA library targeting all 182 core cancer-intrinsic CTL-evasion genes. Boxplots for major groups of genes in the validation library including resistor genes (n = 70), sensitizer genes (n = 140) and targeting controls (n = 182). Boxes show the interquartile range (IQR), with the median indicated by a line. The whiskers extend to the quartile ±1.5 × IQR. Statistical significance was determined by a two-sided Wilcoxon rank sum test between targeting control and resistor or sensitizer groups. b, Distribution of gene essentiality scores (Bayes Factors) for core cancer-intrinsic CTL evasion genes, reference essential (mCEG1), non-essential (mNEG) or all genes targeted by the mTKO library. c, Workflow for TCGA analysis. d, e, Spearman correlation coefficients between core cancer-intrinsic CTL-evasion genes and immune response surrogates using RNA-seq data from Pan-Cancer TCGA cohort samples (n = 5,708 and n = 6,935 for data retrieved with TCGA BioLinks (d) and Cancer Genomics Data Server (e), respectively). Sensitizers (n = 110 (TCGA Biolinks), n = 109 [CGDR]) and suppressors (n = 40 (TCGA Biolinks), n = 40 [CGDR]) were compared to random genes (n = 177 (TCGA Biolinks), n = 176 (CGDR)) using two-sided Wilcoxon rank-sum test and P values were adjusted using Benjamini-Hochberg correction, with P < 0.05 significance threshold. 27 genes were omitted from comparison owing to varying sensitizer/suppressor classifications across cancer lines, and 5 (TCGA Biolinks) or 6 (CGDR) omitted owing to incomplete data. Data points are gene-level correlations and boxplots show median (50th percentile; middle line), interquartile range (IQR; 25th to 75th percentiles; box edges) and distribution tails ( ± 1.5 × IQR; whiskers). f, g, Heat map of Spearman correlation coefficients between mRNA expression of each core intrinsic CTL-evasion gene and various immune response characteristics,,. Sensitizers (blue) and suppressors (yellow) are colour-coded accordingly. f, TCGA data obtained from Cancer Genomics Data Server(n = 6,935 samples); g, data from TCGA BioLinks (n = 5,708 samples). h, Plot of rank-summarized P-values and NormZ scores for strongest resistor and sensitizing core cancer-intrinsic CTL killing genes across all screens. Genes with −log10(Rank pVal) >3 plotted at 3 for display purpose.
Extended Data Fig. 4 |
Extended Data Fig. 4 |. Additional data for Adar.
a, Distribution of gene-level NormZ scores for all six CTL killing screens. Well-characterized core CTL killing genes including Socs1, Ptpn2 and Adar are indicated for each screen, and green boxes highlight the FDR <5% window for sensitizing hits. b, BF values for Adar across each cell line. c, Tumour burden in B16F10 bearing immunodeficient (left) or immunocompetent (right) mice following dox-induced shRNA-mediated knockdown of Adar (red) or control (black) (n = 10 mice per group). Error bars, s.e.m. Dox-treated mice are indicated by squares and non-treated controls are indicated by circles. d, qPCR analyses of Adar mRNA levels following dox-induced shRNA knockdown, as quantified by Taqman assay. Error bars, s.d.; technical triplicates of one experiment. Two-way ANOVA with Fisher’s LSD comparison.
Extended Data Fig. 5 |
Extended Data Fig. 5 |. Phenotypic effects following perturbation of Fitm2.
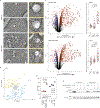
a, Overlap of core intrinsic CTL-evasion genes and hits from the Renca IFNγ screen. b, Per cent viability of Fitm2 or intergenic gRNA-transduced Renca-HA, B16-Ova or CT26-HA cells treated with escalating doses of antigen-specific (CL4) T cells or IFNγ. Error bars equal s.e.m. of indicated number (n) of independent experiments. For CT26HA panel, * denotes Fitm2–1 P-value <0.05. P-values determined by Two-way ANOVA with Fisher’s LSD comparison. c, Per cent viability of Fitm2 or intergenic gRNA-transduced human A375 cells treated with escalating doses of antigen-specific (WT-1) T cells. Data representative of 3 independent experiments, with line highlighting mean effect. P values determined by two-way ANOVA with Fisher’s LSD comparison. d, Microscopic views of Fitm2 (right panels) or intergenic (left panels) gRNA-transduced Renca cells after 72 h of IFNγ treatment shown ( lower panels). Untreated control cells are shown in the top panels. Data represent a single experiment. e, Expression of surface MHC-I by flow cytometry for B16-Ova cells transduced with Fitm2 or intergenic gRNAs and treated with IFNγ. Data representative of 4 independent experiments, with line highlighting mean effect. P values determined by two-way ANOVA with Fisher’s LSD comparison. f, Expression of surface MHC-I/Ova(SIINFEKL) by flow cytometry for B16-Ova cells transduced with Fitm2 or intergenic gRNAs and treated with IFNγ. Data representative of 4 independent experiments, with line highlighting mean effect. P values determined by two-way ANOVA with Fisher’s LSD comparison. g, Per cent viability of Fitm2 or intergenic gRNA-transduced RencaHA cells treated with increasing doses of TNF for 72 h. Errors bars equal s.e.m. of 5 independent experiments. For 100 ng ml−1 dose, * or ** denote P values <0.05 and <0.01, respectively, for Fitm2-2 and Fitm2-3, respectively. P values determined by two-way ANOVA with Fisher’s LSD comparison. Note: overlap of data for intergenic control with Fig. 3b.
Extended Data Fig. 6 |
Extended Data Fig. 6 |. Additional data for Fitm2.
a, TEM photo showing defective lipid droplet budding in Renca Fitm2Δ cells compared to WT cells. Data represents a single experiment. b, Sectored scatter plots of gene-level quantile normalized NormZ scores (qNormZ) from WT and Fitm2Δ cells propagated under CTL selection pressure. Significant negative and positive GIs (FDR < 5%) are coloured blue and yellow, respectively. Dashed line reflects median NormZ of GIs. c, Differential gene expression between IFNγ–treated (48 h) WT and Fitm2Δ B16–Ova cells (top) or Renca (bottom) cells highlighting downregulated (purple; B16 n = 589; Renca n = 668) and upregulated (orange; B16 n = 716; Renca n = 765) genes (FDR < 5%). Representative genes for the GO:BP ER stress pathway (GO:0034976) are labelled (B16 n = 31; Renca n = 40). For B16, polyclonal KO populations were used by transducing cells with sgFitm2 or sgIntergenic (control) guide RNAs. Clonal Fitm2Δ versus WT cells used for Renca. Side box plots display mean fold change (where fold change = log2(KO or WT read counts ± cytokine) − log2(WT read counts)) of ER stress pathway genes between Fitm2Δ, IFNγ treated or Fitm2Δ + IFNγ treatment conditions relative to WT cells. Boxes show the interquartile range (IQR, 25th to 75th percentile), with the median indicated by a line. The whiskers extend to the quartile ± 1.5 × IQR. Data representative of 3 independent biological replicates, and statistical significance was determined by a two-sided Student’s t-test between each treatment condition group. d, Xbp1 splicing in B16–Ova and Renca cells transduced with intergenic versus Fitm2 sgRNAs and treated with IFNγ for 48 h. Boxes show the interquartile range (IQR, 25th to 75th percentile), with the median indicated by a line. The whiskers extend to the quartile ± 1.5 × IQR. Data representative of 3 independent biological replicates, and comparisons were performed using pairwise two-sided t-tests with Holm’s multiple testing correction. e, Western blot of BiP protein in Renca WT and Fitm2Δ cells treated with escalating does of tunicamycin or IFNγ. Data representative of three independent experiments.
Extended Data Fig. 7 |
Extended Data Fig. 7 |. Phenotypic effects after perturbation of Atg12.
a, Distribution of gene-level NormZ scores for all six CTL killing screens. Core intrinsic CTL-evasion genes belonging to the autophagy (blue) and NF-κβ (red) pathways are indicated for each screen, and green boxes highlight the FDR < 5% window for sensitizing hits. b, Genetic co-similarity subnetwork showing genes (that is, interactors; red) with NormZ score profiles highly correlated to autophagy pathway genes (blue) across all screens at FDR < 5%. c, Microscopic views of Renca–HA cells transduced with sgRNAs against intergenic control sites or Atg12 and treated with TNF for 72 h. Data represents a single experiment. d, Per cent viability of Atg12 or intergenic gRNA-transduced cancer cells treated with escalating doses of antigen-specific T cells for 24 h. For all plots, error bars are s.e.m. For Renca–HA and EMT6–HA, data represent five independent experiments. For MC38, data represent one experiment with four technical replicates. P values determined by two-way ANOVA with Fisher’s LSD comparison. Note: overlap of data for Renca–HA with Fig. 3c, plotted separately here. e, Per cent viability of Atg12 or intergenic gRNA-transduced human A375 cells treated with increasing doses of antigen-specific (WT-1) T cells. Data representative of 5 independent experiments, with line highlighting mean effect. P values determined by two-way ANOVA with Fisher’s LSD comparison. f, Viability of MC38-Ova cells transduced with gRNAs targeting Atg12 or intergenic control sites and treated with naive (left) or preactivated (right) OT-1 T cells with or without anti-TNF blocking antibodies. Error bars are s.e.m. of a single experiment with at least four technical replicates. P values determined by two-way ANOVA with Fisher’s LSD comparison.
Extended Data Fig. 8 |
Extended Data Fig. 8 |. Chemical inhibition of autophagy synergizes with TNF treatment in a subset of human cancer cell lines.
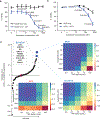
Viability of MC38-OVA (a) and A375 (b) cells treated with antigen-specific T cells (OT-I at 5:1 and WT1 at 10:1 E:T ratios, respectively) and increasing concentrations of autophinib. n = 3 and 5 independent experiments. Error bars, s.e.m. (a, b). P values determined by two-way ANOVA with Fisher’s LSD comparison. c, Rank order of 91 cancer cell lines by their sensitivity synergy score to co-treatment with recombinant TNF (ranging from 0 to 100 U ml−1) and autophinib (ranging from 0 to 1,000 mM). Heat maps represent μ/μmax for all combinations in selected cell lines (MC38, A375 and NIH-2170) at 72 h after treatment. n = technical duplicates for each individual condition across all cell lines.
Extended Data Fig. 9 |
Extended Data Fig. 9 |. Additional data for Atg12.
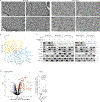
a, TEM photo showing increased number of autophagosomes (purple) and mitochondria (green) in Renca Atg12Δ cells compared to WT cells. Data represents a single experiment. b, Sectored scatter plots of gene-level quantile normalized NormZ scores (qNormZ) from WT and Atg12Δ cells propagated under CTL selection pressure. Significant negative and positive GIs (FDR < 5%) are coloured blue and yellow, respectively. Dashed line reflects median NormZ of GIs. c, Western blot depicting levels of select autophagy, NF-κβ and Nrf2 pathway-associated proteins in isogenic Renca–HA WT, Atg12Δ or Atg7Δ cells, as well as intergenic or Atg12 gRNA-transduced polyclonal KO Renca cell populations. Data represent a single experiment reflective of 3 independent biological replicates. d, Differential gene expression between TNF-treated WT and Atg12Δ Renca cells highlighting downregulated (purple; n = 190) and upregulated (orange; n = 251) genes (FDR < 0.05). Representative genes for the Reactome NF-κβ pathway (R-HSA-975138.1) are labelled (n = 12). Side box plots display mean fold change (where fold change = log2(KO or WT read counts ± cytokine) − log2(WT read counts)) of ER stress pathway genes between Atg12Δ, TNF-treated or Atg12Δ + TNF treatment conditions relative to WT cells. Boxes show the interquartile range (IQR, 25th to 75th percentile), with the median indicated by a line. The whiskers extend to the quartile ± 1.5 × IQR. Data representative of 3 independent biological replicates, and statistical significance was determined by a two-sided Student’s t-test between each treatment condition group.
Extended Data Fig. 10 |
Extended Data Fig. 10 |. Analysis of in vivo essential genes.
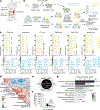
a, Hierarchical clustering of gene-level rank distributions. NCG and BALB/c were pooled and only early time point data was considered. Individual genes were ranked according to normalized gRNA counts within each mouse sample, and the resulting gene-level ranks were pooled across mice and hierarchically clustered using Jensen-Shannon divergence. Clusters were defined through adaptive branch pruning. b, Characteristic gene-rank distributions for each cluster. Pink and turquoise clusters were classified as putative essentials. c, Identifying bona fide in vivo essential genes among putative in vivo essential gene clusters. Rank distributions of putative essential genes (identified in a, b) were stratified by mouse strain (brown, BALB/c; grey, NCG); strain-dependent differences were evaluated using two-sided Wilcoxon rank sum test and P values were Benjamini–Hochberg-adjusted. Genes were then ranked by P value, and genes for which rank distributions were consistent between strains (that is, FDR > 0.001) were classified as in vivo essential genes. Insets: Comparison of strain-dependent rank distributions for representative in vivo non-essential gene (B2m) and essential gene (Cd47). d, Rank plot of in vivo essentials stratified by pink and turquoise clusters. Underlined genes are those that were also classified as essentials in in vitro EMT6 screens. e, Overlap between essential genes found in in vitro and in vivo EMT6 screens. In vitro essential genes were identified at BF > 50, and in vivo essential genes were those belonging to pink and turquoise clusters shown in a and b, and exhibiting strain-independent rank distributions as shown in c.
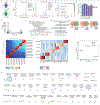
Fig. 1 |
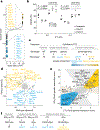
Fig. 1 |. Mapping core genes and pathways for cancer-intrinsic CTL evasion.
a, Mouse cell lines screened in this study. Renca, renal carcinoma; B16, melanoma; 4T1 and EMT6, breast carcinoma; CT26 and MC38, colorectal carcinoma. HA and Ova refer to haemagglutinin and ovalbumin antigens, respectively. Cell lines with the C57BL/6 genotype are in grey, and those with the BALB/c genotype are in black. b, Workflow for mTKO genome-scale pooled CRISPR screens to identify fitness and CTL-evaslon genes. E:T, effector-to-target cell ratio; KO, knockout. The essential gene and non-essential gene distributions are based on gene-level fold-change values, where fold change = log2(normalized read counts at early or late time points) − log2(normalized T0 read counts). c, Rank-ordered normalized z-score (NormZ score) at the mid time point for all six CTL killing screens. Hits at FDR < 5% are highlighted in yellow (resistor genes) and blue (sensitizer genes). The top ten resistor and sensitizer genes are indicated. Dot size is inversely scaled by FDR. d, Genetic co-similarity map for cancer-intrinsic CTL evasion. Representative pathways enriched in a cluster are shown on the diagonal axis (FDR < 1%). ETC, electron transport chain; PCC, Pearson correlation coefficient. e, Daisy model of gene essentiality, adapted for core cancer-intrinsic CTL-evasion genes. Each cancer cell line is represented as a petal on the flower. f, Distribution of cancer-intrinsic CTL-evasion genes at FDR < 5% across the six cell lines. g, Pathway themes enriched in core cancer-intrinsic CTL-evasion genes (FDR < 5%). −log10(P) represents the −log10 of the adjusted P value (FDR). Mean percentage overlap refers to the mean of the percentage of overlapping core cancer-intrinsic CTL-evasion and pathway-definition genes across all pathways in a theme. For each theme, the mean number of query genes contained in the pathway/mean pathway term size is displayed to the right of each bar.
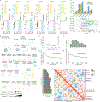
Fig. 2 |
Fig. 2 |. IFNγ resistance is a conserved cancer-intrinsic mechanism of CTL evasion.
a, Gene-level NormZ scores for genome-wide CRISPR screen in wild-type Renca cells propagated in the presence or absence of IFNγ (10 ng ml−1). Hits at FDR < 5% are highlighted in yellow (resistor genes) and blue (sensitizer genes), and the top ten genes are indicated for each category. Dot size is inversely scaled by FDR. b, Viability of B16–Ova cells transduced with gRNAs that target Fitm2 or intergenic control sites and treated with preactivated OT-1 T cells (CTLs) with or without anti-IFNγ blocking antibodies. Results shown are from a single experiment with three technical replicates. Data are representative of three independent biological replicates. Horizontal lines indicate the mean. P values were determined by two-way analysis of variance (ANOVA) with Fisher’s least significant difference (LSD) comparison. P values indicated in black are significant, in contrast to those in grey, which are not significant. c, Schematic outlining genotype-to-phenotype relationship. Positive genetic interactions occur when fitness is better than expected, and are shown in yellow (masking or suppression). Negative genetic interactions occur when fitness is worse than expected, and are shown in blue (sick or synthetic lethal). d, Sectored scatter plot of gene-level quantile-normalized z-scores (qNormZ) from wild-type and Fitm2Δ cells propagated under IFNγ selection pressure. Significant negative and positive genetic interactions (FDR < 5%) are coloured blue and yellow, respectively. Dashed lines indicate median NormZ scores of genetic interactions. e, Sunbeam plot of differential gene-level Fitm2 genetic-interaction scores under IFNγ versus CTL selection pressure. Ellipse (black dashed line), 5% FDR threshold delineated by normal ellipse fit to differential scores. Principal axes (grey dashed lines), lines projecting in direction of each sector (0°, 45°, 90°, 135°, 180°, 225°, 270°, 315°). Sector, area spanning ±22.5° of each sector principal axis: blue and yellow sectors represent consistent hits across both conditions; grey sector represents cytokine-specific effects; tan sector represents CTL-specific effects. Data point sizes are scaled by Euclidean distance from origin. f, Schematic outlining select genetic interactions with Fitm2. AtgΔ, autophagy mutants.
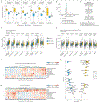
Fig. 3 |
Fig. 3 |. A hub of autophagy and NF-κβ signalling mediates cancer-intrinsic CTL evasion.
a, Gene-level NormZ scores for genome-wide CRISPR screen in wild-type Renca cells propagated in the presence or absence of TNF (10 ng ml−1). Hits at FDR < 5% are highlighted in yellow (resistor genes) and blue (sensitizer genes), and the top ten genes are indicated for each category. Dot size is inversely scaled by FDR. b, Viability of Renca–HA cells transduced with gRNAs that target Atg12, Tbk1 or intergenic control sites after treatment with increasing doses of TNF. Data are mean ±s.e.m. of four (Tbk1) or 5 (intergenic, Atg12) independent experiments. P values were determined by two-way ANOVA with Fisher’s LSD comparison. c, Viability of Renca–HA cells transduced with gRNAs that target Atg12 or intergenic control sites and treated with CTLs with or without anti-TNF blocking antibodies. Data are representative of five independent experiments. Horizontal lines indicate the mean. P values were determined by two-way ANOVA with Fisher’s LSD comparison. P values indicated in black are significant, in contrast to those in grey, which are not significant. d, Sectored scatter plot of gene-level qNormZ scores between wild-type and Atg12Δ cells propagated under TNF selection pressure. Significant negative and positive genetic interactions (FDR < 5%) are coloured blue and yellow, respectively. Dashed lines indicate median NormZ scores of genetic interactions. e, Sunbeam plot of differential gene-level Atg12 genetic-interaction scores under TNF versus CTL selection pressure. Plot features (that is, ellipse, principal axes and sectors) are as described in Fig. 2e. Data point sizes are scaled by Euclidean distance from origin. f, Schematic outlining select genetic interactions with Atg12.
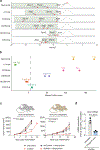
Fig. 4 |
Fig. 4 |. In vivo screen validates the role of autophagy as a cancer-intrinsic CTL-evasion pathway.
a, Experimental set-up for in vivo CRISPR screen. T refers to time point measured in days after the establishment of the mixed population of EMT6 knockout cells. b, Gene-level differential rank between tumours engrafted in BALB/c mice and those engrafted in NCG mice, at early and late time points. Hits at FDR < 5% are highlighted in yellow (resistor genes) and blue (sensitizer genes), markers are scaled by −log10(FDR) and genes validated from the in vitro screen are underlined. c, Tumour-level analysis showing distributions and rug plots of differential gRNA ranks for all BALB/c compared to all NCG tumours, targeting autophagy and control genes at early and late time points. The top green and red distributions represent tumour-level data at early and late time points, respectively. In the rug plots (bottom), grey lines indicate targeting control gRNAs and green and red lines represent the average gRNA rank for the indicated gene, for each tumour. Vertical dotted black lines represent the median of control gRNAs. Statistical significance between the autophagy and control genes was determined by two-sided Wilcoxon rank sum test with Benjamini–Hochberg correction (FDR). d, gRNA-level analysis showing distributions and rug plots. Top graphs show differential fold change (FC) distributions for early and late tumour time points in different mouse genetic backgrounds (mean(FCBALB/c) − mean(FCNCG)), where FCBALB/c = log2(BALB/c read counts at early or late time points) − log2(BALB/c T6-normalized T0 read counts) and FCNCG = log2(NCG read counts at early or late time points) − log2(NCG T6-normalized T0 read counts). The rug plots show differential fold change for individual gRNAs that target autophagy and control genes between tumours engrafted in BALB/c mice and those engrafted in NCG mice, at early and late time points. The grey lines indicate targeting control gRNAs. Vertical dotted black lines represent the mean of control gRNAs. Statistical significance between the autophagy and control genes was determined by one-sided Wilcoxon rank-sum test with Holm’s multiple testing correction (FDR). FDR values equal to or below 0.01 are indicated in bold.

Comment in

Similar articles

Cited by

References

    1. Chen DS & Mellman I Elements of cancer immunity and the cancer-immune set point. Nature 541, 321–330 (2017). - PubMed
    1. Hegde PS & Chen DS Top 10 challenges in cancer immunotherapy. Immunity 52, 17–35 (2020). - PubMed
    1. Binnewies M et al. Understanding the tumor immune environment (TIME) for effective therapy. Nat. Med. 24, 541–550 (2018). - PMC - PubMed
    1. Hugo W et al. Genomic and transcriptomic features of response to anti-pd-1 therapy in metastatic melanoma. Cell 165, 35–44 (2016). - PMC - PubMed
    1. Rooney MS, Shukla SA, Wu CJ, Getz G & Hacohen N Molecular and genetic properties of tumors associated with local immune cytolytic activity. Cell 160, 48–61 (2015). - PMC - PubMed

Publication types