

A prognostic model composed of four long noncoding RNAs predicts the overall survival of Asian patients with hepatocellular carcinoma
- PMID: 32946170
- PMCID: PMC7433813
- DOI: 10.1002/cam4.3275
A prognostic model composed of four long noncoding RNAs predicts the overall survival of Asian patients with hepatocellular carcinoma
Abstract
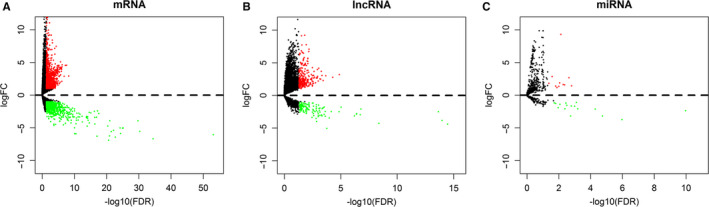
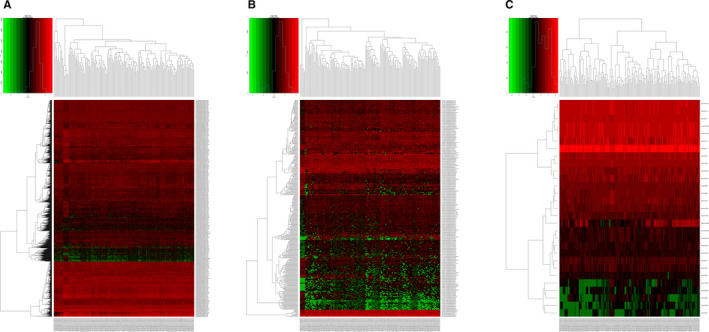
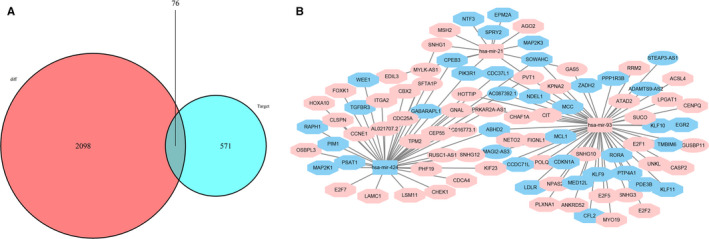
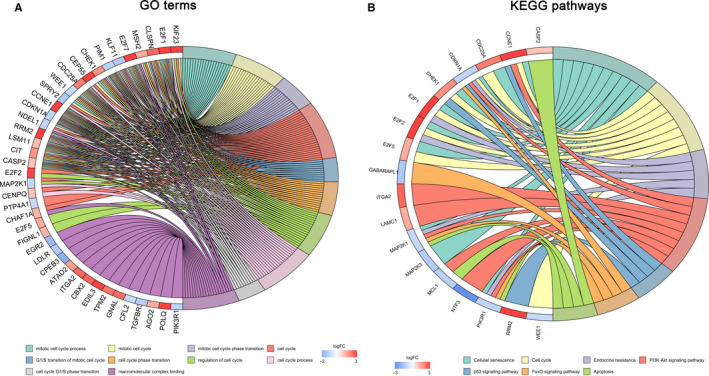
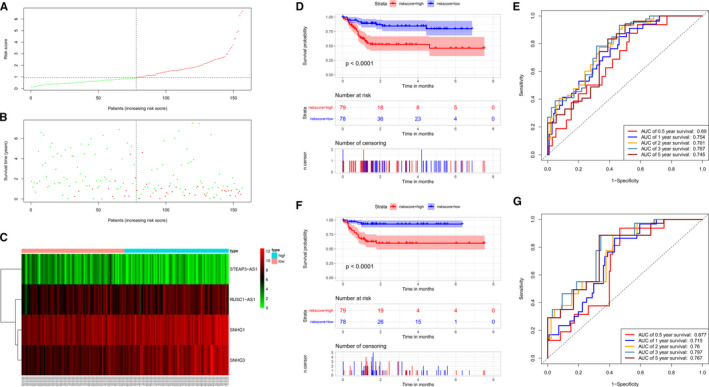
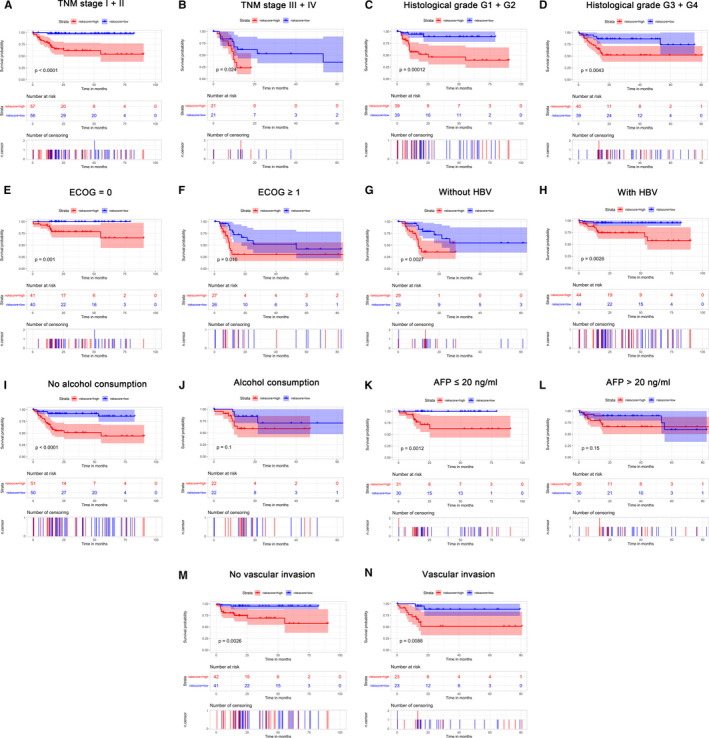
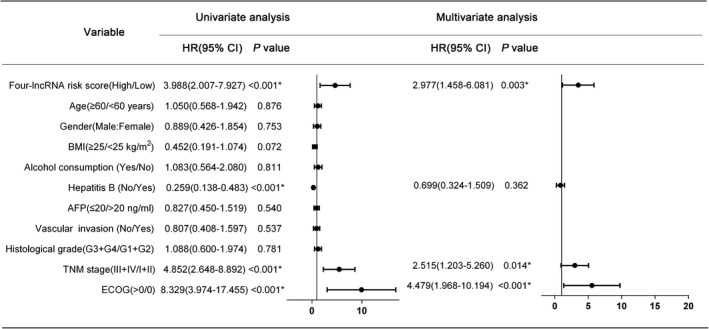
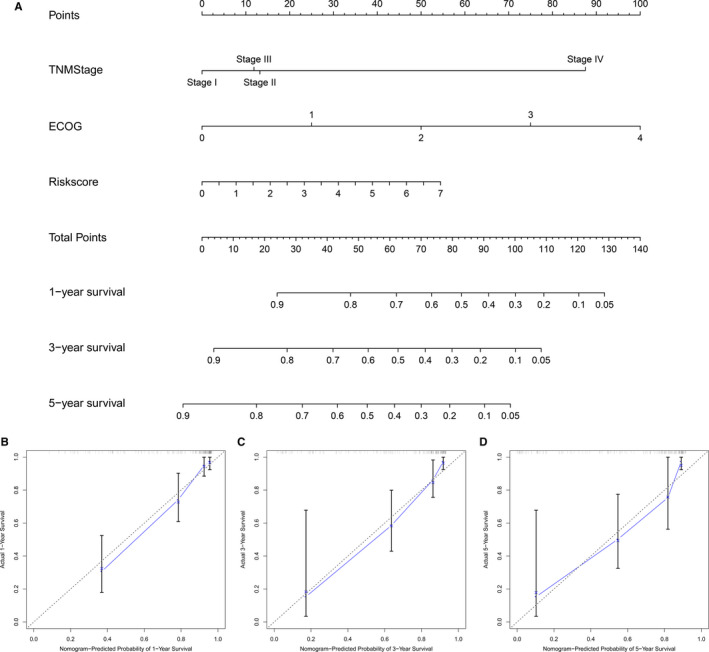
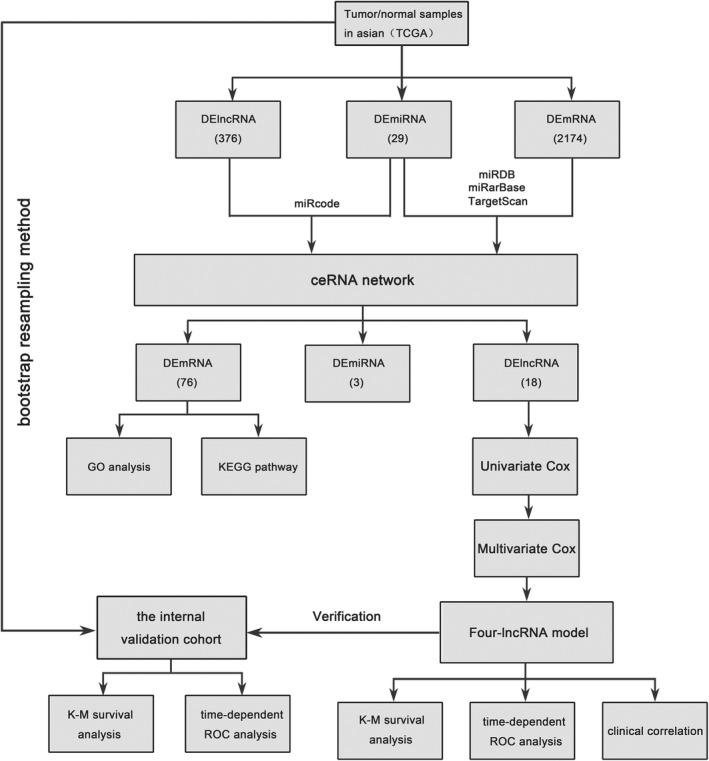
Based on accumulating evidence, long noncoding RNAs (lncRNAs) are potential biomarkers and therapeutic targets for many diseases, including tumors. In this study, we consulted The Cancer Genome Atlas (TCGA) database to explore the functions and modulatory mechanisms of lncRNAs as competing endogenous RNAs (ceRNAs) in hepatocellular carcinoma (HCC) in Asian patients and constructed a risk scoring system composed of four lncRNAs (SNHG1, STEAP3-AS1, RUSC1-AS1, and SNHG3) to predict the outcomes of Asian patients with HCC. The prognostic value of this risk model was validated in the internal validation cohort (n = 157). The stratified survival analysis revealed good performance for the risk model in stratifying clinical features. According to the Cox proportional hazard regression analysis, the four-lncRNA risk model is an independent prognostic model for Asian patients with HCC. Finally, we developed a nomogram that integrates prognostic signals and other clinical information to predict 1-, 3-, and 5-year overall survival rates. In conclusion, the prognostic lncRNAs identified in our study exerted potential biological effects on the development of HCC. The risk scoring model based on four lncRNAs may be an effective classification tool for assessing the prognosis of Asian patients with HCC.
Keywords: TCGA; ceRNA; hepatocellular carcinoma; lncRNA; overall survival; risk score.
© 2020 The Authors. Cancer Medicine published by John Wiley & Sons Ltd.
Conflict of interest statement
The authors have declared that no competing interest exists.
Figures
Similar articles
-
Identification of a five-long non-coding RNA signature to improve the prognosis prediction for patients with hepatocellular carcinoma.World J Gastroenterol. 2018 Aug 14;24(30):3426-3439. doi: 10.3748/wjg.v24.i30.3426. World J Gastroenterol. 2018. PMID: 30122881 Free PMC article.
-
Integrated analysis of a competing endogenous RNA network reveals key long noncoding RNAs as potential prognostic biomarkers for hepatocellular carcinoma.J Cell Biochem. 2019 Aug;120(8):13810-13825. doi: 10.1002/jcb.28655. Epub 2019 Apr 15. J Cell Biochem. 2019. PMID: 30989713
-
Genome-Wide Analysis of Prognostic lncRNAs, miRNAs, and mRNAs Forming a Competing Endogenous RNA Network in Hepatocellular Carcinoma.Cell Physiol Biochem. 2018;48(5):1953-1967. doi: 10.1159/000492519. Epub 2018 Aug 9. Cell Physiol Biochem. 2018. PMID: 30092571
-
Construction of a ceRNA network and a genomic-clinicopathologic nomogram to predict survival for HBV-related HCC.Hum Cell. 2021 Nov;34(6):1830-1842. doi: 10.1007/s13577-021-00607-y. Epub 2021 Sep 6. Hum Cell. 2021. PMID: 34487338
-
Six-long non-coding RNA signature predicts recurrence-free survival in hepatocellular carcinoma.World J Gastroenterol. 2019 Jan 14;25(2):220-232. doi: 10.3748/wjg.v25.i2.220. World J Gastroenterol. 2019. PMID: 30670911 Free PMC article.
Cited by
-
LncRNA RUSC1-AS1 promotes osteosarcoma progression through regulating the miR-340-5p and PI3K/AKT pathway.Aging (Albany NY). 2021 May 28;13(16):20116-20130. doi: 10.18632/aging.203047. Epub 2021 May 28. Aging (Albany NY). 2021. PMID: 34048366 Free PMC article.
-
A new marker constructed from immune-related lncRNA pairs can be used to predict clinical treatment effects and prognosis: in-depth exploration of underlying mechanisms in HNSCC.World J Surg Oncol. 2023 Aug 17;21(1):250. doi: 10.1186/s12957-023-03066-x. World J Surg Oncol. 2023. PMID: 37592311 Free PMC article.
-
Loss of SNORA73 reprograms cellular metabolism and protects against steatohepatitis.Nat Commun. 2021 Sep 1;12(1):5214. doi: 10.1038/s41467-021-25457-y. Nat Commun. 2021. PMID: 34471131 Free PMC article.
-
Construction of a prognostic model for disulfidptosis-related long noncoding RNAs in R0 resected hepatocellular carcinoma and analysis of their impact on malignant behavior.BMC Cancer. 2024 Aug 29;24(1):1068. doi: 10.1186/s12885-024-12816-3. BMC Cancer. 2024. PMID: 39210306 Free PMC article.
-
Neutrophils and Lymphocytes Can Help Distinguish Asymptomatic COVID-19 From Moderate COVID-19.Front Cell Infect Microbiol. 2021 Oct 15;11:654272. doi: 10.3389/fcimb.2021.654272. eCollection 2021. Front Cell Infect Microbiol. 2021. PMID: 34722325 Free PMC article.
References
-
- Bray F, Ferlay J, Soerjomataram I, Siegel RL, Torre LA, Jemal A. Global cancer statistics 2018: GLOBOCAN estimates of incidence and mortality worldwide for 36 cancers in 185 countries. CA Cancer J Clin. 2018;68(6):394–424. - PubMed
-
- Siegel R, Ma J, Zou Z, Jemal A. Cancer statistics, 2014. CA Cancer J Clin. 2014;64(1):9–29. - PubMed
-
- Torre LA, Bray F, Siegel RL, Ferlay J, Lortet‐Tieulent J, Jemal A. Global cancer statistics, 2012. CA Cancer J Clin. 2015;65(2):87–108. - PubMed
MeSH terms
Substances
LinkOut - more resources
Full Text Sources
Medical
