. 2020 Nov;37(11):2743-2756.
doi: 10.1007/s10815-020-01946-9. Epub 2020 Sep 15.

Mitochondrial metabolic substrate utilization in granulosa cells reflects body mass index and total follicle stimulating hormone dosage in in vitro fertilization patients

Affiliations

Mitochondrial metabolic substrate utilization in granulosa cells reflects body mass index and total follicle stimulating hormone dosage in in vitro fertilization patients

Richard J Kordus et al. J Assist Reprod Genet. 2020 Nov.

Abstract

Purpose: To utilize a novel mitochondrial function assay with pooled granulosa cells to determine whether mitochondrial function would differ by patient demographics and embryo development.

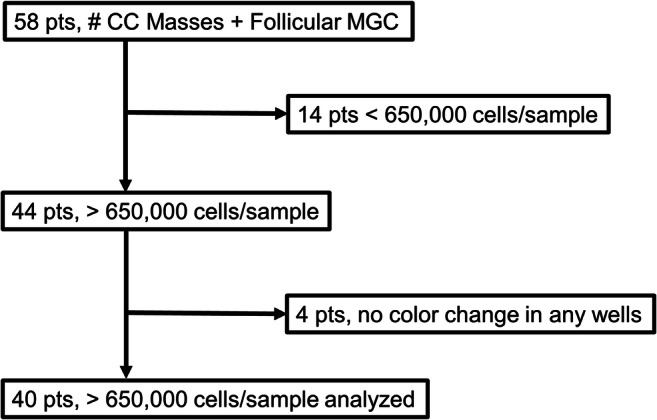
Methods: This was a prospective pilot study in a hospital-based assisted reproductive program and public university. Mitochondrial metabolic substrate utilization was assessed in pooled granulosa cells from 40 women undergoing in vitro fertilization during 2018 and 2019.

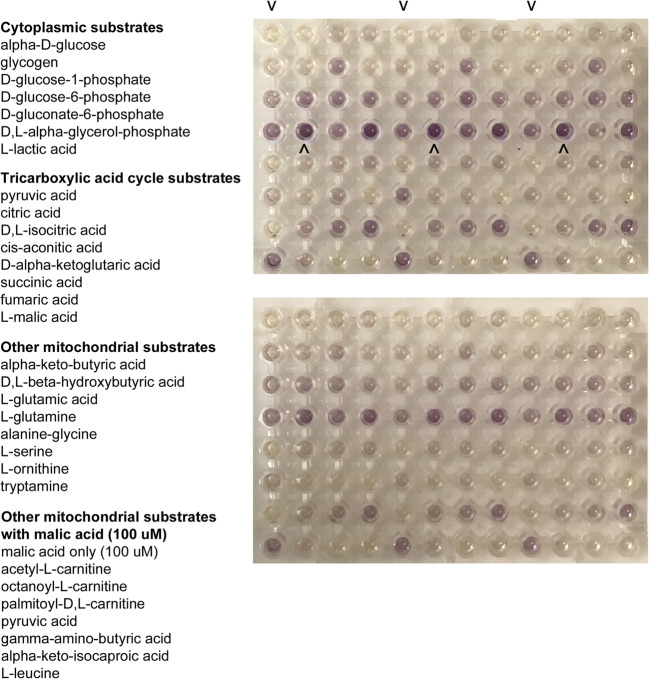
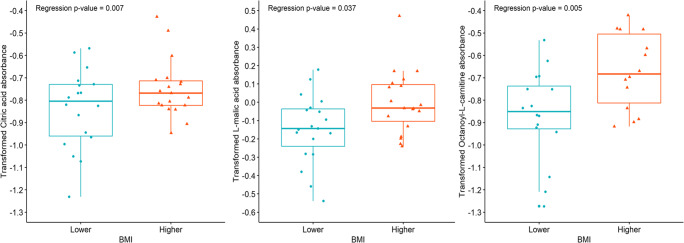
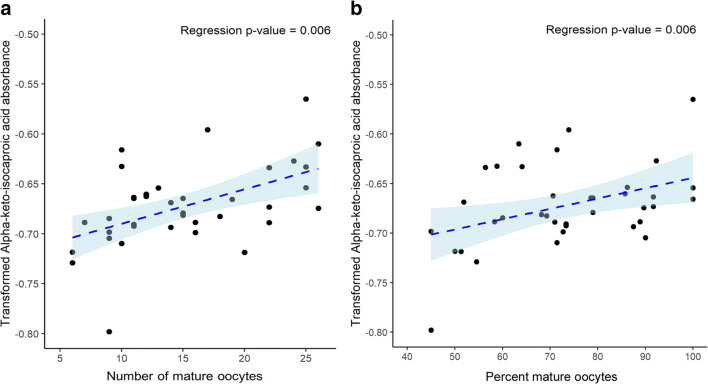
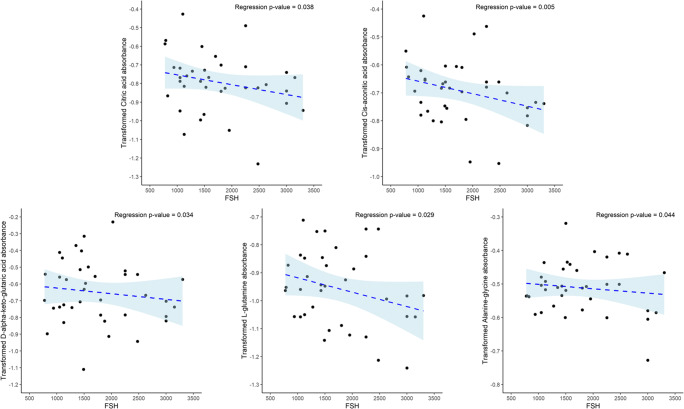
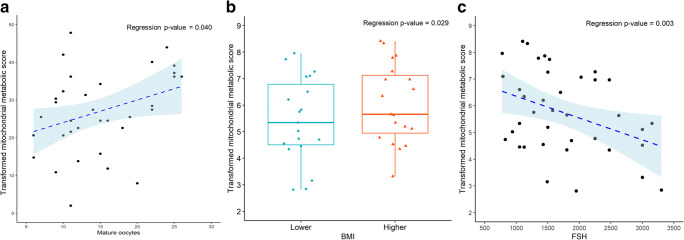
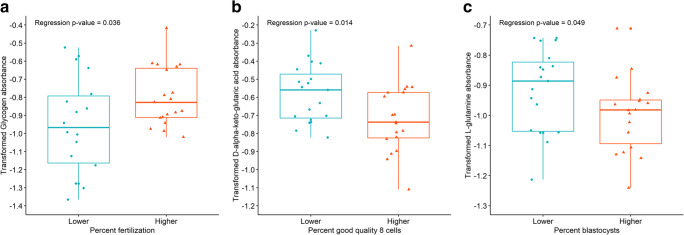
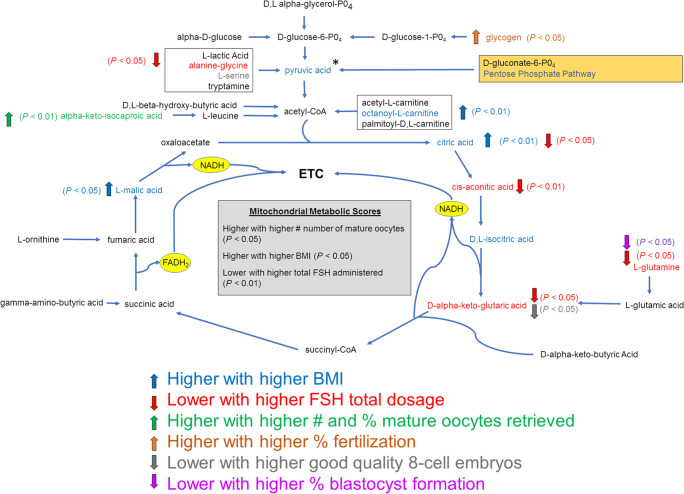
Results: Assessment of mitochondrial substrate metabolism in pooled granulosa cells revealed higher citric acid, L-malic acid, and octanoyl-L-carnitine utilization with higher body mass index (BMI). Utilization of citric acid, cis-aconitic acid, D-alpha-keto-glutaric acid, L-glutamine, and alanine plus glycine was significantly lower as total dosage of FSH administered increased. Utilization of glycogen was significantly higher in patients with a higher percentage of fertilized oocytes. D-alpha-keto-glutaric acid utilization was significantly lower in patients with a higher percentage of good 8-cell embryos. L-glutamine utilization was significantly lower, with a higher percentage of blastocyst formation. Mitochondrial metabolic scores (MMS), which reflect overall mitochondrial activity of the granulosa pool, were significantly higher in patients with higher BMI and with greater numbers of mature oocytes retrieved. MMS in granulosa decreased as total FSH dose administered increased.

Conclusions: Granulosa cell utilization of substrates feeding into the citric acid cycle changed with total FSH dosage and BMI. Fertilization rate, 8-cell embryo quality, and blastocyst formation also associated with different energy substrate usage. Mitochondrial substrate utilization by granulosa cells from individual follicles could be further developed into a useful diagnostic tool.

Keywords: Citric acid cycle; Granulosa cells; In vitro fertilization; Mitochondrial function assay; Mitochondrial metabolic score; Mitochondrial substrate utilization.


Conflict of interest statement

The authors declare no conflict of interest related to this study.

Figures

Fig. 1
Fig. 1
Flow diagram summarizing the study population from oocyte retrieval to the final outcome. Oocytes, cumulus cell (CC) masses, and mural granulosa cells (MGCs) were collected from 58 patients (pts). Individual CC masses from each oocyte collected (n = 817) were combined with the MGCs from each patient to form the granulosa pool. Eighteen patients were excluded from analyses due to insufficient number of cells for assay or no signal in positive control wells of the mitochondrial function assay yielding a final number of patients for analyses n = 40
Fig. 2
Fig. 2
Two representative mitochondrial functional assays using Mitoplate S-1 and pooled granulosa cells from individual patients. The assay plates contained the individual 31 cytoplasmic and mitochondrial metabolic substrates as the sole energy source in wells, and wells were repeated in triplicate. The substrates are listed to the left. As the cells metabolized the energy source and produced NADH or FADH2, a tetrazolium dye in the medium was proportionately reduced, generating a purple color. Color development was measured by absorbance using a kinetic assay over 2 h. The top two rows indicate no substrate controls (v) and cytoplasmic substrates. Rows 3, 4 contain mitochondrial substrates, including positive control (^) succinic acid. Rows 5, 6 contain other mitochondrial substrates, and 7,8 contain other mitochondrial substrates in the presence of 100 μM malic acid
Fig. 3
Fig. 3
Substrates that demonstrated significant mitochondrial utilization differences based on body mass index (BMI). To determine the differences in mitochondrial utilization, substrates were compared using a multiple linear regression model using Box-Cox transformation between BMI groups. BMI was divided into 2 groups with the higher group being patients with a BMI of ≥ to 26 kg/m2 (n = 20) and the lower group being patients with a BMI of <26 kg/m2 (n = 20). Mitochondrial utilization of citric acid (P < 0.01), L-malic acid (P < 0.05), and octanoyl-L-carnitine (P < 0.01) were found to be significantly higher in pooled GCs of patients with higher BMI, after adjusting for the other factors in the model. Following the Box-Cox transformation of the data and observing the Q-Q plots, the most outlying observations have been removed to ensure the normality of the response variables. Data are presented as the median (line inside box), first and third quartile (bottom and top of the box), and highest and lowest data points (top and bottom of whiskers)
Fig. 4
Fig. 4
Substrates that demonstrated significant mitochondrial utilization differences based on A) the number of mature oocytes retrieved and B) the percent mature oocytes retrieved from each patient. To determine the differences in mitochondrial utilization, substrates were compared using a multiple linear regression model using Box-Cox transformation. Individuals with a greater number of mature oocytes and percent mature oocytes retrieved were found to have a significant increase in alpha-keto-isocaproic acid mitochondrial utilization (P < 0.01) in pooled GCs of patients, after adjusting for the other factors in the model. Following the Box-Cox transformation of the data and observing the Q-Q plots, the most outlying observations have been removed to ensure the normality of the response variables. Data are presented as a scatter plot of the individual patient values lambda transformed for normalization showing the trend line and the 95% confidence interval
Fig. 5
Fig. 5
Substrates that demonstrated significant mitochondrial utilization differences based on total FSH dose administered. To determine the differences in mitochondrial utilization, substrates were compared using a multiple linear regression model using Box-Cox transformation. Mitochondrial utilization for citric acid (P < 0.05), cis-aconitic acid (P < 0.01), D-alpha-keto-glutaric acid (P < 0.05), L-glutamine (P < 0.05), and alanine-glycine (P < 0.05) in pooled GCs of patients were found to be significantly lower as the total FSH dose administered increased, after adjusting for the other factors in the model. Following the Box-Cox transformation of the data and observing the Q-Q plots, the most outlying observations have been removed to ensure the normality of the response variables.. Data are presented as a scatter plot of the individual patient values lambda transformed for normalization showing the trend line and the 95% confidence interval
Fig. 6
Fig. 6
Mitochondrial metabolic scores, a measure of overall mitochondrial substrate utilization, demonstrated significant differences based on BMI, total FSH dose, and the number of mature oocytes retrieved. Mitochondrial substrate utilization was based on the estimated multiple linear regression model using observed data. A) Mitochondrial metabolic scores were found to be significantly higher in GCs of patients with higher numbers of mature oocytes retrieved (P < 0.05), after adjusting for the other factors in the model. In a backward selected best fit model using only the BMI and total FSH dosage administered, B) mitochondrial metabolic scores were found to be significantly higher in pooled GCs of patients with a higher BMI (P < 0.05). BMI was divided into 2 groups with the higher group being patients with a BMI of ≥ to 26 kg/m2 (n = 20) and the lower group being patients with a BMI of <26 kg/m2 (n = 20). C) Mitochondrial metabolic scores were found to be significantly lower as the patient’s FSH dose administered increased (P < 0.01). Following the Box-Cox transformation of the data and observing the Q-Q plots, the most outlying observations have been removed to ensure the normality of the response variables. For BMI, data are presented as the median (line inside box), first and third quartile (bottom and top of the box), and highest and lowest data points (top and bottom of whiskers) for mature oocytes retrieved and FSH dose administered, data are presented as a scatter plot of the individual patient values were lambda transformed for normalization showing the trend line and the 95% confidence interval
Fig. 7
Fig. 7
Substrates that demonstrated significant individual mitochondrial substrate utilization differences based on a patient’s embryo cohort development. To determine the differences in mitochondrial utilization, substrates were compared using a multiple linear regression model using Box-Cox transformation. Cohorts were grouped as follows, higher fertilization percentage ≥ 80% (n = 22), and lower fertilization percentage < 80% (n = 18); higher good 8-cell development >55% (n = 22) and lower good 8-cell development ≤55% (n = 18); and higher percentage of blastocyst formation >55% (n = 17) and lower percentage of blastocyst formation ≤55% (n = 22). One patient was excluded from the blastocyst formation data as she had an embryo transfer on day 3 with no additional embryos available for extended culture. A) Mitochondrial utilization of glycogen (P < 0.05) was found to be significantly higher in GCs of patients with higher fertilization percentage, B) mitochondrial utilization of D-alpha-keto-glutaric acid (P < 0.05) was found to be significantly lower in GCs from patients with a higher percentage of good quality 8-cell embryos, after adjusting for the other factors in the model. C) In a backward selected best fit model using only the percentage of good 8-cell embryos and percentage of blastocysts, mitochondrial utilization of L-glutamine (P < 0.05) was found to be significantly lower in GCs from patients with a higher percentage of blastocyst formation. Following the Box-Cox transformation of the data and observing the Q-Q plots, the most outlying observations have been removed to ensure the normality of the response variables. Data are presented as the median (line inside box), first and third quartile (bottom and top of the box), and highest and lowest data points (top and bottom of whiskers)
Fig. 8
Fig. 8
Summary diagram showing substrates of the mitochondrial function assay and where they enter the metabolic pathways and the citric acid cycle, and their association with patient and oocyte endpoints. The substrates were metabolized through different biochemical pathways by entering the mitochondria through different transporters and they were then modified by various enzymes and dehydrogenases in granulosa cells to produce NADH or FADH2. BMI = body mass index, ETC = electron transport chain, FADH2 = flavin adenine dinucleotide hydride, FSH = follicle stimulating hormone, NADH = nicotinamide adenine dinucleotide hydride, * indicates substrate in combination with 100 μM L-malic acid

Similar articles

Cited by

References

    1. Margulis L. Archaeal-eubacterial mergers in the origin of Eukarya: phylogenetic classification of life. Proc Natl Acad Sci U S A. 1996;93(3):1071–1076. doi: 10.1073/pnas.93.3.1071. - DOI - PMC - PubMed
    1. Seyfried TN, Shelton LM. Cancer as a metabolic disease. Nutr Metab (Lond). 2010;7:7. doi:10.1186/1743-7075-7-7. - PMC - PubMed
    1. Veatch JR, McMurray MA, Nelson ZW, Gottschling DE. Mitochondrial dysfunction leads to nuclear genome instability via an iron-sulfur cluster defect. Cell. 2009;137(7):1247–1258. doi: 10.1016/j.cell.2009.04.014. - DOI - PMC - PubMed
    1. Boucret L, JM CdlB, Moriniere C, Desquiret V, Ferre-L'Hotellier V, Descamps P et al. Relationship between diminished ovarian reserve and mitochondrial biogenesis in cumulus cells. Hum Reprod. 2015;30(7):1653–64. doi:dev114 [pii];10.1093/humrep/dev114. - PubMed
    1. Pawlak P, Chabowska A, Malyszka N, Lechniak D. Mitochondria and mitochondrial DNA in porcine oocytes and cumulus cells--a search for developmental competence marker. Mitochondrion. 2016;27:48–55. doi: 10.1016/j.mito.2015.12.008. - DOI - PubMed

LinkOut - more resources