. 2020 Aug 8;10(22):9970-9983.
doi: 10.7150/thno.46639. eCollection 2020.

Induced pluripotent stem cells-derived microvesicles accelerate deep second-degree burn wound healing in mice through miR-16-5p-mediated promotion of keratinocytes migration

Affiliations

Induced pluripotent stem cells-derived microvesicles accelerate deep second-degree burn wound healing in mice through miR-16-5p-mediated promotion of keratinocytes migration

Yuan Yan et al. Theranostics. .

Abstract

Background: Induced pluripotent stem cells (iPSCs) have emerged as a promising treatment paradigm for skin wounds. Extracellular vesicles are now recognized as key mediators of beneficial stem cells paracrine effects. In this study, we investigated the effect of iPSCs-derived microvesicles (iPSCs-MVs) on deep second-degree burn wound healing and explored the underlying mechanism. Methods: iPSCs-MVs were isolated and purified from conditioned medium of iPSCs and confirmed by electron micrograph and size distribution. In deep second-degree burn model, iPSCs-MVs were injected subcutaneously around wound sites and the efficacy was assessed by measuring wound closure areas, histological examination and immunohistochemistry staining. In vitro, CCK-8, EdU staining and scratch assays were used to assess the effects of iPSCs-MVs on proliferation and migration of keratinocytes. Next, we explored the underlying mechanisms by high-throughput microRNA sequencing. The roles of the miR-16-5p in regulation of keratinocytes function induced by iPSCs-MVs were assessed. Moreover, the target gene which mediated the biological effects of miR-16-5p in keratinocytes was also been detected. Finally, we examined the effect of local miR-16-5p treatment on deep second degree-burns wound healing in mice. Results: The local transplantation of iPSCs-MVs into the burn wound bed resulted in accelerated wound closure including the increased re-epithelialization. In vitro, iPSCs-MVs could promote the migration of keratinocytes. We also found that miR-16-5p is a critical factor in iPSCs-MVs-induced promotion of keratinocytes migration in vitro through activating p38/MARK pathway by targeting Desmoglein 3 (Dsg3). Finally, we confirmed that local miR-16-5p treatment could boost re-epithelialization during burn wound healing. Conclusion: Therefore, our results indicate that iPSCs-MVs-derived miR-16-5p may be a novel therapeutic approach for deep second-degree burn wound healing.

Keywords: burn wound healing; iPSCs; miR-16-5p; microvesicles; migration.


Conflict of interest statement

Competing Interests: The authors have declared that no competing interest exists.

Figures

Figure 1
Figure 1
Characterization of iPSCs-MVs. (A) The transmission electron microscope (TEM) image of iPSCs-MVs. Scale bar = 200 nm (B) Nanoparticle tracking analysis (NTA) result of iPSCs-MVs. Mean diameter of iPSCs-MVs was 214.6 ± 8.3 nm. (C) Microvesicles marker proteins TSG101, ARF6 and Annexin A1 were identified by western blot. Calnexin was used as an internal reference.
Figure 2
Figure 2
Retention of iPSCs-MVs in skin tissues. (A) Representative images of iPSCs-MVs incorporation in skin tissues on days 1 after wounding. Scale bar = 50 µm. (B) Representative fluorescence imaging of mice wounds treated with PKH67-labeled iPSCs-MVs or PBS on days 1, 3, and 5 after wounding.
Figure 3
Figure 3
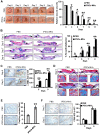
iPSCs-MVs accelerate deep second-degree burn wound healing and promote keratinocytes migration in vivo. (A) Representative macroscopic images of wounds treated with PBS or iPSCs-MVs on days 0, 3, 5, 7, 9 and 11 after wounding (left panel). Quantitative analysis of wound area per group, expressed as the percentage of the initial wound size at day 0 (right panel). n = 6 mice per group. (B) Representative photomicrographs of H&E-stained wounds per group on days 0, 3, 5, 7 and 9 after wounding. Black arrows represent the dermal border; green arrows represent the epidermal margin (left panel). Scale bar = 200 µm. Quantitative profiles of the re-epithelialization ration of wounds (right panel). The re-epithelialization was calculated as described in Materials and Methods. (C) Representative photomicrographs of α-SMA immunostaining of wounds per group on days 5 and 9 after wounding (left panel). Scale bar = 50 µm. The areas stained with α-SMA were determined by planimetric image analysis using Image Pro Plus 6.0 software (right panel). (D) Representative photomicrographs of Masson's trichrome-stained wounds per group on days 5 and 9 after wounding. (E) Representative photomicrographs of CD31 immunostaining of wounds per group on days 11 after wounding (left panel). Scale bar = 50 µm. The numbers of stained capillaries were counted (right panel). Statistics regarding the number of stained capillaries were obtained using five randomly selected fields of view for each group. (F) Representative photomicrographs of CD68 immunostaining of wounds per group on days 3 and 5 after wounding (left panel). Scale bar = 50 µm. The areas stained with CD68 were determined by planimetric image analysis using Image Pro Plus 6.0 software (right panel). All values are expressed as mean ± SD from three independently repeats, *P < 0.05, **P < 0.01 compared with control.
Figure 4
Figure 4
iPSCs-MVs promote keratinocytes migration in vivo. (A) Quantitative profiles of the length of epithelial tongues of wounds treated with PBS or iPSCs-MVs on days 3, 5, 7 and 9. (B) Representative photomicrographs of K6 immunostaining of wounds treated with PBS or iPSCs-MVs on days 3 and 5 after wounding (left panel). Scale bar = 50 µm. The areas stained with K6 were determined by planimetric image analysis using Image Pro Plus 6.0 software (right panel). All values are expressed as mean ± SD from three independently repeats. *P < 0.05, **P < 0.01 compared with control.
Figure 5
Figure 5
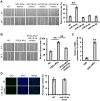
iPSCs-MVs are taken up by HaCaT cells and promote keratinocytes migration in vitro. (A) Representative fluorescence imaging of HaCaT cells incubated with either PBS or PKH67-labeled iPSCs-MVs for 10 h. Scale bar = 100 µm. (B) The proliferative ability of HaCaT cells treated with PBS or different concentrations of iPSCs-MVs (0.25, 0.5, 1, or 2 µg/mL) was measured by CCK-8 assay. (C) Representative fluorescence imaging of EdU staining of HaCaT cells treated with PBS or different concentrations of iPSCs-MVs (0.25, 0.5, 1, or 2 µg/mL) for 24 h (left panel). Scale bar = 100 µm. The proliferation rates were quantified by percentage of EdU-positive HaCaT cells (right panel). (D) Scratch wound healing assays were performed to assess the migration rate of HaCaT cells treated with PBS or different concentrations of iPSCs-MVs (0.25, 0.5, 1, or 2 µg/mL) for 24 h. Photographs were taken at 24 h after scratch injury (left panel). Scale bar = 200 µm. The healing rates were quantified by measuring the area of the injured region (right panel). All values are expressed as mean ± SD from three independently repeats. **P < 0.01 compared with control.
Figure 6
Figure 6
iPSCs-MVs-derived miR-16-5p promotes keratinocytes migration in vitro. (A) Scratch wound healing assays were performed to detect the migration of HaCaT cells transfected with miR-16-5p mimics, miR-19b-3p mimics, miR-93-5p mimics, miR-23a-3p mimics or miRNA mimics negative control (mimics NC) for 48 h. Photographs were taken at 24 h after scratch injury (left panel). Scale bar = 200 µm. The healing rates were quantified by measuring the area of the injured region (right panel). (B) Scratch wound healing assays were performed to assess the migration rate of keratinocytes transfected with miR-16-5p inhibitor for 48 h in the absence or presence of iPSCs-MVs. Photographs were taken at 24 h after scratch injury (left panel). Scale bar = 200 µm. The healing rates were quantified by measuring the area of the injured region (right panel). (C) The miR-16-5p expression was detected in HaCaT cells after incubation with iPSCs-MVs for 24 h by qRT-PCR. (D) Representative fluorescence imaging of EdU staining of HaCaT cells treated with mimics NC or miR-16-5p mimics for 48 h (left panel). Scale bar = 200 µm. The proliferation rates were quantified by percentage of EdU-positive HaCaT cells (right panel). All values are expressed as mean ± SD from three independently repeats, **P < 0.01 compared with control.
Figure 7
Figure 7
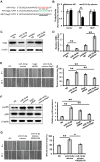
miR-16-5p promotes keratinocytes migration by targeting Dsg3. (A) Predicted miR-16-5p target sequences in Dsg3 3'-UTR in human and positions of mutated nucleotides in the 3'UTR of DSG3. (B) Luciferase reporter assay determined luciferase activity in 293T cells co-transfected with miR-16-5p mimics and psiCHECK-Dsg3-wt-3'UTR (WT) or psiCHECK-Dsg3-mut-3'UTR (MUT). (C) Western blot analysis of Dsg3 expression in HaCaT cells transfecting mimics negative control (mimics NC), miR-16-5p mimics or miR-16-5p inhibitor, β-actin was used as the loading control. (D) qRT-PCR analysis of Dsg3 expression in HaCaT cells transfecting miR-16-5p mimics or miR-16-5p inhibitor. (E) Scratch wound healing assays were performed to assess the migration rate of HaCaT cells transfected with Dsg3 siRNA, miR-16-5p mimics, or miR-16-5p mimics plus pcDNA3.1-Dsg3 for 48 h. Photographs were taken at 24 h after scratch injury (left panel). Scale bar = 200 µm. The healing rates were quantified by measuring the area of the injured region (right panel). (F) Western blot analysis of p-p38 and p38 expression in HaCaT cells transfected with Dsg3 siRNA, miR-16-5p mimics, or miR-16-5p mimics plus pcDNA-Dsg3 for 48 h. β-actin was used as the loading control. (G) Scratch wound healing assays were performed to assess the migration rate of in HaCaT cells transfected with miR-16-5p mimics in the absence or presence of p38MAPK-specific inhibitor SB202190. Photographs were taken at 24 h after scratch injury (left panel). Scale bar = 200 µm. The healing rates were quantified by measuring the area of the injured region (right panel). All values are expressed as mean ± SD from three independently repeats, *P < 0.05, **P < 0.01.
Figure 8
Figure 8
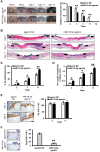
In vivo delivery of miR-16-5p accelerates deep second-degree burn wound healing in mice. (A) Representative macroscopic images of wounds treated with miRNA agomir negative control (agomir NC) or miR-16-5p agomir on days 0, 3, 7, 11 and 14 after wounding. (left panel). Quantitative analysis of wound area per group, expressed as the percentage of the initial wound size at day 0 (right panel). n = 6 mice per group. (B) Representative photomicrographs of H&E-stained wounds treated with agomir NC or miR-16-5p agomir on days 3, 7 and 11 after wounding. Black arrows represent the dermal border; green arrows represent the epidermal margin. Scale bar = 200 µm. (C) Quantitative profiles of the re-epithelialization ration of wounds per group. (D) Quantitative profiles of the length of epithelial tongues of wounds per group. (E) Representative photomicrographs of immunohistochemical staining for K6 of wounds treated with agomir NC or miR-16-5p agomir on day 3 and 5 after wounding (left panel). Scale bars = 50 µm. The areas stained with K6 were determined by planimetric image analysis using Image Pro Plus 6.0 software. (F) Representative photomicrographs of immunohistochemical staining for Dsg3 of wounds treated with agomir NC or miR-16-5p agomir on days 5 after wounding (left panel). The areas stained with Dsg3 were determined by planimetric image analysis using Image Pro Plus 6.0 software (right panel). Scale bar = 100 µm. All values are expressed as mean ± SD from three independently repeats, *P < 0.05, **P < 0.01.

Similar articles

Cited by

References

    1. Eming SA, Martin P, Tomic-Canic M. Wound repair and regeneration: mechanisms, signaling, and translation. Sci Transl Med. 2014;6:265sr6. - PMC - PubMed
    1. Martin P, Nunan R. Cellular and molecular mechanisms of repair in acute and chronic wound healing. Br J Dermatol. 2015;173:370–8. - PMC - PubMed
    1. Velnar T, Bailey T, Smrkolj V. The wound healing process: an overview of the cellular and molecular mechanisms. J Int Med Res. 2009;37:1528–42. - PubMed
    1. Kirana S, Stratmann B, Prante C, Prohaska W, Koerperich H, Lammers D. et al. Autologous stem cell therapy in the treatment of limb ischaemia induced chronic tissue ulcers of diabetic foot patients. Int J Clin Pract. 2012;66:384–93. - PubMed
    1. Kawamoto A, Katayama M, Handa N, Kinoshita M, Takano H, Horii M. et al. Wound therapy by marrow mesenchymal cell transplantation. Plast Reconstr Surg. 2008;121:860–77. - PubMed

Publication types

MeSH terms