. 2020 Sep 11;20(1):873.
doi: 10.1186/s12885-020-07376-1.

Chemotherapy-induced release of circulating-tumor cells into the bloodstream in collective migration units with cancer-associated fibroblasts in metastatic cancer patients

Affiliations

Chemotherapy-induced release of circulating-tumor cells into the bloodstream in collective migration units with cancer-associated fibroblasts in metastatic cancer patients

Nerymar Ortiz-Otero et al. BMC Cancer. .

Abstract

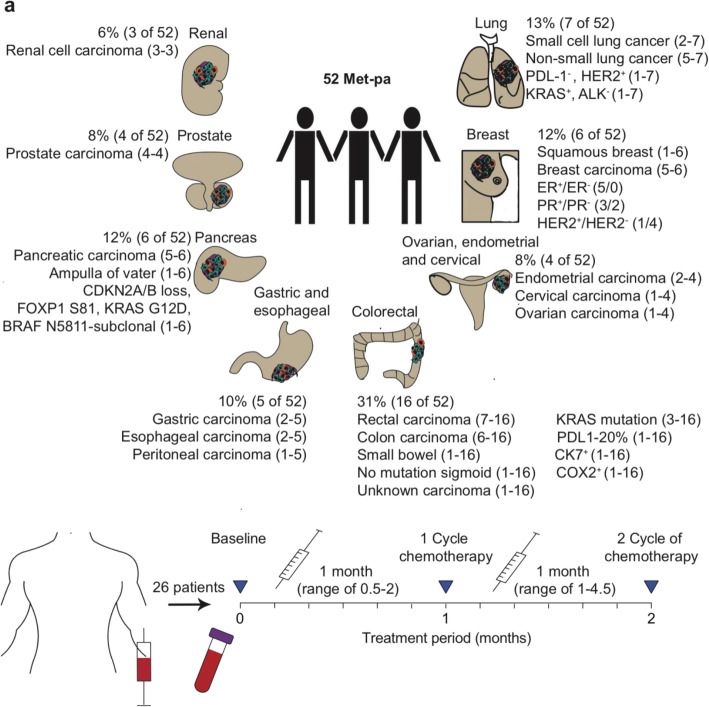
Background: Recent studies have shown that chemotherapy destabilizes the blood vasculature and increases circulating tumor cell (CTC) influx into the circulation of metastatic cancer patients (Met-pa). CTCs are a precursor of cancer metastasis, in which they can migrate as single CTCs or as CTC clusters with stromal cells such as cancer-associated fibroblasts (CAFs) as cell aggregates.

Methods: Blood samples were collected from 52 Met-pa, and the number of CTC and CAF was determined along with the temporal fluctuation of these through the chemotherapy treatment.

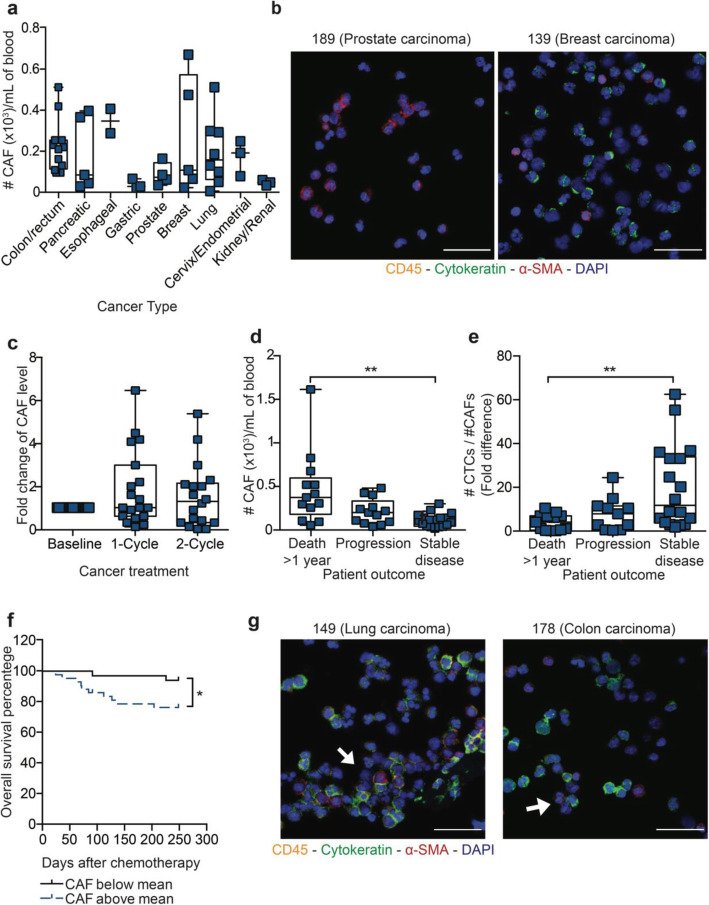
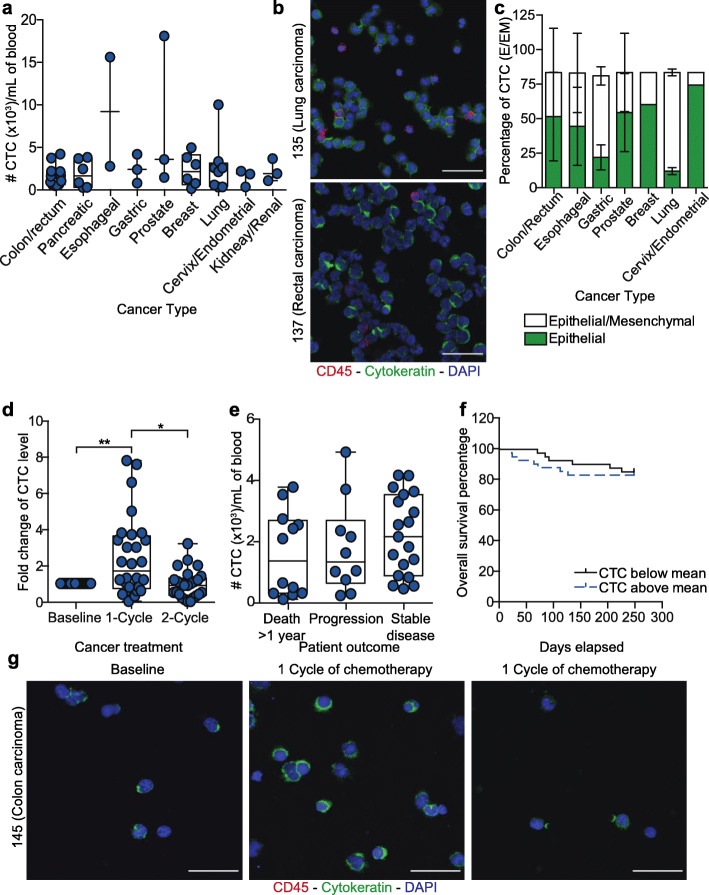
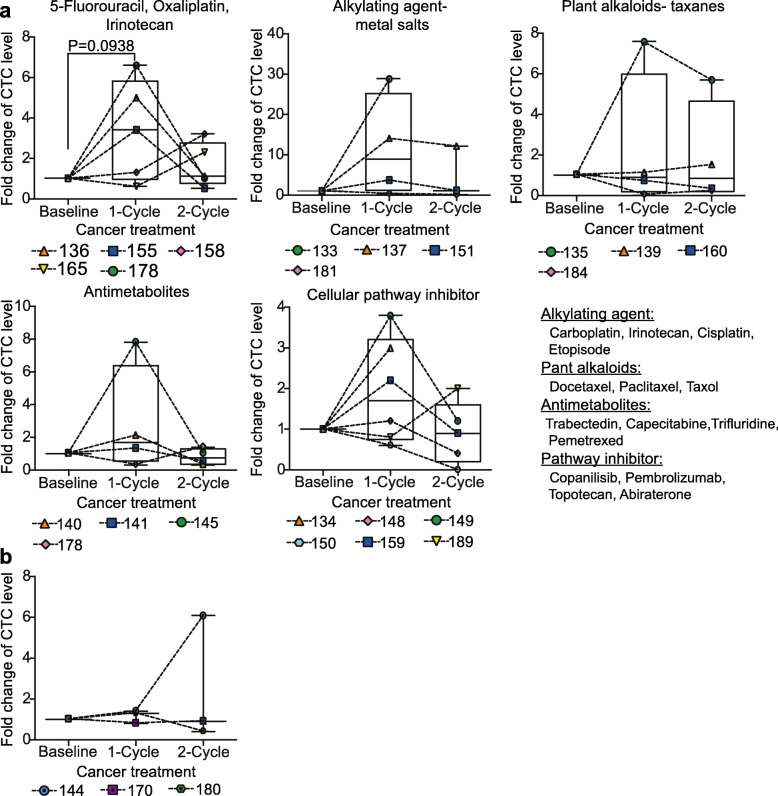
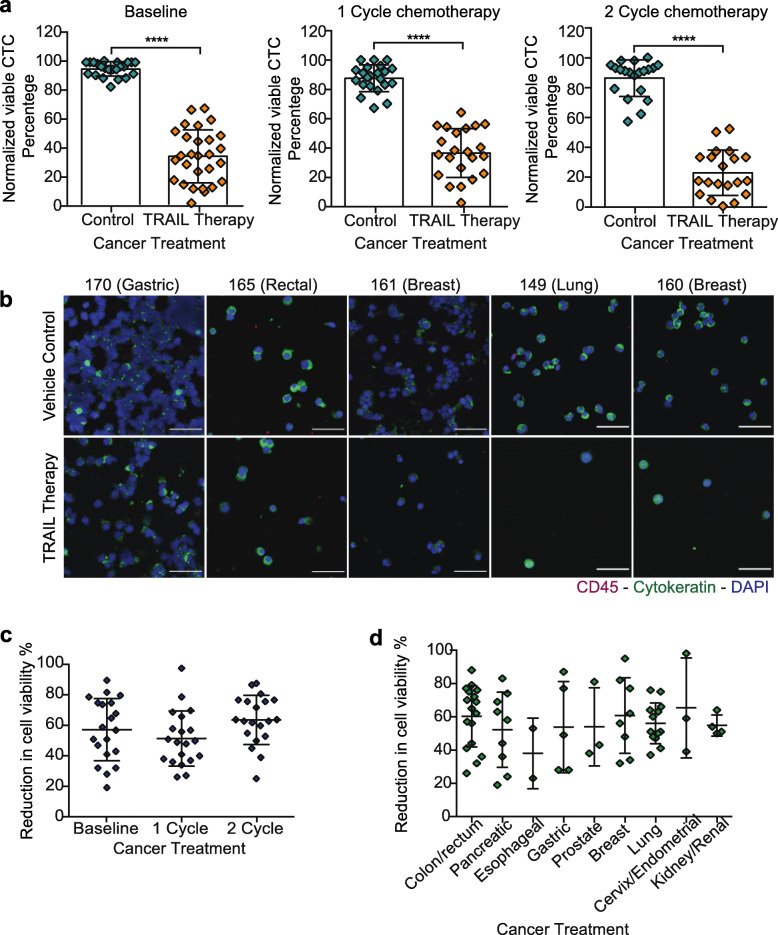
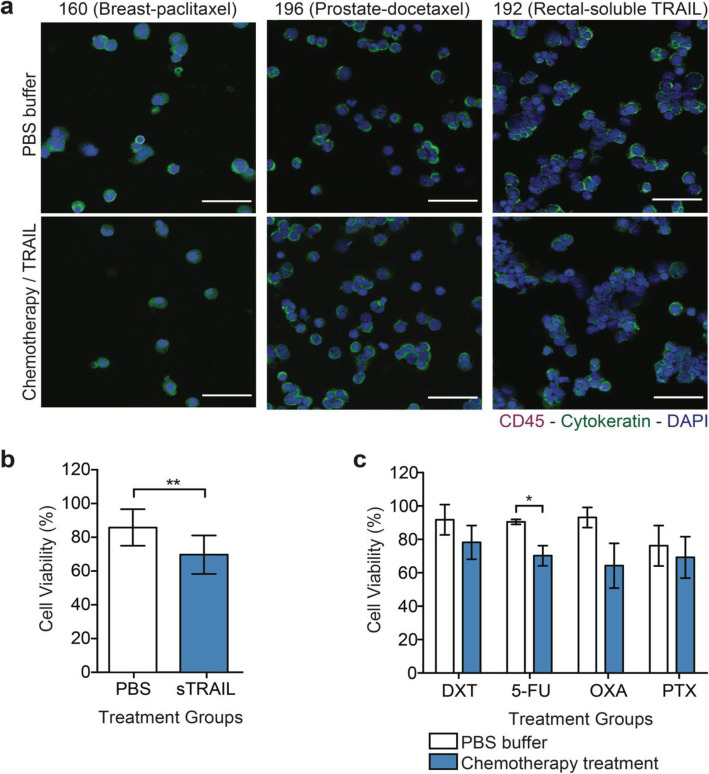
Results: In this study, CTC level was found to increase two-fold from the initial level after 1 cycle of chemotherapy and returned to baseline after 2 cycles of chemotherapy. Importantly, we determined for the first time that circulating CAF levels correlate with worse prognosis and a lower probability of survival in Met-pa. Based on the CTC release induced by chemotherapy, we evaluated the efficacy of our previously developed cancer immunotherapy to eradicate CTCs from Met-pa blood using an ex vivo approach and demonstrate this could kill over 60% of CTCs.

Conclusion: Collectively, we found that CAF levels in Met-pa serve as a predictive biomarker for cancer prognosis. Additionally, we demonstrate the efficacy of our therapy to kill primary CTCs for a range of cancer types, supporting its potential use as an anti-metastasis therapy in the clinical setting.

Keywords: Cancer prognosis; Cancer-associated fibroblast; Chemotherapy; Circulating tumor cells; TRAIL-based liposomal therapy.


Conflict of interest statement

The authors have no competing interests to disclose.

Figures

Fig. 1
Fig. 1
Diagram that display the blood collection from Met-pa and their clinical background information. a Blood samples were collected from a total of 52 patients diagnosed with a spectrum of cancer types at metastatic stage, including: renal, prostate, pancreatic, gastric, esophageal, colorectal, ovarian, endometrial, cervical, breast and lung carcinoma. From these 52 patients, 26 were followed through chemotherapy treatment. This figure was created by the authors for this article
Fig. 2
Fig. 2
Fluctuation of CAF level in Met-pa receiving chemotherapy treatment. a Scatter dot plot represents baseline CAF counts found in blood samples from Met-pa across a spectrum of cancer types (median ± SD, N = 44 from 45 patients). b Immunofluorescence photomicrographs of CAFs isolated from blood samples (CD45 is yellow, α-SMA is red, cytokeratin is green and DAPI is blue). Scale bar is 40 μm. c Box and whisker charts show the fold change in CAF counts after the patients received 1 and 2 cycles of chemotherapy (median ± range, N = 58 from 23 patients). No significant increase of CAF counts (P < 0.7436) after chemotherapy treatment was determined using a Friedman test. d Box and whisker plots represents CAF counts with respect to the clinical outcome of Met-pa (median ± range, N = 44 from 44 patients). Significance of CAF level (**P = 0.0017) in the cancer prognosis was calculated using a Kruskal-Wallis test. e Box and whisker plots represent the fold change of CTC/CAF counts in the Met-pa (median ± range, N = 44 from 44 patients). Significance of CTC:CAF ratio (**P = 0.0057) in the cancer prognosis was calculated using a one-way ANOVA test. f Survival curve represents the overall survival percentage of Met-pa based on the CAF count at baseline using the mean value for CAF counts (N = 44 from 44 patients). Significant effect of CAF counts (*P = 0.0223) in predicting the survival probability for Met-pa was determined using a Log-rank (Mantel-Cox) test. g Immunofluorescence photomicrographs of CAFs incorporated in CTC aggregates (CD45 is yellow, α-SMA is red, cytokeratin is green and DAPI is blue). Scale bar is 40 μm
Fig. 3
Fig. 3
Fluctuation of CTC levels in Met-pa receiving chemotherapy. a Scatter dot plot represents the CTC levels in Met-pa with a spectrum of cancer types (median ± range, N = 48 from 48 patients). b Immunofluorescent photomicrograph of CTCs isolated from 2 patients with metastatic rectal and lung cancer (CD45 is red, cytokeratin is green and DAPI is blue). Scale bar is 40 μm. c Stack column charts represent the percentage of CTCs displaying epithelial (E) and both (E/M) phenotypes across cancer type (mean, N = 24 from 12 patients). d Box and whisker charts display the fold change in CTC levels after chemotherapy (median ± range, N = 83 from 30 patients). Significance increase of CTC counts (**P = 0.0047 and *P = 0.0103) after chemotherapy was calculated using a Wilcoxon test. e Box and whisker plots display the CTC levels at baseline in patients with different outcomes (death 1–12 months, disease progression but alive at 12 months, stable disease at 12 months) (median ± range, N = 48 from 48 patients). CTC levels were not significantly different (P = 0.3143) between the death within 1–12 months and stable disease groups, as calculated with a Kruskal-Wallis test. f Survival curve displays the overall survival percentage of Met-pa based on the initial CTC level. The mean value of CTC counts was used for the survival curve (N = 48 from 48 patients). Non-significant effect of CTC counts (P = 0.4492) in predicting the survival probability for Met-pa was determined using a Log-rank (Mantel-Cox) test. g Immunofluorescence photomicrograph of CTCs isolated from a patient with metastatic colon cancer before, after 1 cycle and 2 cycles of antimetabolite-based chemotherapy (CD45 is red, cytokeratin is green and DAPI is blue). Scale bar is 40 μm
Fig. 4
Fig. 4
CTC mobilization with different chemotherapeutic regimens. a Box and whisker charts show the fold change in CTC counts after 1 and 2 cycles of treatment with: A combination of Fluorouracil, Oxaliplatin and Irinotecan, or alkylating agent-, plant alkaloids-, antimetabolite- and inhibitor-based chemotherapy. Lines connect individual patients (median ± range, N = 72 from 30 Met-pa). The changes in the median CTC level over the course of each treatment was tested for significance with a paired Wilcoxon test. b Box and whisker plots represent the fold change in CTC counts post-chemotherapy in patients showing continuous progression of cancer. Lines connect individual patients (median ± range, N = 9 from 3 Met-pa). The change in median CTC level post-treatment was not significant using a paired Wilcoxon test (0.500 < P > 0.999)
Fig. 5
Fig. 5
TRAIL-based liposomal therapy killed CTCs from metastatic cancer patients. a Scatter dot charts represent the normalized cell viability percentage of CTCs treated with vehicle control and TRAIL-based liposomal therapy in flowing blood for 4 h at different time points of cancer treatment: Baseline, 1 cycle of chemotherapy and 2 cycles of chemotherapy (mean ± SD, N = 68 from 26 cancer patients). Significant decrease (****P < 0.0001) of CTC in treated samples was calculated using a paired t test. b Immunofluorescence photomicrographs of CTCs remaining after being treated in flowing blood with vehicle control and TRAIL-liposomal therapy in patients with gastric, rectal, breast and lung cancer (CD45 is red, Cytokeratin is green and DAPI is blue). Scale bar is 40 μm. c Scatter dot charts represent the reduction in cell viability percentage in treated samples with TRAIL-based liposomal therapy before and after chemotherapy (mean ± SD, N = 65 from 26 patients). Non-significant increase (P = 0.1424) in killing rate of CTC after receiving 1 or 2 cycles of chemotherapy was calculated using one-way ANOVA (repeats matched) test. d Scatter dot plots represent the variation in cell viability reduction percentage in treated samples with TRAIL-liposomal therapy by cancer type (mean ± SD, N = 65 from 26 patients). There were no significant differences (P = 0.2514) in the mean CTC reduction by cancer type as determined with one-way ANOVA
Fig. 6
Fig. 6
Minimal reduction of CTC viability by chemotherapy and soluble TRAIL. a Bar graphs display the viable CTC percentage in treated samples with PBS and chemotherapeutic agents (Docetaxel-DXT, 5-Fluorouracil-5-FU, Oxaliplatin-OXA, Paclitaxel-PTX) in Met-pa (mean ± SD, N = 24 from 10 patients at different time points of chemotherapy treatment). Significant reduction in (*P = 0.0317) in CTC viability due to the chemotherapy was determined using a paired t test. b Bar graphs represent the CTC viability percentage in samples treated with PBS and soluble TRAIL (mean ± SD, N = 12, from 6 patients). Significant reduction in CTC viability percentage (**P = 0.0048) by soluble TRAIL was calculated using a paired t test. c Immunofluorescence photomicrographs of viable cells obtained from breast, prostate and colorectal cancer patients after ex vivo treatment with chemotherapies, including docetaxel, paclitaxel, and soluble TRAIL (CD45 is red, cytokeratin is green and DAPI is blue). Scale bar is 40 μm

Similar articles

Cited by

References

    1. Chaffer CL, Weinberg RA. A perspective on cancer cell metastasis. Science. 2011;331(6024):1559–1564. doi: 10.1126/science.1203543. - DOI - PubMed
    1. Siegel RL, Miller KD, Jemal A. Cancer statistics, 2019. CA A Cancer J Clin. 2019;69(1):7–34. doi: 10.3322/caac.21551. - DOI - PubMed
    1. Lambert AW, Pattabiraman DR, Weinberg RA. Emerging biological principles of metastasis. Cell. 2017;168(4):670–691. doi: 10.1016/j.cell.2016.11.037. - DOI - PMC - PubMed
    1. Duda DG, et al. Malignant cells facilitate lung metastasis by bringing their own soil. Proc Natl Acad Sci. 2010;107(50):21677–21682. doi: 10.1073/pnas.1016234107. - DOI - PMC - PubMed
    1. Gao Q, et al. Heterotypic CAF-tumor spheroids promote early peritoneal metastatis of ovarian cancer. J Exp Med. 2019;216(3):688–703. doi: 10.1084/jem.20180765. - DOI - PMC - PubMed

MeSH terms

Substances

LinkOut - more resources