. 2020 Sep 23;11(3):215-228.e5.
doi: 10.1016/j.cels.2020.08.002. Epub 2020 Sep 10.

Discriminatory Power of Combinatorial Antigen Recognition in Cancer T Cell Therapies

Affiliations

Discriminatory Power of Combinatorial Antigen Recognition in Cancer T Cell Therapies

Ruth Dannenfelser et al. Cell Syst. .

Abstract

Precise discrimination of tumor from normal tissues remains a major roadblock for therapeutic efficacy of chimeric antigen receptor (CAR) T cells. Here, we perform a comprehensive in silico screen to identify multi-antigen signatures that improve tumor discrimination by CAR T cells engineered to integrate multiple antigen inputs via Boolean logic, e.g., AND and NOT. We screen >2.5 million dual antigens and ∼60 million triple antigens across 33 tumor types and 34 normal tissues. We find that dual antigens significantly outperform the best single clinically investigated CAR targets and confirm key predictions experimentally. Further, we identify antigen triplets that are predicted to show close to ideal tumor-versus-normal tissue discrimination for several tumor types. This work demonstrates the potential of 2- to 3-antigen Boolean logic gates for improving tumor discrimination by CAR T cell therapies. Our predictions are available on an interactive web server resource (antigen.princeton.edu).

Keywords: AND gate; CAR T cell; NOT gate; T cell therapeutics; combinatorial antigen recognition; tumor antigens; tumor-versus-normal discrimination.


Conflict of interest statement

Declaration of Interests W.A.L. is on the Scientific Advisory Board for Allogene Therapeutics and O.G.T. is on the Scientific Advisory Board for Caris Life Sciences. W.A.L. and O.G.T. have filed patents related to this work.

Figures
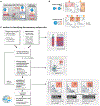
Figure 1.
Figure 1.. Computationally Enumerating Combinatorial Antigen Sets Predicted to Improve T Cell Discrimination of Cancer versus Normal Cells
(A) Single antigen targets for CAR T cells often show cross reactivity with subset of normal tissues. Combinatorial recognition circuits (AND, NOT, etc.) could improve discrimination. (B) Single antigen targets theoretically hit samples that have high expression of antigen A or B. Using Boolean T cells we can target specific patterns of antigen expression reducing off-target toxicity. (C) Computational pipeline for identifying antigen pairs with improved tumor discrimination. For each cancer type (N = 33), normalized RNA-seq expression data are combined with RNA-seq data for 34 normal tissues. All potential transmembrane antigen pairs are then evaluated for their potential to separate samples of a given tumor type from all normal samples in expression space. Shaded boxes highlight specific steps of the pipeline starting with a representation of the expression data, followed by the scoring method, and toy examples highlighting how evaluation metrics are calculated.
Figure 2.
Figure 2.. Dual Antigen Use Greatly Improves the Precision of Cancer Detection
Antigen combinations were ranked by their clustering scores for each tumor and each gate type (e.g., clinical, novel, clinical-clinical, clinical-novel, or novelnovel). In this figure different subsets of the top antigens (e.g., the top scoring singlet/pair or the top 10 combinations) are taken and their F1 scores are used to describe their potential discriminatory power. (A) Distribution of tumor-versus-normal discrimination scores (F1) for the top clinical antigens or top 10 novel antigens for each cancer type, and for the top 10 antigen pairs (clinical-clinical, clinical-novel, or novel-novel) for each cancer type. F1 scores range between 0 (no sensitivity and specificity) and 1 (perfect precision and recall). Here, we see significant gains in discrimination power going from a clinical antigen to a single novel antigen (p = 8.41 × 10−69; n = 646) and from a clinical-clinical antigen pair to a clinical-novel pair (p = 1,38 × 10⁻¹¹; n = 660). (B) Improvement in tumor-versus-normal discrimination with dual antigen recognition by cancer type. F1 scores are shown for the highest clustering score single clinical antigen and the highest clustering score dual antigen pair. All antigen pairs improve over the highest performing single clinical antigen. (C) Pie chart showing the composition of different gate types of pairs in the top 10 per tumor type. A AND B gates have high expression of both antigens, A AND NOT B have high expression of one antigen and low expression of the second antigen. The majority of pairs are AND NOT gates. (D) Novel antigens (hubs, blue) identified that form high-performing pairs with numerous current clinically targeted CAR antigens (spokes, orange). Edge weights and color correspond to the number of applicable cancer types.
Figure 3.
Figure 3.. Numerous Potential Antigen Pairs Show Significant Improvement in the Precision of Tumor Recognition
(A) Examples of antigen pairs with improved tumor-versus-normal discrimination by switching from single to dual antigen recognition. 2D plots show expression level of both antigens in normal tissue samples (gray) versus specific cancer-type samples (red). Navy circles show centroids for each of the normal tissue types (labeled when close to red cancer cluster). Pairs were scored by clustering as well as by F1 score. Density function of single antigen expression in tumor (red) and normal (gray) tissue are plotted on respective axis, including an optimal point of discrimination showing the best potential tumor-versus-normal discrimination using a single antigen. (B) Example 2D plots as in (A) highlighting potential AND gates that combine known CAR target pairs (clinical-clinical), known CAR targets paired with new potential antigens (clinical-novel), and pairs of new potential targets (novel-novel). (C) Example 2D plots as in (B) highlighting potential NOT gates.
Figure 4.
Figure 4.. Computationally Predicted Antigen Pairs Can Be Constructed as AND-Gated CAR T Cells in a Laboratory Setting, with Precise In Vitro Discrimination
(A) RCC recognition circuit: CD70 and AXL. Segregation of RCC samples (red points) versus normal tissue samples (gray points) in antigen expression space, highlighting overlap of CD70 expression with normal blood samples (green points). We constructed an anti-AXL synNotch receptor and validated that human T cells expressing the receptor can detect 769-P renal cell cancer cell line (CD70+AXL+), but not Raji B cell line (CD70+AXL−)via FAC detection of GFP reporter induction. In cell killing assays, we compared human primary CD8+ T cells constitutively expressing the anti-CD70 CAR with the same cells transfected with the anti-AXL synNotch driving anti–CD70 CAR AND-gate circuit. The single antigen targeting anti-CD70 CAR T cells killed both RCC and B cell lines, while the circuit T cells selectively killed RCC cells (n = 3, p value from unpaired two sample student’s t test). (B) RCC recognition circuit: AXL and CDH6. Segregation of RCC samples (red points) versus normal tissue samples (gray points) in antigen expression space, highlighting overlap of AXL expression with normal lung samples (green points). We constructed an anti-CDH6 synNotch receptor and validated that human T cells expressing the receptor can detect 769-P renal cell cancer cell line (AXL+CDH6+), but not the Beas2B lung epithelial cell line (AXL+CDH6−)via FAC detection of GFP reporter induction. In cell killing assays, we compared human primary CD8+ T cells constitutively expressing the anti-AXL CAR with the same cells transfected with the anti-CDH6 synNotch driving anti–AXL CAR AND-gate circuit. The single antigen targeting anti-AXL CAR T cells killed both RCC and lung cell lines, while the circuit T cells selectively killed RCC cells (n = 3, p value from unpaired two sample student’s t test).
Figure 5.
Figure 5.. Antigen Triplets Can Significantly Improve Recognition of Challenging Cancers with Some Reduction in Sensitivity
(A) (Left) Distribution of tumor-versus-normal discrimination scores (F1) for top 10 antigen singlets, doublets, and triplets. We see significant performance improvements going from 1 to 2 antigens (p = 7.68 × 10−68; n = 2,979) and 2 to 3 antigens (p = 2.83 × 10−48; n = 1,578). The same plot is shown on the right for top 10 clinical antigen singlets, clinical-novel antigen doublets, and clinical-clinical-novel antigen triplets. Again, we see significant increases in performance going from clinical to clinical-novel pairs (p = 6.06 × 10−81; n = 676) and from clinical-novel pairs to clinical-clinical-novel triplets (p = 5.00 × 10⁻⁸; n = 438). F1 scores range between 0 (no sensitivity and specificity) and 1 (perfect precision and recall). (B) Improvement in tumor-versus-normal discrimination with triplet antigen recognition by cancer type. F1 score ranges from best single clinical antigen (gray circle) to best double with at least one clinical antigen (blue circle) to best triplet with at least one clinical antigen. (C) Pie chart showing the composition of different gate types (high:high:high, high:high:low, and high:low:low) of triplets in the top 100 per tumor type. (D) Each gray dot represents the precision (left) or recall (right) for one of the top antigens (single, double, and triples) for a single tumor type. Gray lines show the median illustrating the global increase in precision when including more antigens at the expense of recall. Precision has a significant increase and recall a significant decrease when going from one to two (precision: Wilcoxon rank sum p = 2.45 × 10−120, n = 2,979; recall: Wilcoxon rank sum p = 3.55 × 10⁻⁹, n = 2,979) and two to three antigens (precision: Wilcoxon rank sum p = 5.69 × 10−84, n = 1,578; recall: Wilcoxon rank sum p = 5.94 × 10⁻⁴; n = 1,578). (E) Example 3D triplet antigen gates showing expression level of all antigens in normal tissue samples (gray) versus specific cancer-type samples (red). Tissue centroids are in dark blue. Triplets were scored by clustering as well as by F1 score.
Figure 6.
Figure 6.. In Silico T Cell Circuit Design: Expansive Search and Provided Resources
(A) In silico analysis of tumor-versus-normal expression data can be used to identify discriminatory antigen patterns. These potential antigen signatures can then be used as the basis for synthetic biology engineering of precision therapeutic T cells. (B) We have generated an interactive webserver that allows public access to the datasets used in this paper; allowing users to identify potential discriminatory singlets, doublets, and triplets for cancer detection in the future (antigen.princeton.edu).

Comment in

Similar articles

Cited by

References

    1. Binder JX, Pletscher-Frankild S, Tsafou K, Stolte C, O’Donoghue SI, Schneider R, and Jensen LJ (2014). COMPARTMENTS: unification and visualization of protein subcellular localization evidence. Database (Oxford) 2014, bau012. - PMC - PubMed
    1. de Cristofaro T, Di Palma T, Soriano AA, Monticelli A, Affinito O, Cocozza S, and Zannini M (2016). Candidate genes and pathways downstream of PAX8 involved in ovarian high-grade serous carcinoma. Oncotarget 7, 41929–41947. - PMC - PubMed
    1. Fedorov VD, Themeli M, and Sadelain M (2013). PD-1- and CTLA-4-based inhibitory chimeric antigen receptors (iCARs) divert off-target immunotherapy responses. Sci. Transl. Med 5, 215ra172. - PMC - PubMed
    1. Ferguson HJM, Wragg JW, Ward S, Heath VL, Ismail T, and Bicknell R (2016). Glutamate dependent NMDA receptor 2D is a novel angiogenic tumour endothelial marker in colorectal cancer. Oncotarget 7, 20440–20454. - PMC - PubMed
    1. Grada Z, Hegde M, Byrd T, Shaffer DR, Ghazi A, Brawley VS, Corder A, Schonfeld K, Koch J, Dotti G, et al. (2013). TanCAR: A novel bispecific chimeric antigen receptor for cancer immunotherapy. Mol. Ther. Nucleic Acids 2, e105. - PMC - PubMed

Publication types

MeSH terms

Substances

LinkOut - more resources