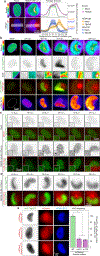
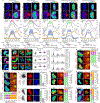
. 2020 Nov;587(7832):109-114.
doi: 10.1038/s41586-020-2714-x. Epub 2020 Sep 9.

Cytoplasmic control of intranuclear polarity by human cytomegalovirus

Affiliations

Cytoplasmic control of intranuclear polarity by human cytomegalovirus

Dean J Procter et al. Nature. 2020 Nov.

Abstract

Despite its size and rigidity, the cell nucleus can be moved or reorganized by cytoskeletal filaments under various conditions (for example, during viral infection)1-11. Moreover, whereas chromatin organizes into non-random domains12, extensive heterogeneity at the single-cell level13 means that precisely how and why nuclei reorganize remains an area of intense investigation. Here we describe convolutional neural network-based automated cell classification and analysis pipelines, which revealed the extent to which human cytomegalovirus generates nuclear polarity through a virus-assembled microtubule-organizing centre. Acetylation of tubulin enables microtubules emanating from this centre to rotate the nucleus by engaging cytoplasmically exposed dynein-binding domains in the outer nuclear membrane protein nesprin-2G, which polarizes the inner nuclear membrane protein SUN1. This in turn creates intranuclear polarity in emerin, and thereby controls nuclear actin filaments that spatially segregate viral DNA from inactive histones and host DNA, maximizing virus replication. Our findings demonstrate the extent to which viruses can control the nucleus from the cytoplasm.


Conflict of interest statement

Competing Interest Statement

The authors declare no conflicts of interest associated with this work.

Figures
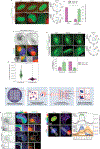
Extended Data Fig. 1:
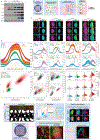
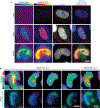
Extended Data Fig. 1:. Tubulin acetylation regulates nuclear rotation and SUN1 polarization during HCMV infection.
a-b, Representative stills from time lapse imaging and measurements of rotation frequency above or below 180° in uninfected or infected NHDFs expressing GFP-Histone nanobody. Bars represent mean ± SEM, statistics use two-tailed student’s t-test, n = 281 cells total from 3 independent biological replicates; ****p≤0.0001. Note that nuclear rotation above 180° occurs in approximately 80% of infected cells imaged, while lower levels of rotation occur in the remaining population. Such extensive rotation is extremely rare in uninfected cells. c-d, Expression of a K40R mutant form of tubulin suppresses the formation of acetylated microtubule filaments. Fluorescence intensity of acetylated tubulin is shown in b; All data points are shown within violin plots, statistics use two-tailed student’s t-test, n = 250 cells total, ****p ≤ 0.0001. Data shown is representative of 3 independent biological replicates. e-f, Expression of a K40R mutant form of tubulin suppresses nuclear rotation. Representative stills from Video 2 are shown in e and rotational analyses are shown in f. Rotation frequency above or below 180° is shown in d; bars represent mean ± SEM, statistics use two-tailed student’s t-test, n = 157 cells total, **p ≤ 0.01 g, schematic of CNN-based classification and analysis pipeline measuring fluorescence intensities across individual cells in different channels. Output for the AC (red) next to the nucleus (blue) is illustrated. h, Representative confocal z-section and deconvolved z-section image of SUN1 polarization in HCMV-infected cell. Acetylated microtubules and the AC (stained with the viral protein gB) are also shown. Data shown is representative of 3 independent biological replicates. i, Spatial distribution and intensity of DNA, gB and SUN2 using CNN. Lines represent mean ± SEM; n ≥ 17,484 cells total from 3 independent biological replicates.
Extended Data Fig. 2:
Extended Data Fig. 2:. Effects of HCMV infection on SUN1.
a, WB analysis of SUN1 levels over the course of infection with HCMV at MOI 1. Early (IE1/2), intermediate (UL44) and late (pp65, pp28) proteins demonstrate stages of infection at each timepoint, representative of 3 independent biological replicates. b-d, Neural network-based single cell analysis of SUN1 expression during HCMV infection. b, Illustration of CNN analysis pipeline that classifies cells by the predominant infectious cycle stage identified at each timepoint. c, Representative examples of uninfected NHDFs or NHDFs at various stages of infection, stained for SUN1, IE1/2 and TGN46. Expression of IE1/2 and gradual remodeling of the Golgi network serve as markers of infection stage. Polarization of SUN1 is seen between 24–72 h.p.i. d, CNN-based classification of cells based on IE1/2 expression levels, filtering out uninfected cells, reveals a gradual expansion of the nucleus and Golgi, characteristic of HCMV infection, occurs concomitantly with a gradual increase in expression and polarization of SUN1 toward the AC (i-v). Discrete populations of cells are filtered for inclusion in each timepoint (vii), with cells from other kinetic classes removed from analysis marked in grey (viii-x).Comparing unfiltered (lighter colored violin plots, left segment) versus filtered (dark colored violin plots, right segment) cell populations reveals the power of trained networks to more precisely analyze only infected cells within the population, more clearly revealing the increase in nuclear volume and SUN1 abundance, which peaks at approximately 2-fold (xi-xiii). Lines represent mean ± SEM; n = 37,800 cells total from 3 independent biological replicates. Violins as in Fig. 4a. e, Mask-RCNN analysis pipeline uses manually annotated masks of the AC, nucleus and combined (HCMV) to train a Mask-RCNN architecture to classify and segment microscopy images of HCMV infection. Once trained, whole cover-slip scanning datasets can be run through the model to perform instantaneous single cell quantification on high-confidence infected cells. This quantification has high spatial awareness and can be used to perform linescans between two specific subcellular compartments (e.g. the AC and nucleus) or to rotate and align nuclei to perform average projections (as in Fig. 1g).
Extended Data Fig. 3:
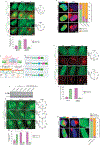
Extended Data Fig. 3:. SUN1:Nesprin-2G and the dynein adaptor BICD2 mediate nuclear rotation during HCMV infection.
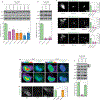
a-b, Expression of a SUN1 mutant that does not engage Nesprin-2G impairs nuclear rotation in HCMV-infected cells. a, Representative stills from time lapse recordings of NHDFs expressing Tag-GFP2 forms of SUN1 Full Length (FL) or SUN1 lacking the lumenal domain (SUN1ΔLu) that mediates interactions with Nesprin-2G, infected with HCMV-UL99mCherry. Rotation traces from this imaging are shown to the right. Analyses focused on cells expressing intermediate levels of SUN1-GFP constructs as high levels of expression can result in retention of Nesprin-2G in the endoplasmic reticulum (ER). b, Quantification of rotation frequencies above or below 180°; bars represent mean ± SEM, statistics use two-tailed student’s t-test, n = 138 cells total from 3 independent biological replicates, ***p≤0.001. This data further confirms that interactions with Nesprin-2G are necessary for nuclear rotation to occur. c-f, RNAi-mediated depletion of BICD2 using either of two independent siRNAs suppresses nuclear rotation and SUN1 polarization. c, Illustration of SUN1:Nesprin-2G interactions with microtubule motors through AD regions, or SUN2:Nesprin-2G interactions with myosin through CH domains to control nuclear movement. d, Illustration of GFP-Nesprin-2G constructs with CH and/or AD domains, along with the LEWD>LEAA kinesin-binding mutant. e, Western blot analysis of BICD2 expression representative of 3 independent replicates. Arrow points to BICD2, specifically depleted by two independent siRNAs. f, Representative stills and rotational analyses from Video 6 showing effects of BICD2 depletion on nuclear rotation. g, Rotation frequency above or below 180° in control or BICD2 depleted cells, bars represent mean ± SEM, statistics use two-tailed student’s t-test, n = 144 cells total cells from n = 3–4 independent biological replicates, ***p ≤ 0.001. h, Depletion of BICD2 impairs SUN1 polarization. Spatial distribution and intensity of DNA (hoescht), AC marker (gB), and SUN1 are shown for control and BICD2 depleted cells and are representative of 3 independent biological replicates. For quantification, SUN1 was classed as polarized (green), intermediate (pink) or non-polarized (orange). n = 235 cells total. i-k, Expression of a dominant-negative fragment of BICD2 reduces nuclear rotation and SUN1 polarization. NHDFs expressing TagGFP2 control or TagGFP2-BICD2 N-terminus (NT) were infected with HCMV UL99-mCherry. i, Representative still images from time lapse recordings and rotation traces are shown. j, Quantification of rotation frequencies above or below 180°; bars represent mean ± SEM, n = 91 cells total from 2 independent biological replicates. k, Representative images of SUN1 localization in NHDFs expressing TagGFP2 control or TagGFP2-BICD2-NT NHDFs are shown, consistent with 3 independent biological replicates. Quantification of SUN1 polarity categorized as fully polarized, intermediate polarity or not polarized is shown; n = 149 cells total.
Extended Data Fig. 4:
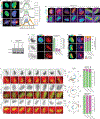
Extended Data Fig. 4:. Microtubules and SUN1 regulate Emerin polarity and nuclear F-actin.
a, Lamin A/C is downregulated and lacks polarity in HCMV-infected cells. Lines represent mean ± SEM; n = 10,934 cells total from 3 independent biological replicates. b, Depletion of αTAT1, SUN1 or BICD2 inhibits Emerin polarization and causes aberrant F-actin networks. Representative images are shown for each condition, similar to data from 3 independent replicates. c-d, Emerin depletion blocks nuclear F-actin formation. c, WB analysis demonstrating the efficacy of Emerin siRNAs. d, Representative images and quantification of nuclear F-actin (nAC) frequency are shown for each condition, bars represent mean ± SEM, statistics use two-tailed student’s t-test, n = 401 cells total from 3 independent biological replicates, ***p≤0.001. Fluorescence intensity shows Emerin depletion in cells. e, Emerin depletion does not affect SUN1 polarization. Representative images and quantification of SUN1 polarization is shown for each condition; n = 321 cells. SUN1 was characterized as polarized, intermediate polarity or not polarized. f, Expression of actin-binding mutants of Emerin blocks nuclear F-actin formation but not nuclear rotation. NHDFs expressing nAC-TagGFP and mCherry-Emerin wildtype or actin-binding mutants (m151, m175) were infected with HCMV UL99-mCherry. Representative still images and rotation traces from time lapse imaging are shown. Quantification of nuclear rotation frequencies above or below 180° are shown for each condition; the presence of nuclear F-actin was also quantified in the same time lapse images, n = 72 cells total (upper) and n = 79 cells total (lower). Note that in order to image nAC-TagGFP cells were infected with HCMV UL99-mCherry. As such, mCherry signal in these images originates from both mCherry-Emerin and the viral UL99-mCherry, showing the cytoplasmic AC and nuclear rotation in infected cells under all conditions. Data shown is representative of 3 independent replicates.
Extended Data Fig. 5:
Extended Data Fig. 5:. Nuclear F-actin formation and histone modifications during HCMV infection.
a, γH2AX localizes to nuclear F-actin and polarizes during HCMV infection. Representative images of HCMV-infected cells expressing nAC-TagGFP to detect nuclear actin filaments, fixed at the indicated times post-infection and stained for histone γH2AX. Intensity heat maps are shown at the top, illustrating the appearance and gradual polarization of γH2AX foci. In merges, γH2AX foci (purple staining) are observed adjacent to nuclear actin filaments (green) during the rotation phase, and are highly polarized by the time nuclear rotation ceases and actin filaments disassemble. b, Fixed images showing γH2AX and nuclear F-actin induction in nAC-TagGFP-expressing NHDFs treated with the DNA damage agent, etoposide. c, Still images from Supplementary Video 9 showing the formation of thick nuclear F-actin in response to etoposide. d, Representative examples of the spatial distribution of H3K9me3 foci at early time-points in HCMV infection. Infected cells were identified by staining for IE1/2. Average H3K9me3 fluorescence intensity per cell is shown in violin plots with all data points shown, statistics use two-tailed student’s t-test n = 8,177 cells total; ****p≤0.0001, ns= not significant. Note that H3K9 methylation increases by 24h.p.i. but is not polarized before the nuclear rotation phase of infection. e, Representative still images from Supplementary Video 10 showing the localization of histones visualized in NHDFs expressing eGFP-Histone nanobody and infected with HCMV UL99-mCherry. Rotation trace is shown to the right. Note that histones are dynamic but are next extensively polarized, in line with fixed images in Figure 4a. f, Arp1/2 inhibitor, CK-666 blocks nuclear actin filament formation and polarization of histone H3K9me3. Representative images are shown at 48 and 96 h.p.i., the peak and end-point of nuclear rotation and establishment of polarity, respectively. Insets show the localization of H3K9me3 foci near nuclear F-actin at the early stages of rotation when polarity is being established. For all experiments, data shown is representative of 3 independent biological replicates.
Extended Data Fig. 6:
Extended Data Fig. 6:. Localization of viral genomic DNA and histones in HCMV-infected cells.
a, Representative images of early and mature replication compartments containing viral DNA in HCMV-infected cells, versus uninfected (mock) cells, detected using FISH. DNA-immunoFISH was used to detect the viral immediate early transcription factor, IE1/2 in conjunction with viral DNA. IE1/2 is present in cells containing early, individual replication compartments. As infection progresses, IE1/2 abundance increases and DNA-containing replication compartments amplify and coalesce. b, Representative examples of the relative spatial distribution and fluorescence intensity of histone H3K9me3 foci and viral genomic DNA (gDNA) in HCMV-infected cells at 72 and 96 h.p.i. Note that the bulk of histone H3K9me3 foci are spatially polarized toward the AC and segregated away from viral gDNA. For all experiments, data shown is representative of 3 independent biological replicates.
Extended Data Fig. 7:
Extended Data Fig. 7:. d-STORM imaging reveals the segregation of host and viral DNA during HCMV infection.
Differential EdU-labeling strategies enable super-resolution imaging of host and viral chromatin structures and localization. Cartoons to the left illustrate each labeling strategy. Top, Localization of host DNA in uninfected cells was visualized by pulsing with EdU followed by d-STORM imaging. Images representative of 3 independent biological replicates are shown, illustrating how labeled DNA is distributed throughout the nucleus. Middle, Localizaton of host DNA in HCMV-infected cells. To selectively label host DNA during infection, cells were pulsed with EdU which was then removed prior to infection to prevent incorporation into viral DNA. Representative d-STORM images are shown of labeled host DNA at 72 h.p.i., illustrating its accumulation near the viral AC. Lower, Localizaton of viral DNA in HCMV-infected cells. To selectively label viral DNA but not host DNA, cells were pulsed with EdU at 72h.p.i. As infection blocks host DNA synthesis, EdU is only incorporated into viral DNA at this time. Representative d-STORM images are shown of viral DNA at 72 h.p.i., illustrating its accumulation on the opposing side of the nucleus, away from the viral AC and regions containing host DNA or heterochromatin. This pattern of viral DNA labeling is validated by DNA Immuno-FISH imaging of viral DNA in Extended Data Fig. 6.
Extended Data Fig. 8:
Extended Data Fig. 8:. BICD2, SUN1 and Emerin are required for the polarization of heterochromatin by HCMV.
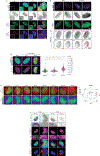
a, Depletion of αTAT1, BICD2 or SUN1 reduces H3K9me3 polarization. Representative images are shown. b, Expression of BICD2 dominant-negative (BICD2-NT) or SUN1 lacking its lumenal domain (SUN-ΔLu) that mediates interactions with Nesprin-2G inhibits the polarization of H3K9me3 in HCMV-infected cells. Representative images and quantification of H3K9me3 polarization are shown; n = 171 cells total. c, Depletion of Emerin impairs the polarization of H3K9me3 in HCMV-infected cells. Representative images and quantification of H3K9me3 polarization are shown; n = 490 cells total. For all experiments, data shown is representative of 3 independent biological replicates.
Extended Data Fig. 9:
Extended Data Fig. 9:. Host factors that control nuclear polarization are required for efficient HCMV replication.
a-b, siRNAs targeting ATAT1, BICD2, SUN1 or Emerin do not affect the accumulation of viral proteins from different kinetic classes, but reduce the production of infectious virus in cells infected at MOI 1. Reductions in viral yields are similar to reductions in DNA fluorescence intensities detected in Fig. 4c. This suggests that nuclear polarization does not regulate viral gene expression, but maximizes viral DNA replication and production of infectious virus. Bars represent mean ± SEM from 3 independent biological replicates, statistics use two-tailed student’s t-test, *p≤0.05, **p≤0.01, ***p≤0.001, ****p≤0.0001. c, Depletion of ATAT1, BICD2 or SUN1 potently suppresses HCMV spread. Quantification of plaque areas is shown to the right in e; Bars represent mean ± SEM, statistics use two-tailed student’s t-test, n=31–81 plaques total from 3 independent biological replicates, *p≤0.05, **p≤0.01. This data suggests that while viral DNA replication and virus yields are reduced by 50% in a single round of infection, this has cumulative effects on the ability of HCMV to spread to other cells. d-f, General inhibition of Arp2/3 activity has broader effects on HCMV infection. d, The Arp2/3 inhibitor CK-666 suppresses viral gDNA polarization and accumulation. Representative images are shown of viral gene expression. gDNA and its localization relative to H3K9me3 foci. e, HCMV spread is suppressed in CK-666-treated, but not inactive control CK-689-treated cells. Plaque areas are shown, bars represent mean ± SEM, statistics use two-tailed student’s t-test, n=416 plaques total from 3 independent biological replicates, *p≤0.05, **p≤0.01. f, Arp2/3 inhibition suppresses viral protein accumulation and virus yields in single cycle infections. These data show that inhibition of actin polymerization using Arp2/3 inhibitors not only blocks nuclear polarization but has additional effects on viral gene expression, including modest effects on IE2 expression and more noticeable effects on intermediate and late proteins. This suggests roles for both nuclear and cytoplasmic actin when using broad-spectrum inhibitors over more targeted approaches against nuclear actin alone. Bars represent mean ± SEM from 3 independent biological replicates, statistics use two-tailed student’s t-test, *p≤0.05, ***p≤0.001. For all experiments, data shown is representative of 3 independent biological replicates.
Extended Data Fig. 10:
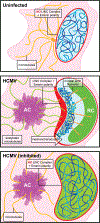
Extended Data Fig. 10:. A model for HCMV-induced nuclear polarization.
Top, In uninfected cells chromatin and silenced domains are heterogeneously distributed throughout the nucleus, as discussed in the main text. Middle, Upon HCMV infection, nuclear F-actin is induced and reorganized through the action of acetylated microtubules that exert mechanotransductive pulling forces on Nesprin-2G:SUN1-containing LINC complexes, polarizing them towards the AC. In doing so, this creates extreme polarity in inner-nuclear Emerin, directing nuclear F-actin organization; enriched red regions represent polarized LINC-Emerin complexes in the nuclear membrane. This extreme polarity draws silenced (H3K9me3) histones and associated host DNA towards this region of the nucleus, through the action of nuclear F-actin networks. As viruses employ a wide range of strategies to prevent chromatinization and silencing of their own DNA, viral gDNA is not drawn to the AC-proximal sites of H3K9me3 polarization. The polarization of inactive histones and host DNA likely pushes viral DNA to the opposing side of the nucleus, through space-filling. This segregation of viral and host DNA creates an optimal environment for viral DNA replication and production of infectious virus particles. Lower, Polarization of the nucleus fails to occur if key components driving the process are inhibited; if microtubules are not mechanically strengthened through acetylation, if connections between microtubules and nuclear membrane complexes are lost, or if nuclear F-actin is not organized by Emerin. Notably, nuclear F-actin and Emerin do not control nuclear rotation, but cytoplasmic microtubule-derived forces that cause nuclear rotation control Emerin localization, F-actin formation and intranuclear polarity. As such, cytoplasmic forces on the nuclear surface organize nuclear factors to control genetic polarity. Failure to create this polarity results in a suboptimal environment for viral DNA replication.
Fig. 1:
Fig. 1:. Tubulin acetylation facilitates nuclear rotation and SUN1 polarization.
a, illustration of the HCMV AC (red) and nuclear (blue) rotation phase, highlighting primary imaging windows. b-c, Western blot and immunofluorescence showing αTAT1 depletion suppresses microtubule acetylation. Fluorescence intensity of acetylated microtubules was quantified; n = 303 cells total, ****p≤0.0001, two-tailed student’s t-test. All data points are shown within violin plots. Similar results yielded from 3 independent experiments. d-e, αTAT1 depletion suppresses nuclear rotation. Representative stills from Video 1 and rotational analyses are shown. Rotation frequency above or below 180° is shown in e; bars represent mean ± SEM; n = 309 cells total,***p≤0.001, two-tailed student’s t-test. f-g, Spatial distribution and intensity of DNA (hoescht), AC marker (gB), acetylated microtubules (Ac-K40-MT) and SUN1 using CNN (g) or DNA, gB and SUN1 using MASK-RCNN (h) analyses. Lines represent mean ± SEM; n = 34,712 cells total in dataset from 3 independent biological replicates for f; n = 2,214 cells total for g. h, αTAT1 depletion suppresses SUN1 polarization. For quantification, SUN1 was classed as polarized (green), intermediate (pink) or non-polarized (orange). n = 583 cells total. Similar results yielded from 3 independent experiments.
Fig. 2:
Fig. 2:. SUN1:Nesprin-2G complexes control nuclear rotation through dynein interactions.
a-c, SUN1 depletion suppresses nuclear rotation. Representative stills from Video 3 and rotational analyses are shown. Western blot is representative of 3 independent experiments. Rotation frequency above or below 180° is shown in c; n = 162 cells total from 3 independent biological replicates, ***p≤0.001. d-e, Effects of Nesprin-2G constructs on nuclear rotation. Representative stills and rotation analyses from Video 4 are in f. Frequency of rotations above or below 180° are in g; bars represent mean ± SEM, n = 127 cells total from 5 independent biological replicates, **p≤0.01, ***p≤0.001, ****p≤0.0001, two-tailed student’s t-test.
Fig. 3:
Fig. 3:. Emerin polarization and regulation of nuclear F-actin.
a, Emerin is polarized in HCMV-infected cells. Lines represent mean ± SEM; n= 19,428 cells total from 3 independent biological replicates. b, Onset of Emerin polarization and formation of nuclear F-actin is detectable by 24h, as nuclear rotation begins. Emerin polarity is established over the nuclear rotation period and is sustained, while F-actin dissipates after the rotation phase. c-d, Stills from Videos 7-8 showing nuclear F-actin formation during mock or HCMV (TB40/E-UL99-mCherry) infection of NHDFs expressing nuclear actin chromobody (nAC-TagGFP). Early and late stages of infection are shown in c and d, respectively. e, Expression of actin-binding mutants (m151, m175) of Emerin impairs nuclear F-actin formation. Representative images and quantification of nuclear F-actin (nAC) frequency are shown for each condition; bars represent mean ± SEM, n = 1,230 cells total, **p≤0.01, two-tailed student’s t-test. All data shown is representative of 3 independent biological replicates.
Fig. 4:
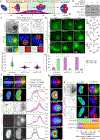
Fig. 4:. Microtubules and F-actin regulate intranuclear polarization by HCMV.
a, Distribution of histone H3 forms in HCMV-infected cells. Lines represent mean ± SEM; Total H3 (n = 13,774 cells total), H3K4me3 (n = 31,886 cells total), H3K27me3 (n = 30,874 cells total), H3K9me2 (n = 34,342 cells total), H3K9me3 (n = 13,790 cells total). Violin plots represent median (white point), interquartile range (IQR, box), and maximum/minimum values 1.5 x IQR outside the IQR (whiskers). b, Representative image of viral genomic DNA (gDNA) and H3K9me3 foci. White line delineates the peak of H3K9me3 foci in overlay images. c, Depletion of αTAT1, BICD2 or SUN1 reduces the polarity and abundance of viral gDNA. Fluorescence as a function of nuclear area was used to measure the extent of gDNA polarity, and mean fluorescence intensity was used to measure gDNA levels; All data points are shown within violin plots, n = 840 cells total, *p≤0.05, **p≤0.01, ***p≤0.001, two-tailed student’s t-test. d-e, Actin-binding mutants of Emerin inhibit H3K9me3 polarization without affecting SUN1 polarization. d, Representative images are shown. e, Quantification of H3K9me3 (n = 220 cells total) and SUN1 (n = 300 cells total) polarity, categorized as polarized, intermediate (int.) or not polarized. f, Nuclear-localized Arpin inhibits nuclear F-actin formation (bars represent mean ± SEM, n = 1,237 cells total from 3 independent biological replicates; **p≤0.01, two-tailed student’s t-test). g-h, Nuclear-localized Arpin inhibits H3K9me3 (n = 368 cells total) but not SUN1 (n = 236 cells total) polarization. i, Expression of nuclear-localized polymerization-deficient actin inhibits nuclear F-actin formation (bars represent mean ± SEM, n = 1,157 cells total from 3 independent biological replicates; **p≤0.01, two-tailed student’s t-test). j-k, Nuclear-localized polymerization-deficient actin inhibits H3K9me3 (n = 234 cells total) but not SUN1 (n = 185 cells total) polarization. All data representative of 3 independent biological replicates.

Similar articles

Cited by

References

    1. Gundersen GG & Worman HJ Nuclear positioning. Cell 152, 1376–1389, doi:10.1016/j.cell.2013.02.031 (2013). - DOI - PMC - PubMed
    1. Baarlink C et al. A transient pool of nuclear F-actin at mitotic exit controls chromatin organization. Nat Cell Biol 19, 1389–1399, doi:10.1038/ncb3641 (2017). - DOI - PubMed
    1. Christophorou N et al. Microtubule-driven nuclear rotations promote meiotic chromosome dynamics. Nat Cell Biol 17, 1388–1400, doi:10.1038/ncb3249 (2015). - DOI - PubMed
    1. Levy JR & Holzbaur EL Dynein drives nuclear rotation during forward progression of motile fibroblasts. J Cell Sci 121, 3187–3195, doi:10.1242/jcs.033878 (2008). - DOI - PMC - PubMed
    1. Luxton GW, Gomes ER, Folker ES, Vintinner E & Gundersen GG Linear arrays of nuclear envelope proteins harness retrograde actin flow for nuclear movement. Science 329, 956–959, doi:10.1126/science.1189072 (2010). - DOI - PMC - PubMed

Methods References

    1. Crisp M et al. Coupling of the nucleus and cytoplasm: role of the LINC complex. J Cell Biol 172, 41–53, doi:10.1083/jcb.200509124 (2006). - DOI - PMC - PubMed
    1. Plessner M, Knerr J & Grosse R Centrosomal Actin Assembly Is Required for Proper Mitotic Spindle Formation and Chromosome Congression. iScience 15, 274–281, doi:10.1016/j.isci.2019.04.022 (2019). - DOI - PMC - PubMed
    1. Belin BJ, Lee T & Mullins RD DNA damage induces nuclear actin filament assembly by Formin −2 and Spire-(1/2) that promotes efficient DNA repair. [corrected]. Elife 4, e07735, doi:10.7554/eLife.07735 (2015). - DOI - PMC - PubMed
    1. Xu J et al. Super-Resolution Imaging of Higher-Order Chromatin Structures at Different Epigenomic States in Single Mammalian Cells. Cell Rep 24, 873–882, doi:10.1016/j.celrep.2018.06.085 (2018). - DOI - PMC - PubMed
    1. Ovesny M, Krizek P, Borkovec J, Svindrych Z & Hagen GM ThunderSTORM: a comprehensive ImageJ plug-in for PALM and STORM data analysis and super-resolution imaging. Bioinformatics 30, 2389–2390, doi:10.1093/bioinformatics/btu202 (2014). - DOI - PMC - PubMed

Publication types

MeSH terms

LinkOut - more resources