

Multiplexed single-cell transcriptional response profiling to define cancer vulnerabilities and therapeutic mechanism of action
- PMID: 32855387
- PMCID: PMC7453022
- DOI: 10.1038/s41467-020-17440-w
Multiplexed single-cell transcriptional response profiling to define cancer vulnerabilities and therapeutic mechanism of action
Abstract
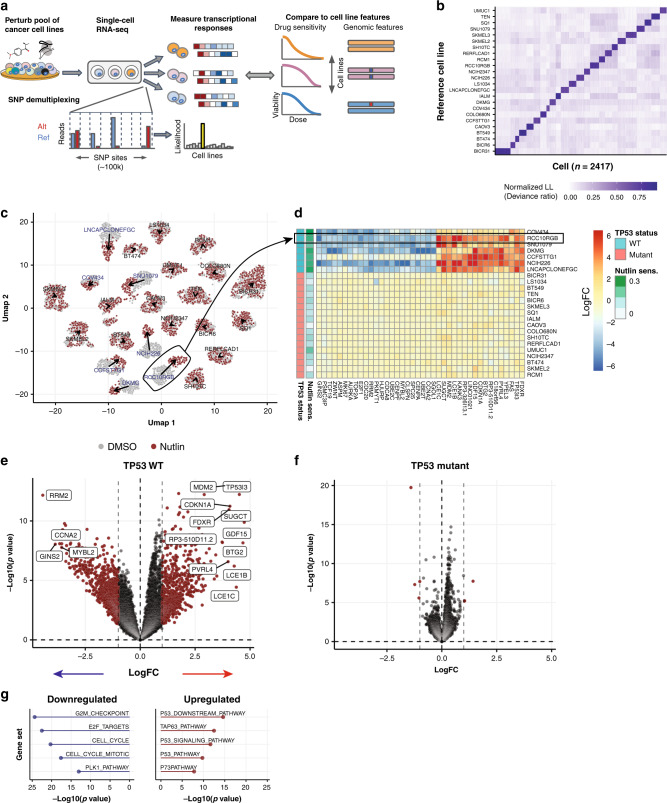
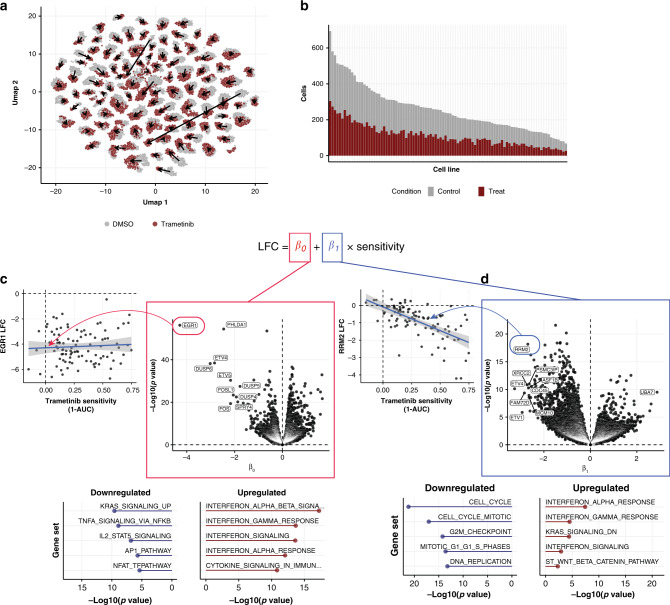
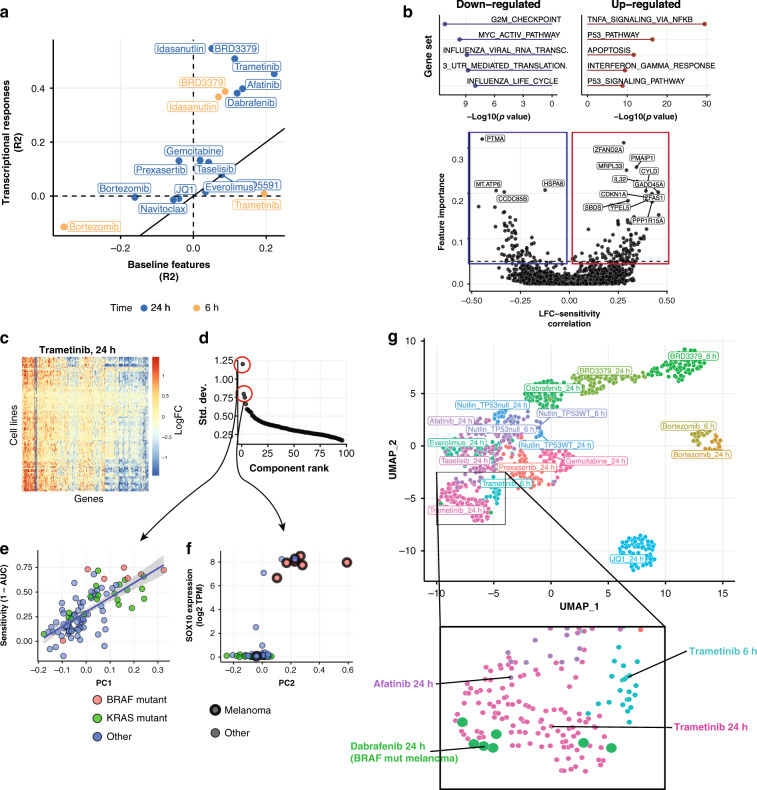
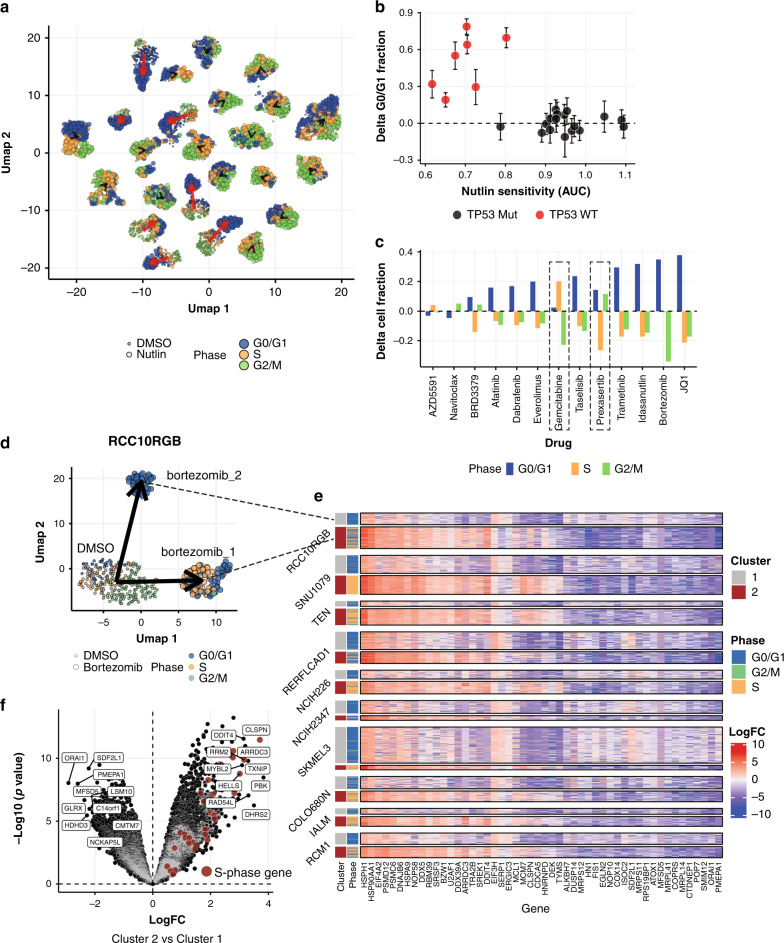
Assays to study cancer cell responses to pharmacologic or genetic perturbations are typically restricted to using simple phenotypic readouts such as proliferation rate. Information-rich assays, such as gene-expression profiling, have generally not permitted efficient profiling of a given perturbation across multiple cellular contexts. Here, we develop MIX-Seq, a method for multiplexed transcriptional profiling of post-perturbation responses across a mixture of samples with single-cell resolution, using SNP-based computational demultiplexing of single-cell RNA-sequencing data. We show that MIX-Seq can be used to profile responses to chemical or genetic perturbations across pools of 100 or more cancer cell lines. We combine it with Cell Hashing to further multiplex additional experimental conditions, such as post-treatment time points or drug doses. Analyzing the high-content readout of scRNA-seq reveals both shared and context-specific transcriptional response components that can identify drug mechanism of action and enable prediction of long-term cell viability from short-term transcriptional responses to treatment.
Conflict of interest statement
A.R. is a co-founder and equity holder of Celsius Therapeutics, equity holder in Immunitas, and an SAB Member of ThermoFisher Scientific, Neogene Therapeutics, Asimov, and Syros Pharmaceuticals. A.J.A. has consulted for Oncorus, Inc., Arrakis Therapeutics, and Merck & Co., Inc. and has research funding from Mirati Therapeutics and Deerfield Management that are unrelated to this work. A.T. is a consultant for Tango Therapeutics. T.R.G. is a consultant to GlaxoSmithKline, a founder of Sherlock Biosciences, and was formerly a consultant and equity holder in Foundation Medicine, acquired by Roche. T.R.G. also receives research funding unrelated to this project from Bayer Healthcare. B.M.W. receives research funding unrelated to this project from Celgene and Lilly and is a consultant for BioLineRx, Celgene, G1 Therapeutics, and GRAIL. The Broad Institute filed a United States Provisional Patent Application directed to work described in this article. The pending Application is entitled “Rapid Prediction of Drug Responsiveness” and was filed on September 2, 2019. The current inventor list includes A.T., A.J.A., F.V., B.R.P., and J.M.M. A.W., K.G.-S., T.S., M.R., O.K., W.N.C., A.J., E.C., D.D., S.B., M.G., I.T., O.R.-R., and J.A.R. declare no competing interests.
Figures

Similar articles
-
Deconvolution of cell type-specific drug responses in human tumor tissue with single-cell RNA-seq.Genome Med. 2021 May 11;13(1):82. doi: 10.1186/s13073-021-00894-y. Genome Med. 2021. PMID: 33975634 Free PMC article.
-
Quantitative and multiplexed chemical-genetic phenotyping in mammalian cells with QMAP-Seq.Nat Commun. 2020 Nov 12;11(1):5722. doi: 10.1038/s41467-020-19553-8. Nat Commun. 2020. PMID: 33184288 Free PMC article.
-
Using single nucleotide variations in single-cell RNA-seq to identify subpopulations and genotype-phenotype linkage.Nat Commun. 2018 Nov 20;9(1):4892. doi: 10.1038/s41467-018-07170-5. Nat Commun. 2018. PMID: 30459309 Free PMC article.
-
Single-Cell RNA-Seq Technologies and Computational Analysis Tools: Application in Cancer Research.Methods Mol Biol. 2022;2413:245-255. doi: 10.1007/978-1-0716-1896-7_23. Methods Mol Biol. 2022. PMID: 35044670 Review.
-
Single-Cell Transcriptomic Analysis of Tumor Heterogeneity.Trends Cancer. 2018 Apr;4(4):264-268. doi: 10.1016/j.trecan.2018.02.003. Epub 2018 Mar 9. Trends Cancer. 2018. PMID: 29606308 Free PMC article. Review.
Cited by
-
Design and Clinical Application of an Integrated Microfluidic Device for Circulating Tumor Cells Isolation and Single-Cell Analysis.Micromachines (Basel). 2021 Jan 2;12(1):49. doi: 10.3390/mi12010049. Micromachines (Basel). 2021. PMID: 33401770 Free PMC article.
-
Leveraging Single-Cell Approaches in Cancer Precision Medicine.Trends Cancer. 2021 Apr;7(4):359-372. doi: 10.1016/j.trecan.2021.01.007. Epub 2021 Feb 6. Trends Cancer. 2021. PMID: 33563578 Free PMC article. Review.
-
Multiplexed live-cell profiling with Raman probes.Nat Commun. 2021 Jun 7;12(1):3405. doi: 10.1038/s41467-021-23700-0. Nat Commun. 2021. PMID: 34099708 Free PMC article.
-
scPerturb: harmonized single-cell perturbation data.Nat Methods. 2024 Mar;21(3):531-540. doi: 10.1038/s41592-023-02144-y. Epub 2024 Jan 26. Nat Methods. 2024. PMID: 38279009
-
A transcriptional biosensor to monitor single cancer cell therapeutic responses by bioluminescence microscopy.Theranostics. 2022 Jan 1;12(2):474-492. doi: 10.7150/thno.63744. eCollection 2022. Theranostics. 2022. PMID: 34976196 Free PMC article.
References
-
- McDonald ER, et al. Project DRIVE: a compendium of cancer dependencies and synthetic lethal relationships uncovered by large-scale, deep RNAi screening. Cell. 2017;170:577.e10–592.e10. - PubMed
-
- Behan FM, et al. Prioritization of cancer therapeutic targets using CRISPR-Cas9 screens. Nature. 2019;568:511–516. - PubMed
Publication types
MeSH terms
Substances
Grants and funding
LinkOut - more resources
Full Text Sources
Other Literature Sources
