. 2020 Aug 12;6(33):eabb8771.
doi: 10.1126/sciadv.abb8771. eCollection 2020 Aug.

TRIBE editing reveals specific mRNA targets of eIF4E-BP in Drosophila and in mammals

Affiliations

TRIBE editing reveals specific mRNA targets of eIF4E-BP in Drosophila and in mammals

Hua Jin et al. Sci Adv. .

Abstract

4E-BP (eIF4E-BP) represses translation initiation by binding to the 5' cap-binding protein eIF4E and inhibiting its activity. Although 4E-BP has been shown to be important in growth control, stress response, cancer, neuronal activity, and mammalian circadian rhythms, it is not understood how it preferentially represses a subset of mRNAs. We successfully used HyperTRIBE (targets of RNA binding proteins identified by editing) to identify in vivo 4E-BP mRNA targets in both Drosophila and mammals under conditions known to activate 4E-BP. The protein associates with specific mRNAs, and ribosome profiling data show that mTOR inhibition changes the translational efficiency of 4E-BP TRIBE targets more substantially compared to nontargets. In both systems, these targets have specific motifs and are enriched in translation-related pathways, which correlate well with the known activity of 4E-BP and suggest that it modulates the binding specificity of eIF4E and contributes to mTOR translational specificity.


Figures

Fig. 1
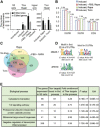
Fig. 1. Thor-HyperTRIBE identifies specific RNAs as 4E-BP targets in Drosophila S2 cells.
(A) Thor-HyperTRIBE but not hyper-ADARcd alone (Hyper only) edits transcripts after copper induction. The editing sites (black bars) and editing genes (gray bars) in Thor-HyperTRIBE significantly increased in rapamycin- or Torin-1–treated cells and more than doubled in rapamycin-treated plus serum-deprived cells. The number of editing events in cells expressing hyper-ADARcd alone is comparable to that of control S2 cells (N = 2, +SEM). (B) Editing sites identified by Thor-HyperTRIBE are enriched in 5′UTR of mRNAs. (C) Venn diagram of Thor-HyperTRIBE target RNAs reproducibly identified under different conditions shows that the targets are consistent, although significantly more were identified with serum deprivation and rapamycin treatment combined. The transcripts edited in S2 or Hyper only control were removed from the target list. One hundred seventy-six target genes were identified in all conditions. (D) Consensus motifs from the 5′UTRs of 968 Thor-HyperTRIBE targets (listed in table S1), which were reproducibly detected in rapamycin or Torin-1 treatment condition. The GGUCACACU motif is identified in both cases with 195 counts (~20%) in the entire 5′UTR of the targets. (E) Table of enriched GO term biological processes in 968 Thor-HyperTRIBE targets reproducibly detected in rapamycin or Torin-1 treatment condition. FDR, false discovery rate.
Fig. 2
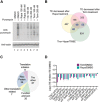
Fig. 2. Ribosome profiling in S2 cells identifies mRNAs regulated by mTOR pathway.
(A) Metabolic labeling by SUnSET shows global protein synthesis reduced after treating S2 cells with mTOR inhibitor, rapamycin, Ink128, or Torin-1 for 2 hours compared to vehicle DMSO. Puromycin was incorporated into newly synthesized peptides, being measured by Western blotting using antibody against puromycin. (B) Ribosome profiling identifies 144 Thor-TRIBE targets (40 + 49 + 55, gene numbers are marked by blue color), TE of which decreased after treating cells with 100 nM rapamycin or Torin-1. Venn diagram overlap of genes between 968 Thor-TRIBE targets, genes with decreased TE after adding rapamycin, and genes with decreased TE after adding Torin-1 (n = 3, TE fold change of mTOR inhibitor versus DMSO < 0.8, P < 0.1). (C) Functional classification of 144 Thor-TRIBE targets, which are from the overlapped portion in (B). The main functions of these genes include ribosome components (Ribo Protein), translational initiation, and other translation-related roles. (D) The translation of most eIF3 mRNAs is repressed by mTOR inhibitor. The bar chart showed log2 TE fold-change value of all expressed eIF3 transcripts (rapamycin/DMSO, blue bar; Torin-1/DMSO, purple bar; n = 3, +SEM).
Fig. 3
Fig. 3. Ribosome profiling data show that the TE change of Thor-TRIBE target after mTOR inhibition has a down-regulation compared with non–Thor-TRIBE target.
(A) The mean TE change of Thor-TRIBE targets is down-regulated compared with nontargets when mTOR pathway is inhibited by mTOR inhibitor, rapamycin, or Torin-1. The degree of decrease varies with different groups of Thor-TRIBE targets. Box plot of mean TE change (log2 value) after a 2-hour treatment with mTOR inhibitor versus vehicle DMSO from different groups of expressed transcripts, including all non–Thor-TRIBE targets (black, n = 5604), Thor-TRIBE targets (purple, n = 919), Thor-TRIBE targets with dMotif-1 (blue, n = 142), and Thor-TRIBE with dPRTE (green, n = 45). Ordinary one-way analysis of variance (ANOVA): *P < 0.05, **P < 0.01, and ***P < 0.001. (B and C) Cumulative frequency distribution of log2 TE fold-change values from non–Thor-TRIBE targets (black, n = 5604) and different groups of Thor-TRIBE targets showed that Thor targets have significantly different TE change from nontargets. Torin-1 versus DMSO shown in (B); rapamycin versus DMSO shown in (C). (D) TE of most Thor-TRIBE targets with dPRTE decreased after treatment of mTOR inhibitor. The bar chart showed log2 TE fold-change value of Thor-TRIBE targets with dPRTE (rapamycin/DMSO, blue bar; Torin-1/DMSO, purple bar; n = 3, +SEM).
Fig. 4
Fig. 4. CLIP of Thor-V5 identifies a direct RNA binding activity.
(A) Schematic illustration of CLIP. UV–cross-linked and lysed Thor-V5 cells were treated with RNase A, and then immunoprecipitation was carried out from cell lysate using an antibody against V5 tag. The partially digested RNAs, which had been cross-linked to RBP, were labeled at their 5′ end by [γ-32P]ATP. Radioisotope-labeled RNA-RBP could be separated and visualized in denaturing LDS polyacrylamide gel. LDS, lithium dodecyl sulfate. (B) CLIP of Thor-V5 shows that Thor has an RNA binding activity. A well-known RBP, Hrp48, was used as a positive control. S2 or Thor-V5 cells were UV–cross-linked (UV+) or not (UV). Immunoprecipitation was carried out using antibody against V5 tag or Hrp48.
Fig. 5
Fig. 5. h4E-BP1 HyperTRIBE identifies h4E-BP1 targets in PC3 cells.
(A) The number of edited sites is significantly higher in h4E-BP1 HyperTRIBE than in wild-type PC3 cells or in Hyper only. The number of edited sites was increased after Ink128 or PP242 treatment (h4E-BP1 Hyper Active). Expressing hyperADARcd alone (Hyper only) did not result in more editing sites than in control PC3 cells. N = 2 to 3, +SEM; *P < 0.05, paired one-tailed Student’s t test; **P < 0.005, unpaired one-tailed Student’s t test. (B) IGV view of three examples of the editing sites and editing percentages of mTOR-sensitive genes VIM, ODC1, and CCND3. Background editing sites detected in control PC3 cells or Hyper only were removed. Samples were incubated with DMSO (black), Ink128 (red), or PP242 (blue). The alignment of mRNA-seq reads is also shown. (C) The editing sites of h4E-BP1 HyperTRIBE are enriched in 5′UTR and 3′UTR of mRNA. (D) Consensus motifs from the 5′UTRs of 711 h4E-BP HyperTRIBE targets (listed in table S4). These targets were detected at least twice after mTOR inhibition. (E) Table of enriched GO term biological processes in 711 h4E-BP1 HyperTRIBE targets. (F) Ortholog mapping between 711 h4E-BP1 HyperTRIBE targets and 968 Thor-HyperTRIBE targets shows that 32% of h4E-BP1 targets are conserved in Drosophila.

Similar articles

Cited by

References

    1. Saxton R. A., Sabatini D. M., mTOR signaling in growth, metabolism, and disease. Cell 168, 960–976 (2017). - PMC - PubMed
    1. Zid B. M., Rogers A. N., Katewa S. D., Vargas M. A., Kolipinski M. C., Lu T. A., Benzer S., Kapahi P., 4E-BP extends lifespan upon dietary restriction by enhancing mitochondrial activity in Drosophila. Cell 139, 149–160 (2009). - PMC - PubMed
    1. Teleman A. A., Chen Y.-W., Cohen S. M., 4E-BP functions as a metabolic brake used under stress conditions but not during normal growth. Genes Dev. 19, 1844–1848 (2005). - PMC - PubMed
    1. Tettweiler G., Miron M., Jenkins M., Sonenberg N., Lasko P. F., Starvation and oxidative stress resistance in Drosophila are mediated through the eIF4E-binding protein, d4E-BP. Genes Dev. 19, 1840–1843 (2005). - PMC - PubMed
    1. Mamane Y., Petroulakis E., LeBacquer O., Sonenberg N., mTOR, translation initiation and cancer. Oncogene 25, 6416–6422 (2006). - PubMed

Publication types

MeSH terms

Substances