Comparative Study
. 2020 Dec;588(7837):315-320.
doi: 10.1038/s41586-020-2700-3. Epub 2020 Aug 26.

Sex differences in immune responses that underlie COVID-19 disease outcomes

Collaborators, Affiliations
Comparative Study

Sex differences in immune responses that underlie COVID-19 disease outcomes

Takehiro Takahashi et al. Nature. 2020 Dec.

Abstract

There is increasing evidence that coronavirus disease 2019 (COVID-19) produces more severe symptoms and higher mortality among men than among women1-5. However, whether immune responses against severe acute respiratory syndrome coronavirus (SARS-CoV-2) differ between sexes, and whether such differences correlate with the sex difference in the disease course of COVID-19, is currently unknown. Here we examined sex differences in viral loads, SARS-CoV-2-specific antibody titres, plasma cytokines and blood-cell phenotyping in patients with moderate COVID-19 who had not received immunomodulatory medications. Male patients had higher plasma levels of innate immune cytokines such as IL-8 and IL-18 along with more robust induction of non-classical monocytes. By contrast, female patients had more robust T cell activation than male patients during SARS-CoV-2 infection. Notably, we found that a poor T cell response negatively correlated with patients' age and was associated with worse disease outcome in male patients, but not in female patients. By contrast, higher levels of innate immune cytokines were associated with worse disease progression in female patients, but not in male patients. These findings provide a possible explanation for the observed sex biases in COVID-19, and provide an important basis for the development of a sex-based approach to the treatment and care of male and female patients with COVID-19.


Conflict of interest statement

Conflict of interest statement All authors declare no competing interests.

Figures

Extended Data Fig. 1
Extended Data Fig. 1. Comparison of basic clinical parameters of Cohort A patient samples and plasma levels of 71 cytokines and chemokines at the first sampling of Cohort A.
a, Comparisons of age, BMI, and DFSO at the first sampling between male and female patients in Cohort A. n=17 and 22 for M_Pt and F_Pt, respectively. b, Comparison of the plasma levels of 71 cytokines and chemokines. n=15, 28, 16, and 19 for M_HCW, F_HCW, M_Pt, and F_Pt, respectively. Data are mean ± SEM. Unpaired two-tailed t-test was used in a and one-way ANOVA with Bonferroni multiple comparison test was used for the comparisons in b. All p-values < 0.10 are shown.
Extended Data Fig. 2
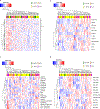
Extended Data Fig. 2. Heatmaps of cytokines and chemokines, PBMC composition, T cell subsets, and T cell cytokine expression at the first sampling of Cohort A patients.
a, A heatmap of the plasma levels (pg/mL) of 71 cytokines and chemokines. n=15, 28, 16, and 19 for M_HCW, F_HCW, M_Pt, and F_Pt, respectively. b, A heatmap for the PBMC composition (% in live PBMCs). n=6, 42, 16, and 21 for M_HCW, F_HCW, M_Pt, and F_Pt, respectively. c, A heatmap for the T cell subsets (% in CD3+ cells). n=6, 45, 16, and 22 for M_HCW, F_HCW, M_Pt, and F_Pt, respectively. d, A heatmap for the intracellular cytokine staining of T cells (% in CD3+ cells). n=6, 43, 16, and 22 for M_HCW, F_HCW, M_Pt, and F_Pt, respectively. In all of these heatmaps, log-transformed values were used for heatmap generation.
Extended Data Fig. 3
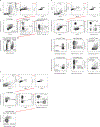
Extended Data Fig. 3. Flow cytometry gating strategy.
Gating strategy used for monocytes (a), CD38+HLA-DR+ and PD-1+TIM-3+ CD4/CD8 T cells (b), and T cell intracellular staining for IFNγ+ CD8 T cells (c).
Fig. 1
Fig. 1. Comparison of virus RNA concentrations, anti-SARS-CoV-2 antibody titers, and plasma cytokines and chemokine levels at the first sampling of Cohort A patients.
a, Comparison of virus RNA measured from nasopharyngeal (Np) swab and saliva. Both n=14 for male (M_Pt) and Female patients (F_Pt) for nasopharyngeal samples, and n=9 and 12, respectively, for saliva samples. Dotted lines indicate the detection limit of the assay (5,610 copies/mL), and negatively tested data are shown on the x-axis (not detected; ND). b, Titers of specific IgG and IgM antibody titers against SARS-CoV-2 S1 protein were measured. n=13, 74, 15, and 20 for IgG, and n=3, 18, 15, and 20 for IgM, for male HCW (M_HCW), female HCW (F_HCW), M_Pt, and F_Pt, respectively. The cutoff values for the positivity are shown with the dotted lines. c, Comparison of the plasma levels of representative innate immune cytokines and chemokines. n=15, 28, 16, and 19 for M_HCW, F_HCW, M_Pt, and F_Pt, respectively. Unpaired two-tailed t-test was used in a and one-way ANOVA with Bonferroni multiple comparison test was used in b and c. All p-values < 0.10 are shown. Data are mean ± SEM. The results of all the cytokines/chemokines measured including those shown here can be found in Extended Data Fig. 1b.
Fig. 2
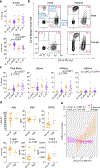
Fig. 2. PBMC composition differences between male and female Cohort A patients at the first sampling.
a, Comparison on the proportion of B cells and T cells in live PBMCs. n=6, 42, 16, and 21 for M_HCW, F_HCW, M_Pt, and F_Pt, respectively. b, Representative 2D plots for CD14 and CD16 in monocytes gate (live/singlets/CD19-CD3-/CD56-CD66b-). Numbers in red indicate the percentages of each population in the parent monocyte gate. c, Comparison between percentages of total Monocytes, cMono, intMono, ncMono in the live PBMCs. n=6, 42, 16, and 21 for M_HCW, F_HCW, M_Pt, and F_Pt, respectively. d, Comparison of age, BMI, DFSO, T cells (% of live PBMCs), and plasma IL-18/CCL5 levels between male patients who had high ncMono and low-intermediate ncMono. n=13 and 4 for “low-int” group and “high” group, respectively, for age, BMI and DFSO. n=12 and 4 for “low-int” group and “high” group, respectively, for T cells and IL-18/CCL5 levels. e, Correlation between plasma CCL5 levels and ncMono (% of live cells). Pearson correlation coefficients (R) and p-values for each sex are shown on top of the plot. ncMono-high male patients (n=4) are shown with orange open squares, and ncMono-low-int male patients (n=11) are shown with orange closed squares. n=19 for female patients (purple circles). Data are mean ± SEM in a, c, and d. One-way ANOVA with Bonferroni multiple comparison test was used in a and c, and unpaired two-tailed t-test used in d. All p-values < 0.10 are shown in the panels.
Fig. 3
Fig. 3. Sex difference in T cell phenotype at the first sampling of Cohort A patients.
a, Percentages of CD4 and CD8 in the CD3-positive cells. b, Representative 2D plots for CD38 and HLA-DR in the CD4 and CD8 T cells. Numbers in red indicate the percentages of CD38+HLA-DR+ populations in the parent gate (live/singlets/CD3+/CD4+ or CD8+). c, Percentages of CD38+HLA-DR+ CD4/CD8 cells in CD3-positive cells are summarized. d, Representative 2D plots for PD-1 and TIM-3 in the CD4 and CD8 T cells are shown. Numbers in red indicate the percentages of PD-1+TIM-3+ populations in the parent gate (live/singlets/CD3+/CD4+ or CD8+/CD45RA). e, Percentages of PD-1+TIM-3+ CD4/8 cells in CD3-positive cells are summarized. n=6, 45, 16, and 22 for M_HCW, F_HCW, M_Pt, and F_Pt, respectively, and one-way ANOVA with Bonferroni multiple comparison test was used for the comparisons in a, c, and e. Data are mean ± SEM. All p-values < 0.10 are shown in the panels.
Fig. 4
Fig. 4. Differential immune phenotypes at the first sampling and disease progression between sexes in Cohort A patients.
Sex-aggregated (a) and disaggregated (b) comparison of age, BMI, RNA concentration in nasopharyngeal swab and Saliva, and anti-S1-IgG between stabilized and deteriorated group. n=11, 6, 16, and 6 for age and BMI, n=9, 5, 9, and 5 for nasopharyngeal swab, n=6, 3, 8, and 4 for saliva, and n=10, 5, 14, and 6 for anti-S1-IgG, for M_stabilized, M_deteriorated, F_stabilized, and F_deteriorated group, respectively. Dotted lines in virus concentration panels and anti-S1-IgG panels indicate the detection limit and cutoff value for positivity, respectively. c, Cytokine/chemokine comparison between stabilized and deteriorated groups. n=10, 6, 14, and 5 for M_stabilized, M_deteriorated, F_stabilized, and F_deteriorated group, respectively. d, Comparisons in the proportions of activated (CD38+HLA-DR+) and terminally differentiated (PD-1+TIM-3+) CD4/CD8 T cells, and IFNγ+CD8 T cells in CD3-positive T cells are shown. n=10, 6, 16, and 6 for M_stabilized, M_deteriorated, F_stabilized, and F_deteriorated group, respectively. e, Pearson correlation heatmaps of the indicated parameters are shown for each sex. For viral RNA concentrations and cytokine/chemokine levels, log-transformed values were used for the calculation of the correlations. The size and color of the circles indicate the correlation coefficient (R), and only statistically significant correlations (p < 0.05) are shown. Clinical deterioration from the first time point was scored by Cmax-C1. n=17 and 22 for male and female, respectively. f, Correlation between age and CD38+HLA-DR+ CD8 T cells (left) and IFNγ+CD8 T cells (right). Pearson correlation coefficient (R) and p-values for each correlation and for each sex are shown on top of each plot. Unpaired two-tailed t-test was used to compare the differences between stabilized group and deteriorated group in a, b, c, and d. Data are mean ± SEM. All p-values < 0.10 are shown in the panels.

Update of

Comment in

Similar articles

Cited by

References

    1. Chen N et al. Epidemiological and clinical characteristics of 99 cases of 2019 novel coronavirus pneumonia in Wuhan, China: a descriptive study. Lancet 395, 507–513, doi:10.1016/S0140-6736(20)30211-7 (2020). - DOI - PMC - PubMed
    1. Li Q et al. Early Transmission Dynamics in Wuhan, China, of Novel Coronavirus-Infected Pneumonia. N Engl J Med 382, 1199–1207, doi:10.1056/NEJMoa2001316 (2020). - DOI - PMC - PubMed
    1. Yang X et al. Clinical course and outcomes of critically ill patients with SARS-CoV-2 pneumonia in Wuhan, China: a single-centered, retrospective, observational study. Lancet Respir Med 8, 475–481, doi:10.1016/S2213-2600(20)30079-5 (2020). - DOI - PMC - PubMed
    1. Meng Y et al. Sex-specific clinical characteristics and prognosis of coronavirus disease-19 infection in Wuhan, China: A retrospective study of 168 severe patients. PLoS Pathog 16, e1008520, doi:10.1371/journal.ppat.1008520 (2020). - DOI - PMC - PubMed
    1. Gebhard C et al. Impact of sex and gender on COVID-19 outcomes in Europe. Biol Sex Differ 11, 29, doi: 10.1186/s13293-020-00304-9 (2020). - DOI - PMC - PubMed

Publication types

MeSH terms