. 2020 Aug 14:8:tkaa028.
doi: 10.1093/burnst/tkaa028. eCollection 2020.

Platelet-rich plasma accelerates skin wound healing by promoting re-epithelialization

Affiliations

Platelet-rich plasma accelerates skin wound healing by promoting re-epithelialization

Pengcheng Xu et al. Burns Trauma. .

Abstract

Background: Autologous platelet-rich plasma (PRP) has been suggested to be effective for wound healing. However, evidence for its use in patients with acute and chronic wounds remains insufficient. The aims of this study were to comprehensively examine the effectiveness, synergy and possible mechanism of PRP-mediated improvement of acute skin wound repair.

Methods: Full-thickness wounds were made on the back of C57/BL6 mice. PRP or saline solution as a control was administered to the wound area. Wound healing rate, local inflammation, angiogenesis, re-epithelialization and collagen deposition were measured at days 3, 5, 7 and 14 after skin injury. The biological character of epidermal stem cells (ESCs), which reflect the potential for re-epithelialization, was further evaluated in vitro and in vivo.

Results: PRP strongly improved skin wound healing, which was associated with regulation of local inflammation, enhancement of angiogenesis and re-epithelialization. PRP treatment significantly reduced the production of inflammatory cytokines interleukin-17A and interleukin-1β. An increase in the local vessel intensity and enhancement of re-epithelialization were also observed in animals with PRP administration and were associated with enhanced secretion of growth factors such as vascular endothelial growth factor and insulin-like growth factor-1. Moreover, PRP treatment ameliorated the survival and activated the migration and proliferation of primary cultured ESCs, and these effects were accompanied by the differentiation of ESCs into adult cells following the changes of CD49f and keratin 10 and keratin 14.

Conclusion: PRP improved skin wound healing by modulating inflammation and increasing angiogenesis and re-epithelialization. However, the underlying regulatory mechanism needs to be investigated in the future. Our data provide a preliminary theoretical foundation for the clinical administration of PRP in wound healing and skin regeneration.

Keywords: Angiogenesis; Collagen deposition; Epidermal stem cells; Inflammation; Re-epithelialization; Wound healing; platelet-rich plasma.


Figures

Figure 1.
Figure 1.
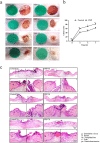
Gross view and morphological observations in the control and PRP treated groups. (a) Sequential photographs of skin wounds in mice treated with saline and PRP at different time points (days 3, 5 and 7 after injection). Compared with the control group, PRP significantly promoted closure with a clean wound with less exudate. (b) Calculation and comparison of the closure rate of each group at different time points on days 3, 5 and 7 after injection. Non-healed area of the PRP group was ~18%, and the difference was statistically significant compared with the control, p < 0.05. Data are presented as the mean ± SD (n = 5). Statistical analysis: **p < 0.01, *p < 0.05. ns p > 0.05. (c) Representative histologic analysis of the wound region. Tissue samples were collected on days 3, 5 and 7 after injection. Hematoxylin and eosin (H&E) staining showed wound healing and re-epithelialization in the PRP group was better than in the control group. Scale bar = 500 μm. Local magnification of the areas surrounded by dashed black boxes shows that the neo-epidermis thickness was increased and the tissue structure was clear after treatment with PRP. Scale bar = 200 μm. PRP platelet-rich plasma, ns no significance
Figure 2.
Figure 2.
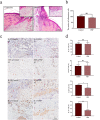
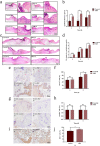
Observation of inflammatory infiltration of wounds in the control and PRP treated groups. (a) Hematoxylin and eosin (H&E) staining of inflammatory cells in mice treated with saline and PRP on day 3 after injection. Red arrows indicate inflammatory cell infiltrates. Scale bar = 200 μm. (b) Statistical analysis of inflammatory infiltrating cells. There was no significant difference between the two groups with p > 0.05. Data are presented as the mean ± SD (n = 5). Statistical analysis: ns p > 0.05. (c) The expression of interleukin-23 (IL-23), tumor necrosis factor-α (TNF-α), interleukin-1β (IL-1β) and interleukin-17 (IL-17) in PRP and control groups on day 3 by immunohistochemical methods. Red arrows indicate positive cell infiltrates. Scale bars = 100 μm. (d) Calculation and comparison of the positive cells of each group on day 3. IL-1β and IL-17 were significantly decreased in the PRP group compared with the control group, while the expression of IL-23 and TNF-α was not significantly different between the two groups. Data are presented as the mean ± SD (n = 5). Statistical analysis: **p < 0.01, *p < 0.05. ns p > 0.05. PRP platelet-rich plasma, ns no significance
Figure 3.
Figure 3.
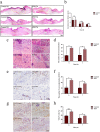
Angiogenesis and granulation tissue formation in the control and PRP treated groups. (a) Hematoxylin and eosin (H&E) staining showing the granulation tissue in the PRP and control groups on days 3, 5 and 7 after injection. The granulation tissue of the PRP group was homogeneous with an internal visible vascular network arrangement. Compared with the control, the granulation tissue was gradually replaced by tissue remodeling in the PRP group, as shown in the yellow area. Scale bar = 500 μm. (b) Quantitative analysis of granulation tissue in the two groups with Image-Pro Plus (IPP) software. There were significant differences between the two groups on days 5 and 7. Data are presented as the mean ± SD (n = 5). Statistical analysis: *p < 0.05. ns p > 0.05. (c) H&E staining analysis of angiogenesis in the PRP and control group on days 5 and 7. Yellow arrows indicated neovascularization in the two groups. Neovascularization was scattered around the wound with different sizes. Scale bar = 100 μm. (d) The statistical results of neovascularization showed that the amount in the PRP group was larger than that of the control group, and the difference was statistically significant on days 5 and 7. Data are presented as the mean ± SD (n = 5). Statistical analysis: *p < 0.05. (e, g) The expression of platelet endothelial cell adhesion molecule-1 (CD31) and vascular endothelial growth factor (VEGF) in the PRP and control group on days 5 and 7 with immunohistochemical methods. Red arrows indicate the positive cells in the two groups. The scale bar = 100 μm. (f, h) Statistical analysis of positive cells of each group on days 5 and 7. The expression of CD31 and VEGF in the PRP group were significantly higher than that in the control group. Data are presented as the mean ± SD (n = 5). Statistical analysis: ***p < 0.001, *p < 0.05. PRP platelet-rich plasma, ns no significance
Figure 4.
Figure 4.
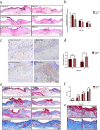
Wound contraction and collagen deposition in the control and PRP treated groups. (a) Wound contraction is represented by the vertical distance between the margins of the wound, as shown by the yellow double-headed arrow. This showed that the distance in the PRP group was shorter than that in the control group. Scale bar = 500 μm. (b) The distance was measured by Image-Pro Plus (IPP) software, and the statistical results showed that there was a significant difference between the two groups on days 3, 5 and 7 after injection. Data are presented as the mean ± SD (n = 5). Statistical analysis: **p < 0.01, *p < 0.05. (c) Immunohistochemical staining with α-smooth muscle actin (α-SMA) in the PRP and control group on days 5 and 7. Positive signals around the wound can be seen, extending to the center of the wound, as shown in the brown area. Scale bar = 100 μm. (d) Statistical analysis of positive signals showed that the secretion of α-SMA in the PRP group was more than that in control group on day 7. Data are presented as the mean ± SD (n = 5). Statistical analysis: *p < 0.05. ns p > 0.05. (e) Masson’s trichrome staining indicated the collagen deposition in the wounds in the PRP and control group on days 3, 5, 7 and 14. The deposition of collagen was significantly greater in the PRP group than that in the control group on days 5 and 14. Scale bar = 500 μm. (f) The collagen volume fraction (CVF) was measured by IPP, and the statistical results showed that there was a significant difference between the two groups on days 5 and 14. Data are presented as the mean ± SD (n = 5). Statistical analysis: **p < 0.01, *p < 0.05. ns p > 0.05. (g) Local magnification of collagen deposition in the wound on days 5 and 14. Collagen deposition in the PRP group was greater than that in the control group and arranged neatly, which was similar to normal skin, and meanwhile the regeneration of skin appendages can be seen. Scale bar = 200 μm. PRP platelet-rich plasma, ns no significance
Figure 5.
Figure 5.
Evaluation of re-epithelialization in the control and PRP treated groups. (a,c) Hematoxylin and eosin (H&E) staining analysis of regenerated skin tissue in the PRP and control groups on days 3, 5 and 7 after injection. (a) The change of thickness of the neo-epidermis, as shown by the yellow arrow in the local magnification; (c) the change in the length of the neo-epithelial tongue, and the yellow dotted line represents the unhealed length. Scale bars = 200 μm and 500 μm, respectively. (b,d) Statistical analysis of neo-epidermis thickness and neo-epithelial tongue length shows that there was a statistically significant difference between the two groups on days 3, 5 and 7. Data are presented as the mean ± SD (n = 5). Statistical analysis: ***p < 0.001, **p < 0.01, *p < 0.05. ns p > 0.05. (e,g) Immunohistochemical staining of proliferating cell nuclear antigen (PCNA) and TUNEL in the PRP and control group on days 3 and 5. The infiltration of positive cells can be seen at the neo-epidermis site, as shown by the brown signal. Scale bar = 100 μm. (f,h) Statistical results of the number of positive cells. Compared with the control group, the number of PCNA positive cells in the PRP group increased significantly, while there was no significant difference for apoptotic cells. Data are presented as the mean ± SD (n = 5). Statistical analysis: *p < 0.05. ns p > 0.05. (i) The immunohistochemical staining with insulin-like growth factor-1 (IGF-1) in the PRP and control group on day 3. The positive cells of IGF-1 in the PRP group were more than that in the control group, as shown by the brown histograms. Scale bar = 100 μm. (j) Statistical results of IGF-1 expression. The expression of positive cells was significantly increased in the PRP group. Data are presented as the mean ± SD (n = 5). Statistical analysis: *p < 0.05. PRP platelet-rich plasma, ns no significance
Figure 6.
Figure 6.
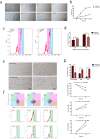
The effect of platelet-rich plasma (PRP) on the biological function of epidermal stem cells (ESCs). (a) Microscopic images of scratch of ESCs at 0, 24, 48 and 72 h, respectively, with or without treatment with 2.5% PRP. Untreated cells were taken as the control. PRP significantly promoted the migration ability of epidermal stem cells, with the scratch at 72 h having basically healed but not in the control group. Scale bar = 500 μm. (b) Calculated scratch migration rate of ESCs. PRP promoted ESCs migration, and the difference was statistically significant relative to the control. Data are presented as the mean ± SD (n = 3). Statistical analysis: **p < 0.01, *p < 0.05, ns p > 0.05. (c) Analysis of the proliferation ability of ESCs by EdU flow detection. R4 represents the mother generation and R3 represents the offspring generation. The number of R4 in the PRP group was lower, while the number of R3 was increased relative to the control group after treatment with PRP for 24 h. (d) Calculation and comparison of proliferating cells at 24 h, the difference was statistically significant between PRP and the control group. Data are presented as the mean ± SD (n = 3). Statistical analysis: **p < 0.01, *p < 0.05. (e) Microscopic images of ESCs after treatment with 2.5% PRP for 48 h. The cells in the PRP group showed a differentiation phenotype with a dendritic shape. The nuclear/cytoplasmic ratio decreased. Scale bars = 200 and 100 μm. (f) The expression of CD71−/CD49f+, and keratin 14/keratin 10 (K14/K10) by flow cytometry after treatment with 2.5% PRP for 48 h. The untreated group (0 h) represents the initial state of the PRP and control groups. The expression of CD49f decreased significantly, while the expression of K10 and K14 were increased relative to the control and untreated group. (g) Data analysis showed that the difference was statistically significant between the control and untreated group. Statistical analysis: ****p < 0.0001, ***p < 0.001, **p < 0.01, *p < 0.05. ns no significance

Similar articles

Cited by

References

    1. Marx RE. Platelet-rich plasma: evidence to support its use. J Oral Maxillofac Surg. 2004; 62(4): 489–96. - PubMed
    1. Chicharro-Alcantara D, Rubio-Zaragoza M, Damiá-Giménez E, Carrillo-Poveda JM, Cuervo-Serrato B, Peláez-Gorrea P, et al. . Platelet rich plasma: new insights for cutaneous wound healing management. J Funct Biomater. 2018; 9(1): 10. - PMC - PubMed
    1. Eppley BL, Woodell JE, Higgins J. Platelet quantification and growth factor analysis from platelet-rich plasma: implications for wound healing. Plast Reconstr Surg. 2004; 114(6): 1502–8. - PubMed
    1. Ozer K, Colak O. Leucocyte- and platelet-rich fibrin as a rescue therapy for small-to-medium-sized complex wounds of the lower extremities. Burns Trauma. 2019; 7: 11 doi: 10.1186/s41038-019-0149-0. - DOI - PMC - PubMed
    1. Sun Y, Cao Y, Zhao R, Xu F, Wu D, Wang Y. The role of autologous PRP on deep partial-thickness burn wound healing in Bama pigs. J Burn Care Res. 2020; 41(3): 657–62. - PubMed