. 2020 Aug 21;369(6506):942-949.
doi: 10.1126/science.aay2767.

BTN3A1 governs antitumor responses by coordinating αβ and γδ T cells

Affiliations

BTN3A1 governs antitumor responses by coordinating αβ and γδ T cells

Kyle K Payne et al. Science. .

Abstract

Gamma delta (γδ) T cells infiltrate most human tumors, but current immunotherapies fail to exploit their in situ major histocompatibility complex-independent tumoricidal potential. Activation of γδ T cells can be elicited by butyrophilin and butyrophilin-like molecules that are structurally similar to the immunosuppressive B7 family members, yet how they regulate and coordinate αβ and γδ T cell responses remains unknown. Here, we report that the butyrophilin BTN3A1 inhibits tumor-reactive αβ T cell receptor activation by preventing segregation of N-glycosylated CD45 from the immune synapse. Notably, CD277-specific antibodies elicit coordinated restoration of αβ T cell effector activity and BTN2A1-dependent γδ lymphocyte cytotoxicity against BTN3A1+ cancer cells, abrogating malignant progression. Targeting BTN3A1 therefore orchestrates cooperative killing of established tumors by αβ and γδ T cells and may present a treatment strategy for tumors resistant to existing immunotherapies.


Figures

Figure 1.
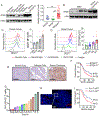
Figure 1.. BTN3A1 is abundantly expressed in ovarian cancer and is associated with poor outcome.
(A) Relative expression of BTN3A1 in normal tissue (n=12), benign ovarian tumors (n=9), and ovarian serous carcinoma (N=42). Data represent mean ± SEM. (B) Expression of BTN3A1 in triple-negative breast cancer (n=4). (C) Expression of CD277 within dissociated human HGSOCs (n=9), data represent mean ± SEM, or (D) breast cancer of mixed histology (n=13) of dendritic cells (CD45+CD1c+CD11c+MHC-II+Zbtb46+) and macrophages (Mϕ; CD45+CD1cCD11c+MHC-II+), tumor cells (CD45EpCAM+), and lymphocytes (CD45+CD1cCD11cMHC-II) after normalization against the isotype control. Data represent mean ± SEM. (E) Representative BTN3A1 expression in indicated tissue samples as determined by immunohistochemistry. Scale bars represent 200 μm. (F) Survival outcome associated with the intensity of BTN3A1 expression within ovarian cancer specimens as assessed by IHC of TMAs corresponding to 200 independent ovarian cancer patients with clinical annotations. (G) Frequency of HGSOC-infiltrating Vγ9Vδ2 T-cells among total CD3+ cells (n=13). (H) Multiplex Immunofluorescence detailing the presence of γδ T-cells (red) within HGSOCs. (I) Survival outcome associated with the frequency of γδ T-cells within 65 HGSOCs with clinical annotations. Statistical analysis was performed as follows: One-way ANOVA (a); Log-rank (Mantel-Cox) test for survival (f,i). *p<0.05, **p≤0.01.
Figure 2.
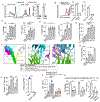
Figure 2.. BTN3A1 specific antibodies relieve αβ T-cell inhibition and activate Vγ9Vδ2 T-cells.
(A) Proliferation and IFNγ release of CD4+ and CD8+ T-cells cultured with OKT3 loaded (500ng/mL) BTN3A1-K32 or Mock-K32 cells at a 10:1 αβ T-cell:K32 ratio after 6 days. (B) Proliferation and IFNγ release of NY-ESO-1 TCR+ T-cells cultured with HLA-A2+ BTN3A1-K32 cells, or HLA-A2+ Mock-K32 cells, loaded with 1μM SLLMWITQV-peptide at a 10:1 T-cell:K32 ratio after 6 days. (C) Proliferation and IFNγ release after 6 days of NY-ESO-1 TCR+ T-cells cultured at a 10:1 T-cell:K32 ratio with HLA-A2+ BTN3A1-K32 cells previously treated, or not, with zoledronate (1μM), loaded with 1μM SLLMWITQV-peptide and pre-incubated with 1μg/ml isotype control or anti-CD277 antibodies (CTX-2026, 20.1, or 103.2). (D) Specific killing of NY-ESO-1 TCR+ T-cells co-cultured with OVCAR3Luci cells pretreated with 1μM zoledronate, or not, and pre-incubated with 1μg/mL isotype control or anti-CD277 antibodies (CTX-2026, 20.1, or 103.2) at a 10:1 αβ T-cell:Target cell ratio for 6 hrs. Data are represented as fold change relative to isotype control. (E) Cytotoxicity of immunopurified tumor-infiltrating CD3+ αβ T cells from 3 HGSOC samples after co-culturing with matched tumor cells pretreated with 1μM zoledronate, or not, and pre-incubated with 1μg/mL isotype control or anti-CD277 antibodies (CTX-2026, 20.1, or 103.2) at a 5:1 αβ T-cell:Target cell ratio for 12 hrs. (F) Co-crystal structure of CTX-2026 interaction with CD277 homodimer in space-fill and ribbon diagram (left); interface highlighting hydrogen bonds between CD277 and CDRH2, CDRH3, and CDRL2 of CTX-2026 (middle) or CDRH1 of CTX-2026 (right); epitopes of CTX-2026 and 20.1, common residues are highlighted in red (bottom). (G) Similar to (D) except immunopurified γδ T cells were used at a 5:1 γδ T-cell:Target cell ratio for 24 hrs. (H) Similar to (E) except immunopurified γδ T cells were used at a 5:1 γδ T-cell:Target cell ratio for 24 hrs. (I) Relative quantity of BTN2A1 mRNA in BTN-K32 cells electroporated with crRNA targeting BTN2A1, or not. (J) IFNγ release from immunopurified γδ T-cells co-cultured with BTN3A1-K32 cells, or BTN3A1-K32BTN2A1-ablated cells previously treated, or not, with zoledronate (1μM), and pre-incubated with 1μg/mL isotype control or anti-CD277 antibodies (CTX-2026, 20.1, or 103.2) at a 5:1 γδ T-cell:K32 ratio after 72 hrs. (K) Proliferation and IFNγ release of immunopurified αβ T-cells cultured with OKT3 loaded (500ng/mL) BTN3A1-K32 or BTN3A1-K32BTN2A1-ablated cells at a 10:1 αβ Tcell:K32 ratio after 6 days. For all histogram panels, data are representative of 3 independent experiments with similar results, and data represent mean ± SEM. Statistical analysis was performed as follows: Two-tailed Student’s t-test (b, i) Two-way ANOVA (a, j, k); One-way ANOVA (c, d, e, g, h, k). ns: not significant, *p<0.05, **p≤0.01, ***p≤0.001.
Figure 3.
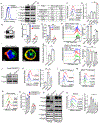
Figure 3.. BTN3A1 interacts with the CD45 phosphatase, blunting proximal T-cell signaling events.
(A) Binding of BTN3A1-Fc to the surface of primary human T-cells (left); immunoblot of purified αβ T-cells after TCR crosslinking by plate-bound OKT3 in the presence of BTN3A1-Fc or control IgG-Fc proteins (all at 10μg/mL) for 1 min (right). (B) LC-MS/MS readout of BTN3A1-specific pulldowns after incubation with activated αβ T-cells. (C) Binding of BTN3A1-Fc to the surface of CD45- Jurkat cells or CD45- Jurkat cells with rescued expression of CD45RA or CD45RO. (D) In situ proximity ligation far red median fluorescence between BTN3A1 and CD45, single stained controls, or detection probes alone (S. Ab), using purified primary T-cells. (E) Immunoblot of CD45 after primary T-cells were coated with either BTN3A1-Fc or PD-L1-Fc (10μg/mL), lysed, and Fc protein immunopurification. (F) Absorbance at 450nm after immobilized BTN3A1 proteins (10μg/mL) were incubated with CD45RA or CD45RO proteins (20μg/mL) and CD45RA and CD45RO detection antibodies (20μg/mL), or after incubation of CD45RA or CD45RO proteins (10μg/mL) and CD45RA and CD45RO detection antibodies (20μg/mL) without BTN3A1 immobilization (S.Ab). (G) Similar to (F), except only the IgV domain of BTN3A1 was immobilized. (H) Proliferation of CD45+ and CD45-ablated primary αβ T-cells cultured with BTN3A1-K32 cells or Mock-K32 cells in the presence or absence of 1μg/ml CTX-2026 or isotype control for 6 days. (I) Segregation of CD45 from CD3ζ in the presence of control-Fc or BTN3A1-Fc proteins (10 μg/mL) after TCR crosslinking in the presence of plate-bound OKT3 (10 μg/mL) for 3 minutes (left); cumulative quantification of CD3ζ and CD45 colocalization in the presence of BTN3A1-Fc or control-Fc proteins from 5 fields per condition with ~120 cells per field (right). Scale bars represent 2 μm. (J) Immunoblot of CD45 Jurkat cells expressing CD45ROE624R after TCR crosslinking by plate-bound OKT3 in the presence of BTN3A1-Fc or control IgG-Fc proteins (all at 10μg/mL) for 1 minute. (K) Binding (left), and median fluorescence (right), of BTN3A1-Fc proteins after primary T-cells were treated overnight with 100U/mL of PNGase F, or vehicle. (L) Binding of BTN3A1-Fc proteins to CD45+ Jurkat cells after treatment overnight with 100U/mL PNGase F, or vehicle. (M) Binding of BTN3A1-Fc proteins to CD45+ Jurkat cells after treatment with the indicated concentrations of Tunicamycin, or vehicle, for 72 hrs. (N) Binding of BTN3A1-Fc proteins to CD45- Jurkat cells or CD45- Jurkat cells expressing CD45RO, CD45RON→D, or CD45ROΔFib. D. (O) Absorbance similar to (F), however N-linked glycans were removed from both CD45RA and CD45RO prior to the assay by overnight treatment with PNGase F. (P) Immunoblot similar to (A), however a portion of the primary T-cells were treated with PNGase F overnight (100U/mL) before the assay. (Q) Binding (left), and median fluorescence (right), of BTN3A1-Fc proteins after primary T-cells were pre-incubated with increasing concentrations of mannan polysaccharides, or vehicle. For all histogram panels, data are representative of 3 independent experiments with similar results, and represent mean ± SEM. Statistical analysis was performed as follows: Two-tailed Student’s t-test (i) Two-way ANOVA (f, g, o); One-way ANOVA (d, h, k, q). ns: not significant, *p<0.05, **p≤0.01, ***p≤0.001.
Figure 4.
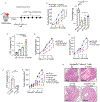
Figure 4.. Targeting CD277 in vivo rescues Ag-specific αβ T-cell responses and leverages the cytotoxic potential of γδ T-cells.
(A) Experimental schema. (B) Progression of NY-OVCAR3 tumors in NSG mice treated with 1.5e6 NY-ESO-1-TCR transduced αβ T-cells and treated every third day with zoledronate (0.05mg/kg; i.p.), or CTX-2026, 20.1, or control IgG (5mg/kg; i.p.) (left); quantification of tumor weight from each group after 15 days (right). Data represent mean ± SEM with 5 mice/treatment group, representative of 3 independent experiments with similar results.. (C) Absolute number of GFP+ CD8+ αβ T-cells within NY-OVCAR3 tumors treated with zoledronate, CTX-2026, 20.1, or control IgG. (D) Progression of NY-OVCAR3 tumors in NSG mice treated with NY-ESO-1-TCR αβ T cells, and treated with Nivolumab©, CTX-2026, or control IgG every third day (5mg/kg; i.p.). Data represent mean ± SEM with 5 mice/treatment group, representative of 3 independent experiments with similar results.. (E) Progression of NY-OVCAR3 tumors in NSG mice treated with CTX-2026 or treated with 3e5 purified γδ T-cells and treated with CTX-2026 or control IgG, every third day. Data represent mean ± SEM with 3 mice/treatment group, representative of 3 independent experiments with similar results.. (F) Absolute number of γδ T-cells within NY-OVCAR3 tumors treated with CTX-2026, 20.1, or control IgG. (G) Progression of NY-OVCAR3 tumors in NSG mice treated with purified γδ T-cells and CTX-2026 or control IgG, αβ T-cells with CTX-2026 or control IgG, or the combination of Ag-specific αβ T-cells and autologous γδ T-cells (ratio of 6:1) with CTX-2026 or control IgG. Data represent mean ± SEM with 3 mice/treatment group, representative of 3 independent experiments with similar results. (H) Representative formation of cystic cavities in NY-OVCAR3 tumors treated with the combination of Ag-specific αβ T-cells, γδ T-cells and CTX-2026. Scale bars represent 3mm. Statistical analysis was performed as follows: Two-tailed Student’s t-tests (b (left), d, e, f, g); One-way ANOVA (b (right), c,). *p<0.05, **p≤0.01, ***p≤0.001.
Figure 5.
Figure 5.. Targeting BTN3A1 rescues spontaneous anti-tumor immunity in BTN3A1tg mice.
(A) Schematic of the CD11c-BTN3A1 construct. (B) BTN3A1 expression on BMDCs generated from wildtype C56/BL6 mice, or BTN3A1KI mice. (C) Proliferation of OT-I T cells in the presence of WT-derived or BTN3A1KI-derived BMDCs previously pulsed with 1 nM SIINFEKL peptide (left panel), and in the presence of CTX-2026 antibody (right panel) after 72hrs (D). (E) Survival of BTN3A1KI mice bearing ID8-Defb29-Vegf-a peritoneal tumors treated every 5 days with zoledronate (n=5; 0.05mg/kg; i.p.), or CTX-2026 (n=5; 5mg/kg; i.p.), 20.1 (n=5; 5mg/kg; i.p.), or control IgG (n=5; 5mg/kg; i.p.), beginning 7 days after tumor challenge. (F) Frequency of CD8+ T-cells among total CD3+ T-cells in the ascites of BTN3A1KI mice bearing ID8-Defb29-Vegf-a peritoneal tumors treated in (E). (G) Elispot readout comparing IFN-γ release from CD8+ T-cells isolated from BTN3A1KI mice bearing ID8-Defb29-Vegf-a peritoneal tumors at day 25, as treated in (E). (H) Frequency of γδ TCR+ T-cells among total CD3+ T-cells in the ascites of BTN3A1KI mice, or WT C57/B16 mice, bearing ID8-Defb29-Vegf-a peritoneal, as treated in (E). Data represent mean ± SEM of 2 independent/5 replicate experiments. (I) Survival of BTN3A1KI mice bearing ID8-Defb29-Vegf-a peritoneal tumors treated every 5 days with PD-1 neutralizing antibody (n=85mg/kg; i.p.), CTX-2026 (n=8; 5mg/kg; i.p.), or irrelevant IgG (n=8; 5mg/kg; i.p.), beginning 7 days after tumor challenge. For figures F and G, data are representative of 3 independent experiments with similar results. Statistical analysis was performed as follows: Log-rank (Mantel-Cox) test for survival (d, e); Two-tailed Student’s t-tests (f); One-way ANOVA (g, h). ns: not significant, *p<0.05, **p≤0.01, ***p≤0.001.

Similar articles

Cited by

References

    1. Hellmann MD et al., Nivolumab plus Ipilimumab in Lung Cancer with a High Tumor Mutational Burden. N Engl J Med 378, 2093–2104 (2018). - PMC - PubMed
    1. Motzer RJ et al., Nivolumab plus Ipilimumab versus Sunitinib in Advanced Renal-Cell Carcinoma. N Engl J Med 378, 1277–1290 (2018). - PMC - PubMed
    1. Horn L et al., First-Line Atezolizumab plus Chemotherapy in Extensive-Stage Small-Cell Lung Cancer. N Engl J Med 379, 2220–2229 (2018). - PubMed
    1. Rutkowski MR et al., Microbially driven TLR5-dependent signaling governs distal malignant progression through tumor-promoting inflammation. Cancer Cell 27, 27–40 (2015). - PMC - PubMed
    1. Vavassori S et al., Butyrophilin 3A1 binds phosphorylated antigens and stimulates human gammadelta T cells. Nat Immunol 14, 908–916 (2013). - PubMed

Publication types