Selective and cross-reactive SARS-CoV-2 T cell epitopes in unexposed humans
- PMID: 32753554
- PMCID: PMC7574914
- DOI: 10.1126/science.abd3871
Selective and cross-reactive SARS-CoV-2 T cell epitopes in unexposed humans
Abstract
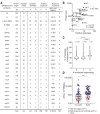
Many unknowns exist about human immune responses to the severe acute respiratory syndrome coronavirus 2 (SARS-CoV-2) virus. SARS-CoV-2-reactive CD4+ T cells have been reported in unexposed individuals, suggesting preexisting cross-reactive T cell memory in 20 to 50% of people. However, the source of those T cells has been speculative. Using human blood samples derived before the SARS-CoV-2 virus was discovered in 2019, we mapped 142 T cell epitopes across the SARS-CoV-2 genome to facilitate precise interrogation of the SARS-CoV-2-specific CD4+ T cell repertoire. We demonstrate a range of preexisting memory CD4+ T cells that are cross-reactive with comparable affinity to SARS-CoV-2 and the common cold coronaviruses human coronavirus (HCoV)-OC43, HCoV-229E, HCoV-NL63, and HCoV-HKU1. Thus, variegated T cell memory to coronaviruses that cause the common cold may underlie at least some of the extensive heterogeneity observed in coronavirus disease 2019 (COVID-19) disease.
Copyright © 2020 The Authors, some rights reserved; exclusive licensee American Association for the Advancement of Science. No claim to original U.S. Government Works.
Figures


Comment in
-
SARS-CoV-2-specific T-cells in unexposed humans: presence of cross-reactive memory cells does not equal protective immunity.Signal Transduct Target Ther. 2020 Oct 6;5(1):224. doi: 10.1038/s41392-020-00338-w. Signal Transduct Target Ther. 2020. PMID: 33024093 Free PMC article. No abstract available.
Similar articles
-
SARS-CoV-2-reactive T cells in healthy donors and patients with COVID-19.Nature. 2020 Nov;587(7833):270-274. doi: 10.1038/s41586-020-2598-9. Epub 2020 Jul 29. Nature. 2020. PMID: 32726801
-
Targets of T Cell Responses to SARS-CoV-2 Coronavirus in Humans with COVID-19 Disease and Unexposed Individuals.Cell. 2020 Jun 25;181(7):1489-1501.e15. doi: 10.1016/j.cell.2020.05.015. Epub 2020 May 20. Cell. 2020. PMID: 32473127 Free PMC article.
-
SARS-CoV-2-Seronegative Subjects Target CTL Epitopes in the SARS-CoV-2 Nucleoprotein Cross-Reactive to Common Cold Coronaviruses.Front Immunol. 2021 Apr 28;12:627568. doi: 10.3389/fimmu.2021.627568. eCollection 2021. Front Immunol. 2021. PMID: 33995351 Free PMC article. Clinical Trial.
-
Overview of lethal human coronaviruses.Signal Transduct Target Ther. 2020 Jun 10;5(1):89. doi: 10.1038/s41392-020-0190-2. Signal Transduct Target Ther. 2020. PMID: 32533062 Free PMC article. Review.
-
Cross-reactive memory T cells and herd immunity to SARS-CoV-2.Nat Rev Immunol. 2020 Nov;20(11):709-713. doi: 10.1038/s41577-020-00460-4. Epub 2020 Oct 6. Nat Rev Immunol. 2020. PMID: 33024281 Free PMC article. Review.
Cited by
-
T-Cell Immune Responses to SARS-CoV-2 Infection and Vaccination.Vaccines (Basel). 2024 Sep 30;12(10):1126. doi: 10.3390/vaccines12101126. Vaccines (Basel). 2024. PMID: 39460293 Free PMC article. Review.
-
Investigation of Long-Term CD4+ T Cell Receptor Repertoire Changes Following SARS-CoV-2 Infection in Patients with Different Severities of Disease.Diagnostics (Basel). 2024 Oct 19;14(20):2330. doi: 10.3390/diagnostics14202330. Diagnostics (Basel). 2024. PMID: 39451653 Free PMC article.
-
The molecular mechanisms of CD8+ T cell responses to SARS-CoV-2 infection mediated by TCR-pMHC interactions.Front Immunol. 2024 Oct 10;15:1468456. doi: 10.3389/fimmu.2024.1468456. eCollection 2024. Front Immunol. 2024. PMID: 39450171 Free PMC article. Review.
-
Induction of an immune response by a nonreplicating adenoviruses-based formulation versus a commercial pseudo-SARS-CoV-2 vaccine.BioTechnologia (Pozn). 2024 Sep 30;105(3):263-272. doi: 10.5114/bta.2024.141805. eCollection 2024. BioTechnologia (Pozn). 2024. PMID: 39439719 Free PMC article.
-
Cellular and humoral response to SARS-CoV-2 vaccine BNT162b2 in adults with Chronic Kidney Disease G4/5.New Microbes New Infect. 2024 Aug 18;62:101458. doi: 10.1016/j.nmni.2024.101458. eCollection 2024 Dec. New Microbes New Infect. 2024. PMID: 39282145 Free PMC article.
References
-
- Huang C., Wang Y., Li X., Ren L., Zhao J., Hu Y., Zhang L., Fan G., Xu J., Gu X., Cheng Z., Yu T., Xia J., Wei Y., Wu W., Xie X., Yin W., Li H., Liu M., Xiao Y., Gao H., Guo L., Xie J., Wang G., Jiang R., Gao Z., Jin Q., Wang J., Cao B., Clinical features of patients infected with 2019 novel coronavirus in Wuhan, China. Lancet 395, 497–506 (2020). 10.1016/S0140-6736(20)30183-5 - DOI - PMC - PubMed
-
- Le Bert N., Tan A. T., Kunasegaran K., Tham C. Y. L., Hafezi M., Chia A., Chng M. H. Y., Lin M., Tan N., Linster M., Chia W. N., Chen M. I.-C., Wang L.-F., Ooi E. E., Kalimuddin S., Tambyah P. A., Low J. G.-H., Tan Y.-J., Bertoletti A., SARS-CoV-2-specific T cell immunity in cases of COVID-19 and SARS, and uninfected controls. Nature (2020). 10.1038/s41586-020-2550-z - DOI - PubMed
-
- Grifoni A., Weiskopf D., Ramirez S. I., Mateus J., Dan J. M., Moderbacher C. R., Rawlings S. A., Sutherland A., Premkumar L., Jadi R. S., Marrama D., de Silva A. M., Frazier A., Carlin A. F., Greenbaum J. A., Peters B., Krammer F., Smith D. M., Crotty S., Sette A., Targets of T cell responses to SARS-CoV-2 coronavirus in humans with COVID-19 disease and unexposed individuals. Cell 181, 1489–1501.e15 (2020). 10.1016/j.cell.2020.05.015 - DOI - PMC - PubMed
-
- Meckiff B. J., Ramírez-Suástegui C., Fajardo V., Chee S. J., Kusnadi A., Simon H., Grifoni A., Pelosi E., Weiskopf D., Sette A., Ay F., Seumois G., Ottensmeier C. H., Vijayanand P., Single-cell transcriptomic analysis of SARS-CoV-2 reactive CD4 + T cells. bioRxiv 2020.06.12.148916 (2020). - PMC - PubMed
Publication types
MeSH terms
Substances
Grants and funding
LinkOut - more resources
Full Text Sources
Other Literature Sources
Research Materials
Miscellaneous

